

Abstract
tRNA‐derived RNA fragments (tRFs), non‐coding single‐stranded RNAs with 14–35 nt in length, were found to play important roles in gene regulation, even in carcinogenesis. In this study, we investigated the expression of tRF‐Leu‐CAG in human non‐small cell lung cancer (NSCLC) and its function in the cell proliferation and cell cycle of NSCLC. The expression level of tRF‐Leu‐CAG was detected in NSCLC tissues, cell lines, and sera. tRF‐Leu‐CAG RNA levels were higher in NSCLC tumor tissues than in normal tissues, and also upregulated in NSCLC cell lines. A significant relationship was observed between stage progression and tRF‐Leu‐CAG in NSCLC sera. We found that in H1299 cells, inhibition of tRF‐Leu‐CAG suppressed cell proliferation and impeded cell cycle. AURKA was also repressed with the knockdown of tRF‐Leu‐CAG. Thus, our study revealed that tRF‐Leu‐CAG may be involved in regulating AURKA and could be a new diagnostic marker and potential therapeutic target in NSCLC.
Keywords: cell cycle, diagnostic biomarker, NSCLC, proliferation, tRF‐Leu‐CAG
1. INTRODUCTION
Lung cancer is one of the most common cancers globally, with the highest mortality in both men and women. Of all lung cancer, non‐small cell lung cancer (NSCLC) accounts for over 80% of cases, the majority of which include adenocarcinoma, squamous cell carcinoma, and large cell carcinoma. The prognosis for NSCLC patients still remains dire, with a low overall 5‐year survival rate of 15% and a high recurrence rate, despite the recent improvements in early diagnosis and clinical treatment strategies.1, 2 Both the prevalence and severity of this disease make the need to elucidate the potential mechanism for the initiation and progression of NSCLC, which is of the utmost importance and urgency. To meet this need, future directives are aimed at not only deepening our understanding of the mechanisms involved in the tumorigenesis of NSCLC, but also prognosticating on potential therapeutic targets.
In recent years, many groups have published data proving the close relationship between small non‐coding RNAs, such as miRNAs, piRNAs, and circRNAs, to a variety of cancers.3, 4, 5 The class of small RNAs, tRNA‐derived RNA fragments (tRFs), are non‐coding single‐stranded RNAs 14–35 nt in length that always derive from the 5' end or 3' end of tRNA in the particular environment.6 The length and the generation of tRFs are very similar to those of miRNAs. However, unlike miRNAs or piRNAs, the biological function of tRFs is still unknown. Some studies have shown that, in biological processes, the function of 5' tRFs might extend much farther than that of 3' tRFs.7, 8 In addition, it has been found that tRFs suppress breast cancer progression via YBX1 displacement.9
tRFs have also been shown to mediate stress responses, which can inhibit protein synthesis.10 Furthermore, some tRFs can affect some cellular functions through Argonaute engagement, such as cell proliferation and RNA silencing.11, 12, 13 In this study, we focused on investigating whether or not tRFs could play an important role in the progression of NSCLC. Based on next‐generation sequencing, we identified a group of tRFs that were upregulated or downregulated in NSCLC. We arrived at the sequence of tRF‐Leu‐CAG using qRT‐PCR, and were able to verify it as a tumor driver in NSCLC. In summary, we demonstrated that, in cancer progression, tRFs could play roles analogous to those of some specific microRNAs.
2. MATERIALS AND METHODS
2.1. Next‐generation sequencing
In this paper, we analyzed 30 pairs of samples that were collected from the NCBI SRA database (http://www.ncbi.nlm.nih.gov/sra/). The Novel Bioinformatics Company accomplished the next‐generation small RNA (smRNA) sequencing, and the RNA‐Seq data focused on alignment of all kinds of tRNAs.
2.2. Cell culture
The human bronchial epithelial cell line 16HBE and the human NSCLC cell lines A549, H1650, PC‐9, 95‐D, and SPCA‐1 were all obtained from the Cell Bank, China Academy of Sciences (Shanghai, China) in 2015. The H1299 and H23 cell lines were obtained from the American Type Culture Collection (ATCC, Manassas, USA) in 2014. 16HBE, A549, PC‐9, 95‐D, and SPCA‐1 cells were cultured in DMEM medium (Corning Cellgro, Manassas, USA) supplemented with 10% (v/v) fetal bovine serum (FBS, Gibco, Gaithersburg, USA). H1299, H23, and H1650 cells were cultured in RPMI 1640 medium (Corning Cellgro) supplemented with 10% (v/v) FBS (Gibco). Culture conditions were 37°C in a 5% CO2 atmosphere. Multiple frozen master stocks were prepared within the first month from receipt for each cell line. The H1299 cell line was authenticated using short tandem repeat analysis on March 25, 2016 by Shanghai Biowing Applied Biotechnology Co. LTD, Shanghai, China, and further verified by morphology before use with images taken. Experiments were performed on H1299 cells resuscitated from master stocks and passaged for no more than 6 months. Absence of mycoplasma contamination was routinely confirmed by PCR analyses.14
2.3. Tissue and serum samples
The tissue and serum samples were obtained from Shanghai Chest Hospital, and the ethical approval was granted by ethics committee of Shanghai Chest Hospital. All the details of tissue samples used in this paper were listed in Table S1.
2.4. Transfection
H1299 cells were transiently transfected with 200 nm of negative control inhibitor (NCi) and tRF‐Leu‐CAG inhibitor (tRFi) (RIBOBIO, Guangzhou, China) using Invitrogen™ Lipofectamine 3000 (Life Technologies, New York, USA), according to the manufacturer's recommendations. Cells were taken 24–48 hr post‐transfection for subsequent experimentation, which included assays for proliferation and cell cycle analysis.
2.5. RNA isolation, reverse transcription, and quantitative real‐time PCR (qRT‐PCR)
Total RNA was isolated using Trizol Reagent (Sangon Biotech, Shanghai, China) and cDNA synthesis was performed with the Mir‐X™ miRNA First‐Strand Synthesis Kit (Clontech, California, USA), both according to the manufacturer's instructions. For the miRNA analyses, qRT‐PCR assays were performed using SYBR GreenII (Takara Biotech, Otsu, Japan) and a CFX96™ Real‐time System (Bio‐Rad, California, USA), according to manufacturer's protocol. Data for relative quantification of tRF‐Leu‐CAG was obtained by normalization to U6 expression levels. The expression levels of mRNAs and miRNAs were determined using the 2−ΔΔCt method for relative quantification of gene expression. ΔCt and ΔΔCt were calculated using the following formulae: ΔCt = CttRF‐Leu‐CAG − CtU6 and ΔΔCt = ΔCtcase − ΔCtcontrol. All the primers used in this paper were listed in Table S2.
2.6. Cell proliferation analysis
Cell proliferation was measured with the Cell Counting Kit‐8 (CCK‐8) assay (Dojindo, Tokyo, Japan). Six hours after transfection, cells were plated in a 96‐well microplate (Corning Incorporated, New York, USA) and incubated at 37°C in 5% CO2. After 24, 48, and 72 hr of culture, 8 μl of CCK‐8 solution was added to each well with 100 μl serum‐free medium and incubated for 2 hr. The absorbance was then measured at 450 nm by a multifunction enzyme‐linked analyzer, FLx8 (BioTek, Vermont, USA). Each data point was measured from three replicate wells.
2.7. Cell cycle analysis
Cell cycle distribution was assessed by propidium iodide (PI) staining. Treated cells (1 × 10⁵ cells) were harvested and fixed with 70% ethanol at −20°C overnight. Cells were then washed with PBS twice and resuspended in 250 μl of RNAse A buffer (100 ng/ml) at room temperature for 30 min. After this step, a 2× solution of PI (100 ng/ml) was added to the mixture, which was then incubated for 15 min in the dark, followed by filtration with a 220‐μm mesh filter membrane. Results were determined by analysis on the MoFlo XDP flow cytometer sorting system (Beckman Coulter, Inc., Brea, USA).
2.8. Western blot analysis
Total protein was extracted using RIPA lysis buffer (CWBIO, Beijing, China) and quantified by Bradford assay, as previously described.15 Equal amounts of protein from each sample were subjected to SDS–PAGE and transferred to a polyvinylidene fluoride (PVDF) membrane (Millipore Corporation, Billerica, USA). The membrane was then soaked in Tris‐buffered saline with Tween‐20 (TBST, 150 mm NaCl, 20 mm Tris‐HCl pH 8.0, 0.05% Tween‐20) containing 5% bovine serum albumin (BSA) for 1 hr at room temperature, followed by gentle shaking and subsequent incubation with specific antibody against target proteins or β‐actin (1:1,000, Cell Signaling Technology, Danvers, USA) at 4°C overnight. Afterward, the membrane was washed and incubated with a horseradish peroxidase (HRP)‐conjugated secondary antibody (1:10,000, Signalway Antibody, Nanjing, China) for 1 hr at room temperature. Protein bands were detected using a chemiluminescent HRP substrate (Millipore Corporation, Billerica, USA) and analyzed by Gelcap software (Tanon, China). AURKA was normalized to β‐actin and expressed as a percentage of the control.
2.9. Statistical analysis
Statistical analyses were performed with spss v.19.0 software and presented graphs were completed using graphpad prism 5 Software. Results are represented as the mean ± SEM or SD, and difference between two experimental groups was evaluated using Student's t‐test with statistical significance defined as p < .05.
3. RESULTS
3.1. Expression of tRFs differs between tumor tissues and non‐tumor tissues
To date, no present studies have published the sequences of tRF‐Leu‐CAG. We collected the data of 30 pairs of NSCLC cases from the NCBI SRA database, and subjected them to next‐generation RNA sequencing (RNA‐Seq). According to the RNA‐Seq data, we found that the tRFs ranged in length, from 18 to 24 nt, in both the tumor and non‐tumor tissues (Figure 1a). We then listed 27 types of tRNAs that were most upregulated in the tumor tissues (Fold change >1.3, p < .05; Table 1) and 25 types of tRNAs that were most downregulated in the tumor tissues (Fold change <0.7, p < .05; Table 2). Among the 27 types of high‐expressing tRNAs, we found that tRNAs‐Leu and tRNAs‐Val were most prevalent, comprising of 37% and 26% respectively (Figure 1b). Based on the tRNA reads, we chose tRNA‐Leu‐CAG1 and tRNA‐Leu‐CAG2 as research subjects. Upon further study we found that the reads of tRNA‐Leu‐CAG1 (Figure 1c) and tRNA‐Leu‐CAG2 (Figure 1d) were upregulated in these 30 pairs of NSCLC tissues when compared with corresponding non‐tumor lung tissues.
Figure 1.
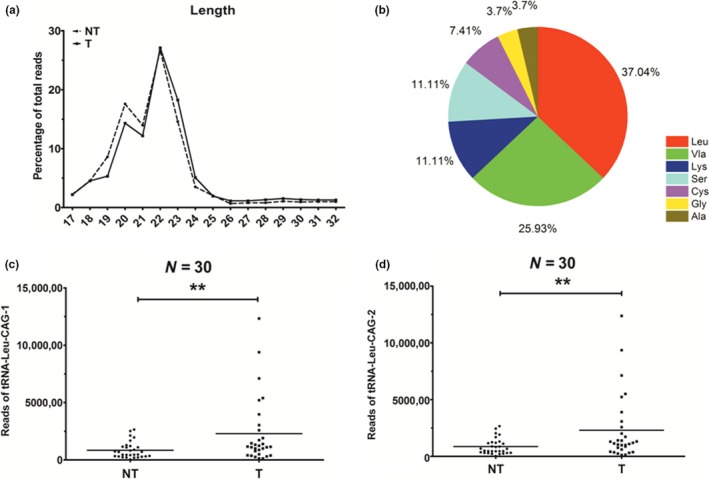
The reads of tRNA‐Leu‐CAG‐1 and tRNA‐Leu‐CAG‐2 are different in NSCLC tumor tissues and matched normal tissues. (a) The length of tRFs in NSCLC tumor tissues and matched normal tissues mainly ranged from 18 to 24 nt. (b) As two of the most prevalent tRNAs, tRNA‐Leu and tRNA‐Val occupied 37% and 26% of the 27 kinds of tRNAs. (c) The reads of tRNA‐Leu‐CAG‐1 were unregulated in NSCLC tumor tissues as compared with corresponding non‐tumor tissues. (d) The reads of tRNA‐Leu‐CAG‐2 were unregulated in NSCLC tumor tissues as compared with corresponding non‐tumor tissues. ***p < .001 [Colour figure can be viewed at wileyonlinelibrary.com]
Table 1.
27 kinds of most upregulated tRNAs
| Sample | Fold change | T | NT | p value |
|---|---|---|---|---|
| tRNA_Leu_AAG_4 | 3.172713111 | 801.3753852 | 252.5836271 | .004201251 |
| tRNA_Leu_CAG_1 | 2.804250923 | 230,645.4357 | 82,248.50129 | .001933085 |
| tRNA_Leu_CAG_2 | 2.760797398 | 231,756.9196 | 83,945.64546 | .002162647 |
| tRNA_Gly_GCC_3 | 2.309178013 | 1393,985.341 | 603,671.6673 | .000143464 |
| tRNA_Leu_TAG_3 | 1.982246801 | 3,070.477443 | 1,548.988472 | .001312548 |
| tRNA_Leu_TAG_1 | 1.955375512 | 9,728.245616 | 4,975.129103 | 4.53239E−05 |
| tRNA_Leu_AAG_6 | 1.9552003 | 9,527.915397 | 4,873.114737 | .000182878 |
| tRNA_Val_CAC_3 | 1.86113318 | 45,817.29453 | 24,617.95589 | .015637719 |
| tRNA_Leu_AAG_1 | 1.838593041 | 9,964.310911 | 5,419.530416 | 9.90589E−05 |
| tRNA_CYS_GCA_19 | 1.806664019 | 22,902.63111 | 12,676.75167 | .001313582 |
| tRNA_Lys_TTT_8 | 1.803072647 | 5,411.39091 | 3,001.205147 | .037750575 |
| tRNA_Lys_CTT_8 | 1.786942506 | 790.361755 | 442.2983685 | .008560741 |
| tRNA_CYS_GCA_17 | 1.786724674 | 23,838.53939 | 13,342.03291 | .001322623 |
| tRNA_Leu_TAG_2 | 1.773009199 | 13,143.30647 | 7,412.993954 | .000615229 |
| tRNA_Ala_AGC_20 | 1.707944036 | 9,240.779776 | 5,410.469888 | .006828369 |
| tRNA_Leu_AAG_2 | 1.685374614 | 9,343.008702 | 5,543.579822 | .004674018 |
| tRNA_Ser_GCT_2 | 1.650111628 | 7,122.263359 | 4,316.231242 | .022429483 |
| tRNA_Ser_AGA_3 | 1.634477543 | 7,778.100879 | 4,758.768887 | .039240762 |
| tRNA_Leu_AAG_7 | 1.510273235 | 1,921.790635 | 1,272.478775 | .023137495 |
| tRNA_Ser_GCT_3 | 1.480868061 | 7,015.581066 | 4,737.478816 | .036081301 |
| tRNA_Val_AAC_4 | 1.43288368 | 32,838.66912 | 22,917.88899 | .005874923 |
| tRNA_Val_CAC_9 | 1.415823982 | 32,556.41348 | 22,994.67582 | .004679108 |
| tRNA_Val_AAC_5 | 1.411114659 | 26,301.42164 | 18,638.75587 | .019289191 |
| tRNA_Lys_CTT_1 | 1.387766517 | 51,005.79223 | 36,753.87151 | .033617249 |
| tRNA_Val_AAC_2 | 1.381384334 | 35,421.80504 | 25,642.25187 | .004805532 |
| tRNA_Val_AAC_3 | 1.367292928 | 33,385.18791 | 24,416.99743 | .006441032 |
| tRNA_Val_CAC_6 | 1.308835565 | 34,463.29839 | 26,331.26676 | .012814352 |
Table 2.
25 kinds of most downregulated tRNAs
| Sample | Fold change | T | NT | p value |
|---|---|---|---|---|
| tRNA_CYS_GCA_21 | 0.349575712 | 331.0205478 | 946.9208987 | .00190625 |
| tRNA_CYS_GCA_14 | 0.387629721 | 220.5311354 | 568.9221522 | .015359734 |
| tRNA_CYS_GCA_7 | 0.39199036 | 508.2695678 | 1,296.637926 | .003407215 |
| tRNA_Leu_AAG_5 | 0.400090834 | 13,052.22591 | 32,623.15653 | .005181329 |
| tRNA_Pro_TGG_3 | 0.419238604 | 11,484.14482 | 27,392.86105 | .001079756 |
| tRNA_Pro_CGG_1 | 0.451717662 | 6,312.611581 | 13,974.68398 | .02192959 |
| tRNA_Pro_CGG_2 | 0.465813869 | 12,843.09593 | 27,571.30427 | .007495983 |
| tRNA_Pro_TGG_1 | 0.502857458 | 12,471.90193 | 24,802.06216 | .002589743 |
| tRNA_Lys_TTT_3 | 0.505312314 | 20,585.03022 | 40,737.2424 | .006058443 |
| tRNA_Lys_TTT_5 | 0.507027046 | 19,235.72284 | 37,938.25789 | .010446554 |
| tRNA_Pro_AGG_1 | 0.536783814 | 8,011.687859 | 14,925.3529 | .00339501 |
| tRNA_Ala_CGC_1 | 0.547216193 | 7,744.588765 | 14,152.70392 | .011097645 |
| tRNA_Ala_AGC_8 | 0.547434492 | 11,229.30123 | 20,512.59355 | .006582313 |
| tRNA_CYS_GCA_2 | 0.553168831 | 778.6977864 | 1,407.703657 | .020811284 |
| tRNA_Ala_AGC_11 | 0.55805187 | 10,554.81628 | 18,913.68321 | .010496126 |
| tRNA_CYS_GCA_12 | 0.569370633 | 892.8077931 | 1,568.06084 | .025420816 |
| tRNA_Asp_GTC_1 | 0.569883137 | 1,854.080235 | 3,253.439373 | .036346423 |
| tRNA_Glu_CTC_1 | 0.579009513 | 6,099.347957 | 10,534.10665 | .010739604 |
| tRNA_Gln_CTG_3 | 0.581336493 | 8,895.481508 | 15,301.77723 | .028510455 |
| tRNA_Pro_TGG_2 | 0.582805437 | 8,985.8475 | 15,418.263 | .015614235 |
| tRNA_Asp_GTC_7 | 0.585285065 | 11,567.8821 | 19,764.52637 | .033403907 |
| tRNA_Pro_AGG_2 | 0.590793245 | 7,080.556082 | 11,984.82912 | .029998874 |
| tRNA_Gln_CTG_11 | 0.614480813 | 9,978.677029 | 16,239.20034 | .032019554 |
| tRNA_Thr_CGT_2 | 0.638928676 | 729.8679661 | 1,142.330894 | .029826793 |
| tRNA_Thr_CGT_5 | 0.644366768 | 6,110.204302 | 9,482.494457 | .045118748 |
3.2. tRF‐Leu‐CAG is a type of tRNA halves
Prior to this study, we had no knowledge of the sequence of tRF‐Leu‐CAG. To get the sequence of tRF‐Leu‐CAG, we first established a cDNA library of smRNAs using the SYBR® PrimeScript™miRNA RT‐PCR Kit (Takara). We then used qRT‐PCR to examine the expression of tRF‐Leu‐CAG with the following primers; the upstream primer was GTCAGGATGGCCGAGCGGTCTAAGGCGC, the downstream primer was a universal primer. We detected the product of the qRT‐PCR with agarose gel electrophoresis, and the results showed a single electrophoresis band about 100 bp in size (Figure 2a). Based on DNA sequencing, the fragment was 34 nt long and the cleavage site was located on the anticodon loop. Because the sequences of tRNA‐Leu‐CAG1 and tRNA‐Leu‐CAG2 were nearly identical, with only one nucleotide difference at the 3' end (Figure 2b, c), we thought that tRF‐Leu‐CAG might be a degradation product from tRNA‐Leu‐CAG1 and tRNA‐Leu‐CAG2, which are types of tRNA halves.
Figure 2.
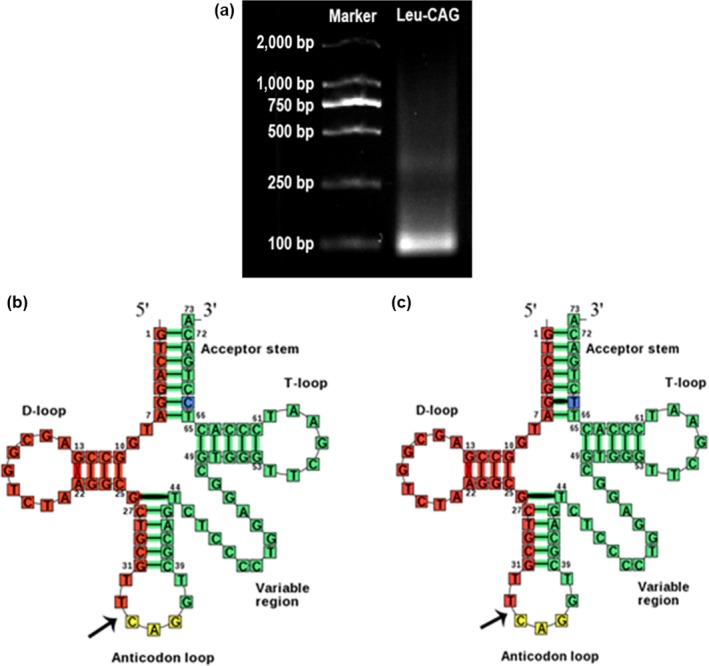
tRF‐Leu‐CAG is a kind of tRNA halves. (a) The product of qRT‐PCR (10 μl) was run on 2% agarose gel, stained with GoldView, and visualized under UV illumination. (b) and (c) tRF‐Leu‐CAG was derived from 5′ ends of tRNA‐Leu‐CAG‐1 and tRNA‐Leu‐CAG‐2 with the length of 34 nt. The cleavage site is located on the anticodon loop [Colour figure can be viewed at wileyonlinelibrary.com]
3.3. tRF‐Leu‐CAG is strongly expressed in NSCLC
To discuss the role of tRF‐Leu‐CAG in lung carcinogenesis, we first sought to detect the expression level of tRF‐Leu‐CAG in 60 NSCLC patient cases. The data we had obtained revealed that, when compared with corresponding non‐tumor lung tissues, tRF‐Leu‐CAG was upregulated in 51 cases (85%) (Figure 3a). We also examined the expression of tRF‐Leu‐CAG in NSCLC cell lines, and found that tRF‐Leu‐CAG was significantly upregulated in SPCA‐1 (p < .01), 95‐D, H1650, A549, H1299, PC‐9, and H23 cells (p < .001), as compared with 16HBE control cells (Figure 3b). These results suggested an associated between the reduction in tRF‐Leu‐CAG expression and NSCLC carcinogenesis. Based on this finding, we chose the H1299 cell line to test the effects of tRF‐Leu‐CAG on cell proliferation and cell cycle.
Figure 3.
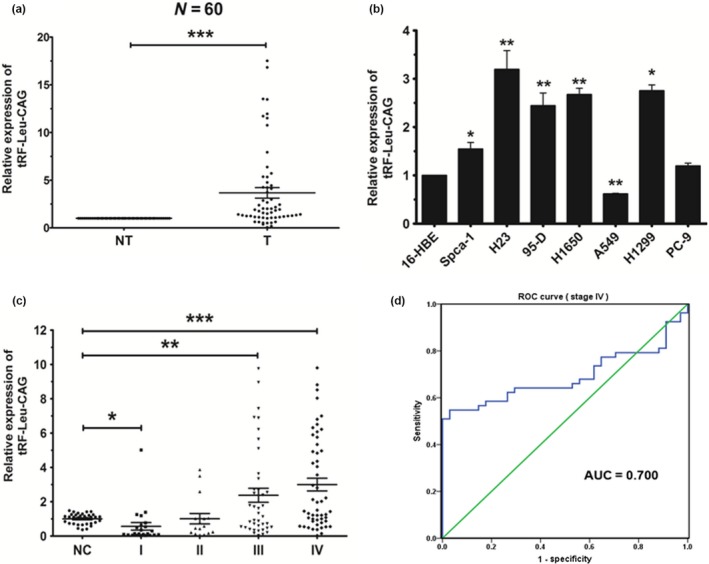
tRF‐Leu‐CAG is upregulated in NSCLC tissues, cell lines and sera. (a) The relative expression level of tRF‐Leu‐CAG in corresponding non‐tumor lung tissues (NT) and tumor tissues (T) as obtained by qRT‐PCR. U6 was used for normalization. (b) The relative expression level of tRF‐Leu‐CAG in NSCLC cell lines or a pulmonary epithelial cell line (control), as measured by qRT‐PCR. (c) The relative expression level of tRF‐Leu‐CAG in NSCLC sera as obtained from qRT‐PCR. U6 was used for normalization. (d) According to the analysis of ROC curve, tRF‐Leu‐CAG could be a potential diagnostic marker in stage IV NSCLC cases. *p < .05, **p < .01, ***p < .001 [Colour figure can be viewed at wileyonlinelibrary.com]
3.4. tRF‐Leu‐CAG is upregulated in sera of advanced NSCLC stages
To discuss whether or not tRF‐Leu‐CAG could serve as a diagnostic marker for identification of NSCLC, we detected the expression level of tRF‐Leu‐CAG in sera from 167 cases, including 34 normal cases, 23 stage I cases, 16 stage II cases, 41 stage III cases, and 53 stage IV cases. We then found that the expression of tRF‐Leu‐CAG was greatly upregulated in stage III and stage IV cases, and related with the development of stage (Figure 3c). According to the analysis of ROC curve, the AUC of stage IV cases is 0.7 (Figure 3d), so we demonstrated that tRF‐Leu‐CAG could function as diagnostic marker in NSCLC stage IV cases.
3.5. tRF‐Leu‐CAG promotes cell proliferation and cell cycle progression in NSCLC
To investigate the effect of tRF‐Leu‐CAG on cell proliferation in NSCLC, H1299 cells were transfected with tRF‐Leu‐CAG inhibitor, and the results validated that transfection with the tRF‐Leu‐CAG inhibitor did decrease the level of tRF‐Leu‐CAG in H1299 cells (Figure 4a). Proliferation of NSCLC cells was assessed with CCK‐8 assays (Figure 4b). Our results showed that, following transfection with tRF‐Leu‐CAG inhibitor, the cellular proliferation of H1299 cells declined gradually. After 72 hr of treatment with tRF‐Leu‐CAG inhibitor, we observed a significant decrease in NSCLC cell growth, when compared with the negative control (NC). Additionally, 48 hr after transfection with tRF‐Leu‐CAG inhibitor, the proportion of cells at G0/G1 phase increased more than 7% and more than 10% over the control, respectively (Figure 4c). These results demonstrated that tRF‐Leu‐CAG could promote the proliferation of NSCLC cells and cause G0/G1 cell cycle progression.
Figure 4.
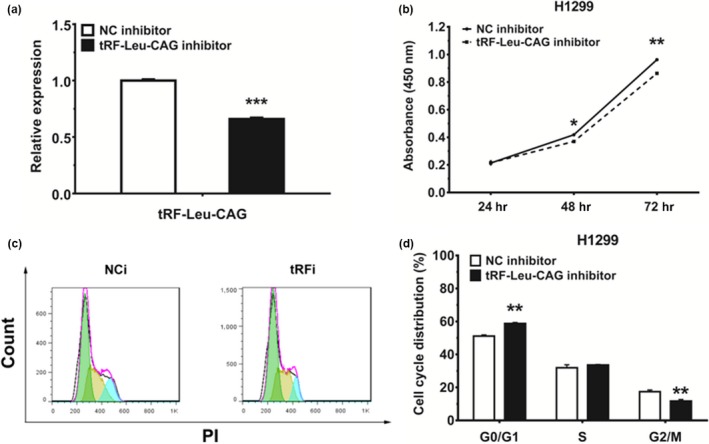
tRF‐Leu‐CAG can promote cell proliferation and cell cycle progression in NSCLC cell lines. (a) The expression of tRF‐Leu‐CAG was measured by qRT‐PCR in H1299 cells 48 hr after transfection with negative control (NCi) and tRF‐Leu‐CAG inhibitor (tRFi). tRF‐Leu‐CAG was suppressed by tRF‐Leu‐CAG inhibitor. (b) H1299 cells were transfected with NC or tRF‐Leu‐CAG inhibitor, and cell proliferation was determined by CCK‐8. (c‐d) The cell cycle distributions of H1299 cells transfected with NC or tRF‐Leu‐CAG inhibitor as detected by flow cytometry. *p < .05, **p < .01, ***p < .001 [Colour figure can be viewed at wileyonlinelibrary.com]
3.6. The inhibition of tRF‐Leu‐CAG can downregulate AURKA in H1299 cells
Based on the observed effects tRF‐Leu‐CAG inhibitor had on tRF‐Leu‐CAG, we postulated that tRF‐Leu‐CAG might be involved in several signal pathways through acting on some target genes. To determine the biological effects of tRF‐Leu‐CAG, H1299 cells were transfected with tRF‐Leu‐CAG inhibitor and incubated for 48 hr. We then detected the protein levels of several target genes, and found that the expression of AURKA was significantly downregulated in H1299 cells transfected with tRF‐Leu‐CAG inhibitor (Figure 5a).
Figure 5.
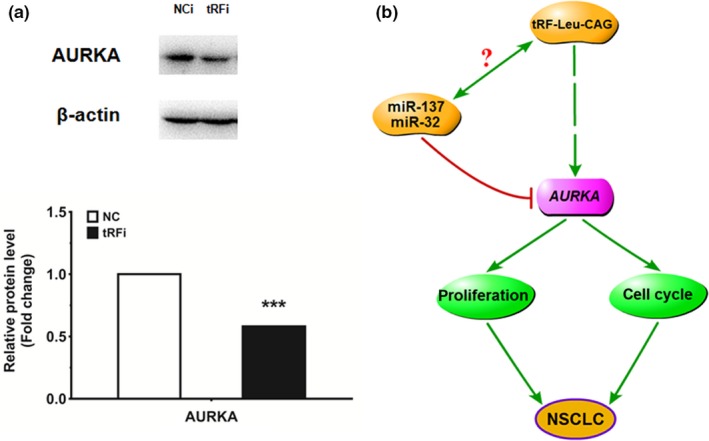
The protein level of AURKA is downregulated in H1299 cells transfected with tRF‐Leu‐CAG inhibitor. (a) The representative images of Western blot analyses for protein levels of several target genes. The protein level of AURKA was quantified by densitometry after normalization to β‐actin. Values are mean ± SEM. **p < .01, ***p < .001. (b) We propose that tRF‐Leu‐CAG plays the role of tumor driver in NSCLC by downregulating AURKA, and may also be closely correlated with other genes related to the cancer process [Colour figure can be viewed at wileyonlinelibrary.com]
4. DISCUSSION
Modern science is currently experiencing a great abundance of research focused on the biological function of small non‐coding RNAs (sncRNAs) in diseases. Our lab has discovered that miR‐34a, miR‐486‐5p, miR‐146‐5p, miR‐181a‐5p, miR‐137, and miR‐32 play important roles in cancer progression.4, 16, 17, 18, 19, 20 These findings verify that altered miRNA expression may be associated with the tumorigenesis of NSCLC. However, despite the achievement of many breakthroughs, the regulatory mechanism of most sncRNAs remains unknown, including that of tRFs. Although tRFs have been known and studied for more than 20 years, they were once thought of as a kind of miRNAs. Later, they were affirmed to be a type of cleavage product from tRNAs, different from miRNAs. At present, the research on tRFs is still very limited and their function still unknown.12, 13
An increasing number of literature supports the existence of highly abundant miRNA‐like tRNA fragments in a variety of cell types,6, 12, 21, 22, 23, 24, 25, 26 however no conclusive evidence of their function has yet been shown. Our data demonstrated that tRF‐Leu‐CAG, while it has all of the structural and functional characteristics of a miRNA, is derived from the 5' end of two mature tRNAs. Additionally, like miRNAs, it can be achieved by reverse transcription and can also be detected by qRT‐PCR. The expression of tRF‐Leu‐CAG was significantly upregulated in NSCLC tissues, cell lines, and sera, and showed a positive correlation with cancer stage. These results indicate the potential for tRFs as diagnostic markers in the near future.27
In addition to the classical role of delivering amino acids to nascent peptide chains, tRNAs and tRFs also have the capacity to regulate a range of cellular processes, including translational efficiency under stress conditions,28 mitochondrial‐mediated apoptosis,29 and oncogenic transformation.30 The data herein demonstrated that tRFs can regulate biological progression in a sequence‐specific, miRNA‐like fashion, further extending the regulatory repertoire of tRFs, adding the ability to affect the proliferation and cell cycle of cancer cell lines.31, 32
Interestingly, we also observed that tRF‐Leu‐CAG could regulate downstream target genes. When the expression of tRF‐Leu‐CAG was knocked down, the expression of AURKA was also suppressed. Our previous studies showed that miR‐137 and miR‐32 could directly target AURKA and affect the progression of NSCLC.18, 20 We then summarized that tRF‐Leu‐CAG could be involved in some signaling pathways through AURKA (Figure 5b). However, we do not yet know whether or not the gene AURUK is direct target of tRF‐Leu‐CAG and tRF‐Leu‐CAG can interact with miR‐137 or miR‐32, which means microRNAs and tRFs should co‐regulate gene expression in cell. We will focus on the interesting topic in the near future.
Based on our results, we believe that a degradation process exists in tRNAs, and have named this process “tRNA degradation.” And the results showed inhibition of tRF‐Leu‐CAG could suppress the lung cancer. We are also going to investigate the possibilities of drug development. Much remains to be elucidated regarding the biogenesis and function of tRF‐Leu‐CAG and other tRF molecules.33, 34 Further investigation will reveal the degree of tRF interaction with genes, with potentially far‐reaching biological consequences.35, 36
CONFLICT OF INTEREST
No potential conflicts of interest were disclosed by the authors.
Supporting information
ACKNOWLEDGEMENTS
The authors thank Dr. Yanli Li who gave good comments in the course of this work.
Shao Y, Sun Q, Liu X, Wang P, Wu R, Ma Z. tRF‐Leu‐CAG promotes cell proliferation and cell cycle in non‐small cell lung cancer. Chem Biol Drug Des. 2017;90:730–738. https://doi.org/10.1111/cbdd.12994
Funding information
The support of National Natural Science Foundation of China (No.91543123) and National Natural Science Foundation of China (No.81001037) is gratefully acknowledged.
Yang Shao and Qiangling Sun contributed equally to this work.
REFERENCES
- 1. Farhat F. S., Houhou W., Ther. Adv. Med. Oncol. 2013, 5, 249. [DOI] [PMC free article] [PubMed] [Google Scholar]
- 2. Chen W., Zheng R., Baade P. D., Zhang S., Zeng H., Bray F., Jemal A., Yu X. Q., He J., CA Cancer J. Clin. 2016, 66, 115. [DOI] [PubMed] [Google Scholar]
- 3. Qin M., Liu G., Huo X., Tao X., Sun X., Ge Z., Yang J., Fan J., Liu L., Qin W., Cancer Biomark. 2016, 16, 161. [DOI] [PMC free article] [PubMed] [Google Scholar]
- 4. Shao Y., Shen Y. Q., Li Y. L., Liang C., Zhang B. J., Lu S. D., He Y. Y., Wang P., Sun Q. L., Jin Y. X., Ma Z. L., Oncotarget 2016, 7, 34011. [DOI] [PMC free article] [PubMed] [Google Scholar]
- 5. Assumpcao C. B., Calcagno D. Q., Araujo T. M., Santos S. E., Santos A. K., Riggins G. J., Burbano R. R., Assumpcao P. P., Epigenomics 2015, 7, 975. [DOI] [PMC free article] [PubMed] [Google Scholar]
- 6. Lee Y. S., Shibata Y., Malhotra A., Dutta A., Genes Dev. 2009, 23, 2639. [DOI] [PMC free article] [PubMed] [Google Scholar]
- 7. Dhahbi J. M., Spindler S. R., Atamna H., Yamakawa A., Boffelli D., Mote P., Martin D. I., BMC Genom. 2013, 14, 298. [DOI] [PMC free article] [PubMed] [Google Scholar]
- 8. Andersen K. L., Collins K., Mol. Biol. Cell 2012, 23, 36. [DOI] [PMC free article] [PubMed] [Google Scholar]
- 9. Goodarzi H., Liu X., Nguyen H. C., Zhang S., Fish L., Tavazoie S. F., Cell 2015, 161, 790. [DOI] [PMC free article] [PubMed] [Google Scholar]
- 10. Emara M. M., Ivanov P., Hickman T., Dawra N., Tisdale S., Kedersha N., Hu G. F., Anderson P., J. Biol. Chem. 2010, 285, 10959. [DOI] [PMC free article] [PubMed] [Google Scholar]
- 11. Gebetsberger J., Polacek N., RNA Biol. 2013, 10, 1798. [DOI] [PMC free article] [PubMed] [Google Scholar]
- 12. Haussecker D., Huang Y., Lau A., Parameswaran P., Fire A. Z., Kay M. A., RNA 2010, 16, 673. [DOI] [PMC free article] [PubMed] [Google Scholar]
- 13. Garcia‐Silva M. R., Cabrera‐Cabrera F., Guida M. C., Cayota A., Genes 2012, 3, 603. [DOI] [PMC free article] [PubMed] [Google Scholar]
- 14. Toji L. H., Lenchitz T. C., Kwiatkowski V. A., Sarama J. A., Mulivor R. A., In Vitro Cell. Dev. Biol. Anim. 1998, 34, 356. [DOI] [PubMed] [Google Scholar]
- 15. Bradford M. M., Anal. Biochem. 1976, 72, 248. [DOI] [PubMed] [Google Scholar]
- 16. Ma Z., Qiu X., Wang D., Li Y., Zhang B., Yuan T., Wei J., Zhao B., Zhao X., Lou J., Jin Y., Jin Y., Acta Biochim. Biophys. Sin. 2015, 47, 630. [DOI] [PubMed] [Google Scholar]
- 17. Ma Z. L., Hou P. P., Li Y. L., Wang D. T., Yuan T. W., Wei J. L., Zhao B. T., Lou J. T., Zhao X. T., Jin Y., Jin Y. X., Tumour Biol. 2015, 36, 2481. [DOI] [PubMed] [Google Scholar]
- 18. Ma Z. L., Zhang B. J., Wang D. T., Li X., Wei J. L., Zhao B. T., Jin Y., Li Y. L., Jin Y. X., Oncotarget 2015, 6, 20111. [DOI] [PMC free article] [PubMed] [Google Scholar]
- 19. Li Y. L., Wang J., Zhang C. Y., Shen Y. Q., Wang H. M., Ding L., Gu Y. C., Lou J. T., Zhao X. T., Ma Z. L., Jin Y. X., Tumor Biol. 2016, 3, 7. [Google Scholar]
- 20. Zhang B., Ma Z., Li X., Zhang C., Shao Y., Liu Z., Li Y., Jin Y., Acta Biochim. Biophys. Sin. 2016, 48, 768. [DOI] [PubMed] [Google Scholar]
- 21. Hsieh L. C., Lin S. I., Shih A. C., Chen J. W., Lin W. Y., Tseng C. Y., Li W. H., Chiou T. J., Plant Physiol. 2009, 151, 2120. [DOI] [PMC free article] [PubMed] [Google Scholar]
- 22. Couvillion M. T., Sachidanandam R., Collins K., Genes Dev. 2010, 24, 2742. [DOI] [PMC free article] [PubMed] [Google Scholar]
- 23. Babiarz J. E., Ruby J. G., Wang Y., Bartel D. P., Blelloch R., Genes Dev. 2008, 22, 2773. [DOI] [PMC free article] [PubMed] [Google Scholar]
- 24. Kawaji H., Nakamura M., Takahashi Y., Sandelin A., Katayama S., Fukuda S., Daub C. O., Kai C., Kawai J., Yasuda J., Carninci P., Hayashizaki Y., BMC Genom. 2008, 9, 157. [DOI] [PMC free article] [PubMed] [Google Scholar]
- 25. Cole C., Sobala A., Lu C., Thatcher S. R., Bowman A., Brown J. W., Green P. J., Barton G. J., Hutvagner G., RNA 2009, 15, 2147. [DOI] [PMC free article] [PubMed] [Google Scholar]
- 26. Burroughs A. M., Ando Y., de Hoon M. J., Tomaru Y., Suzuki H., Hayashizaki Y., Daub C. O., RNA Biol. 2011, 8, 158. [DOI] [PMC free article] [PubMed] [Google Scholar]
- 27. Pederson T., RNA 2010, 16, 1865. [DOI] [PMC free article] [PubMed] [Google Scholar]
- 28. Ivanov P., Emara M. M., Villen J., Gygi S. P., Anderson P., Mol. Cell 2011, 43, 613. [DOI] [PMC free article] [PubMed] [Google Scholar]
- 29. Mei Y., Yong J., Liu H., Shi Y., Meinkoth J., Dreyfuss G., Yang X., Mol. Cell 2010, 37, 668. . [DOI] [PMC free article] [PubMed] [Google Scholar]
- 30. Marshall L., Kenneth N. S., White R. J., Cell 2008, 133, 78. [DOI] [PubMed] [Google Scholar]
- 31. Thompson D. M., Lu C., Green P. J., Parker R., RNA 2008, 14, 2095. [DOI] [PMC free article] [PubMed] [Google Scholar]
- 32. Lee S. R., Collins K., J. Biol. Chem. 2005, 280, 42744. [DOI] [PubMed] [Google Scholar]
- 33. Chen Q., Yan M., Cao Z., Li X., Zhang Y., Shi J., Feng G. H., Peng H., Zhang X., Zhang Y., Qian J., Duan E., Zhai Q., Zhou Q., Science 2016, 351, 397. [DOI] [PubMed] [Google Scholar]
- 34. Goodarzi H., Nguyen H. C., Zhang S., Dill B. D., Molina H., Tavazoie S. F., Cell 2016, 165, 1416. [DOI] [PMC free article] [PubMed] [Google Scholar]
- 35. Miyoshi K., Miyoshi T., Siomi H., Mol. Genet. Genomics 2010, 284, 95. [DOI] [PubMed] [Google Scholar]
- 36. Ender C., Krek A., Friedlander M. R., Beitzinger M., Weinmann L., Chen W., Pfeffer S., Rajewsky N., Meister G., Mol. Cell 2008, 32, 519. [DOI] [PubMed] [Google Scholar]
Associated Data
This section collects any data citations, data availability statements, or supplementary materials included in this article.
Supplementary Materials