Abstract
The possibility of regulating cell signaling with high spatial and temporal resolution within individual cells and complex cellular networks has important implications in biomedicine. In this report, we demonstrate a general strategy that uses near-infrared tissue-penetrating laser pulses to uncage biomolecules from plasmonic gold-coated liposomes, i.e. plasmonic liposomes, to activate cell signaling in a non-thermal, ultrafast and highly controllable fashion. Near-infrared picosecond laser pulse induces transient nanobubbles around plasmonic liposomes. The mechanical force generated from the collapse of nanobubbles rapidly ejects encapsulated compound within 0.1 ms. We showed that single pulse irradiation triggers the rapid intracellular uncaging of calcein from plasmonic liposomes inside endo-lysosomes. The uncaged calcein then evenly distributes over the entire cytosol and nucleus. Furthermore, we demonstrated the ability to trigger calcium signaling in both an immortalized cell line and primary dorsal root ganglion (DRG) neurons by intracellular uncaging of inositol triphosphate (IP3), an endogenous cell calcium signaling second messenger. Compared with other uncaging techniques, this ultrafast near-infrared light-driven molecular uncaging method is easily adaptable to deliver a wide range of bioactive molecules with an ultrafast optical switch, enabling new possibilities to investigate signaling pathways within individual cells and cellular networks.
Keywords: intracellular delivery, plasmonic nanobubble, smart nanocarriers, uncaging technique
1. Introduction
Cell signaling pathways govern a wide range of critical physiological processes, including organism development, tissue repair and immunity. Dysfunctional cell signaling often leads to severe health consequences, such as birth defects, cancers, diabetes and other diseases.[1] For example, it has been reported that defects in calcium signaling contribute to the onset of various diseases including Alzheimer’s disease, bipolar disorder, and diabetes.[2] Modulation of critical cellular signaling pathways can have profound benefits in restoring cellular function and providing therapeutic treatment.[3] Strategies that can regulate the spatiotemporal dynamics of cell signaling in living systems will open up new avenues to understand cell functions and potentially lead to new disease treatments.[4–6] So far, the most commonly used approach is by caged compounds.[7, 8] However, the development and validation of a new caged compound is a challenging process to ensure biological inertness, solubility in physiological pH, resistance to aqueous hydrolysis, fast uncaging speed, and high uncaging efficiency.[7] The caging of large molecules such as proteins can be extremely challenging. For intracellular uncaging, the caged compound needs to go through endocytosis or plasma membrane permeation.[9, 10] Furthermore, uncaging of molecules is limited to UV light or inefficient two-photon uncaging. These drawbacks of caged compounds have prompted scientists to develop light-addressable vehicles as a general platform for caging a wide range of biomolecules, especially for on-demand uncaging.[11–13]
The deep tissue penetration and reduced photo-damage of near-infrared light make it a particularly attractive option for biomolecule uncaging.[1, 14–16] There are two main mechanisms for near-infrared light-triggered uncaging, including photochemical and photothermal release. First, photochemical activated uncaging can occur with several different mechanisms including photo-oxidation, photocrosslinking, photoisomerization, and photocleavage.[17, 18] In particular, photo-oxidation involves incorporating a photosensitizer molecule into vehicles, for example, porphyrin[19] and Chlorin e6.[20] Upon near-infrared light illumination, photosensitizer molecules produce singlet oxygen to oxidize vehicle structure and thus uncage the packaged biomolecules, or the payload. Among different vehicles, photosensitizer-modified liposome is one of the most widely used vehicles for photochemically triggered uncaging.[21] For instance, Kohane and co-workers synthesized a new photosensitizer and incorporated into liposomes, enabled light-triggered lipid oxidation and tetrodotoxin uncaging to block the sciatic nerve.[22] The technique of photochemical internalization uses a similar strategy by allowing cell endocytosis of photosensitizer and drug molecules and then endocytic vesicle rupture upon light activation.[23] While leading to effective uncaging, the use of singlet oxygen can be toxic to cells and even elicit a cellular stress response.[24] Second, the photo-thermal effect utilizes an energy absorber to convert light energy into heat.[25–27] The accumulated heat causes either transient nanopores in vehicle structure or irreversible rupture of the membrane to uncage the payload.[28] Recently, Tortiglione and co-workers developed a gold nanoparticle containing microcapsule and demonstrated that near-infrared light can control the Wnt/β-catenin signaling pathway in Hydra via photothermal uncaging of alkaline phosphatase.[29] Efficient photo-thermal mediated uncaging requires continuous light irradiation and takes minutes or even hours. [30, 31] In addition to the slow uncaging, heat-induced damage to proteins remains another major limitation. As a result, there is a scientific need to develop new methods that can uncage a wide range of bioactive molecules with a rapid speed and high efficiency upon near-infrared light stimulation.
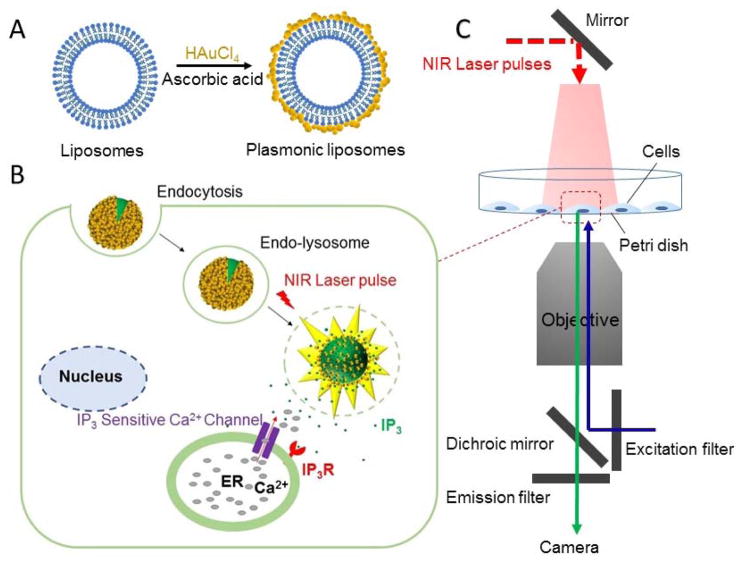
Recently, it has been shown that ultrashort laser pulses activate plasmonic nanoparticles to generate nanoscale cavitation bubbles that are effective to burst release the encapsulated compounds.[32] This is one of the fastest methods to uncage a broad range of molecules and represents an exciting opportunity to probe cell signaling events by accelerating payload uncaging from minutes to sub-milliseconds. This ultrafast speed gives the capability to cross a critical biological threshold to study fast cell signaling processes such as neurotransmission or calcium signaling.[33] In this report, we investigate the use of this nanoscale cavitation phenomena as a new uncaging technique to remotely stimulate intracellular signaling. Specifically, bioactive molecules are packed into plasmonic gold nanoparticles-coated liposomes, or plasmonic liposomes, following a recently reported procedure.[34] The nanobubble cavitation generates mechanical forces to eject payloads out of the liposomes and furthermore, for endocytosed plasmonic liposomes, overcoming the endo-lysosomal barrier (Figure 1). Here we first characterized the ultrafast uncaging technique with a self-quenching fluorescent dye, calcein, by imaging the ultrafast uncaging in a single giant liposome and within cells. We then demonstrated the capability to activate cell signaling by uncaging inositol 1,4,5-trisphosphate(IP3), a second messenger for calcium (Ca2+) signaling with single laser pulse exposure. These results suggest that the near-infrared laser pulse and nanobubble-triggered ultrafast biomolecule uncaging is a promising technique to locally introduce biomolecules into the cytosol and study cell signaling.
Figure 1. Schematic of the ultrafast near-infrared light-triggered biomolecule uncaging technique.
(A) Formation of plasmonic liposomes; (B) Concept of the near-infrared light triggered intracellular uncaging to probe cell signaling; (C) Schematic of the experimental setup.
2. Results and discussion
2.1 Preparation and characterization of plasmonic liposomes
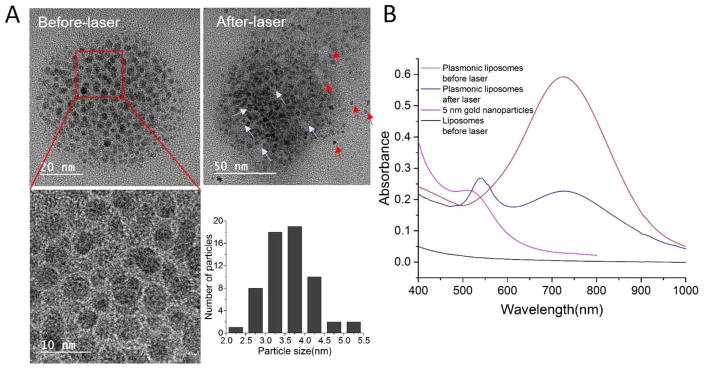
Near-infrared light responsive plasmonic liposomes was developed by deposition of gold nanoparticles onto the surface of liposomes via reduction of chloroauric acid (HAuCl4) following a previously reported method.[34] Upon gold nanoparticle coating the liposome size increased by 10–23 nm as determined by dynamic light scattering measurements (Table 1). The deposition of gold nanoparticles on the liposome surface was confirmed using transmission electron microscopy (TEM). As shown in Figure 2A, gold nanoparticles in the range of 2.1–5.3 nm formed discrete gold clusters surrounding the liposome core. The nanoparticles distributed on the liposome surface were confirmed to be gold particles by energy dispersive X-ray spectroscopy (EDS) analysis (Figure S1). The plasmonic coupling between gold nanoparticles leads to a near-infrared absorption at around 750 nm for 100 nm liposome core, while non-coated liposomes did not show resonant peak in the near-infrared wavelengths (Figure 2B). Upon near-infrared laser pulse irradiation, a new absorption peak appeared around 530 nm and suggests the dissociation of gold nanoparticles from the liposome surface. TEM imaging of irradiated plasmonic liposomes also confirmed the free gold nanoparticles and areas on the liposome surface where gold nanoparticles have fallen off (labeled as red and white arrows, respectively). The gold nanoparticle deposition does not appear to compromise colloidal stability of plasmonic liposomes over time. Plasmonic liposomes stored at 4°C showed stable diameter and polydispersity index (PDI) over three weeks (Figure S2), consistent with previous reports.[34]
Table 1.
Hydrodynamic size of different uncoated and gold coated plasmonic liposomes
| Formulations | Size (nm) | Polydispersity index |
|---|---|---|
| Blank liposomes | 114.1 ± 7.1 | 0.037 ± 0.08 |
| Blank plasmonic liposomes | 123.9 ± 9.3 | 0.138 ± 0.017 |
| Calcein liposomes | 118.2 ± 5.2 | 0.049 ± 0.014 |
| Calcein plasmonic liposomes | 136.5 ± 7.3 | 0.128 ± 0.044 |
| IP3 liposomes | 105.6 ± 5.1 | 0.065 ± 0.013 |
| IP3 plasmonic liposome | 128.6 ± 7.8 | 0.150 ± 0.033 |
Figure 2. Characterization of plasmonic liposomes.
(A) TEM image of plasmonic liposomes before and after near-infrared laser irradiation; (B) UV-Vis spectra for plasmonic liposomes before and after laser irradiation (750 nm, 60 mJ/cm2), individual 5 nm gold nanoparticles and uncoated liposomes.
2.2 Characterization of ultrafast uncaging
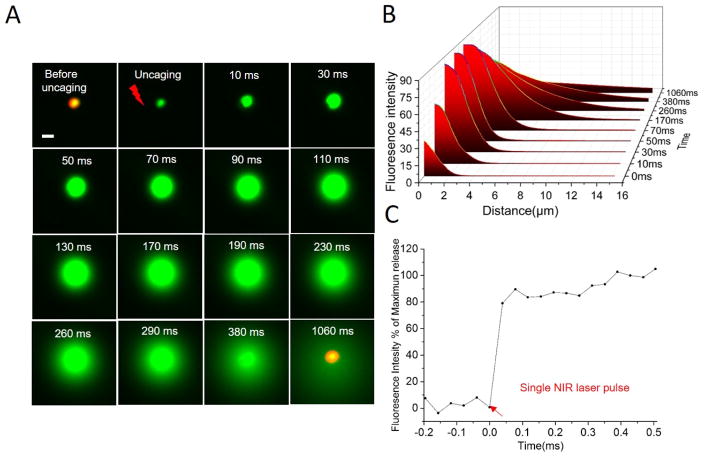
We then characterized ultrafast uncaging behavior by imaging real-time fluorescent dye uncaging from plasmonic liposomes. Calcein was encapsulated within plasmonic liposomes at 50 mM, a concentration at which its fluorescence is self-quenched (Figure S3).[35] To visualize calcein uncaging by optical microscopy, large liposomes around 4 μm diameter were used. From real-time imaging by a high-speed camera, plasmonic liposomes immediately uncage calcein upon single picosecond near-infrared laser pulse irradiation, acting like near-infrared light activated “fireworks” (Figure 3 and Video S1). Before laser irradiation, plasmonic liposomes show relatively weak fluorescence due to the self-quenching of calcein at high concentrations inside liposomes. Uncaging of calcein from plasmonic liposomes and its dilution by the surrounding medium results in a significant increase in the fluorescence intensity. Detailed image analysis shows a two-phase behavior (Figure 3B). First, the fluorescent intensity rapidly increases both within and beyond plasmonic liposomes predominately due to the dilution and thus de-quenching of calcein. The fluorescence intensity inside plasmonic liposomes reaches the maximum at around 70 ms. Afterwards, the fluorescent intensity reduces due to further dilution of calcein by the surrounding medium and eventually diminishes. Meanwhile, the phospholipid bilayer of liposomes remained in the same location without structure rupture. Importantly, liposomes without gold nanoparticle coating did not show calcein uncaging under the same conditions (Figure S5), suggesting that the gold nanoparticle coating is required for the near-infrared light activation. We also investigated the uncaging kinetics of plasmonic liposomes with diameter around 100 nm and observed an ultrafast calcein uncaging speed within 0.1 ms (Figure 3C). We next turned to the use of plasmonic liposomes around 100 nm diameter to probe cell signaling, since liposomes of this size can be readily taken up by cell endocytosis.
Figure 3. Real-time fluorescent imaging and analysis of the ultrafast uncaging from plasmonic liposomes.
(A) Real-time fluorescence micrographs showing the uncaging of single plasmonic liposome upon irradiation with single picosecond pulse at 750 nm. Liposomes with relatively large diameters around 4 μm were used for the purpose of optical imaging; (B) Fluorescence intensity analysis of individual plasmonic liposome uncaging as a function of time and distance. (C) The uncaging kinetics of 136 nm plasmonic liposomes. Scale bar, 5 μm.
2.3 Intracellular ultrafast uncaging of calcein
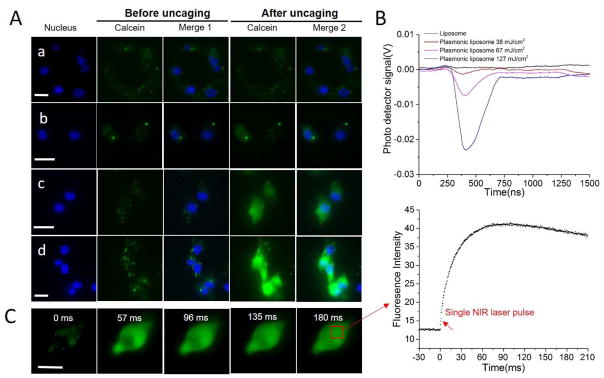
We tested the capability of near-infrared laser pulse to uncage calcein from plasmonic liposomes that were taken up by cells. MDA-MB 231 breast cancer cells were incubated with plasmonic liposomes in serum free DMEM/F12 medium for 2 hours to allow uptake. No calcein uncaging was observed in cells treated with non-coated liposomes with laser energy up to 127 mJ/cm2 (Figure 4A). However, for endocytosed plasmonic liposomes, near-infrared laser pulse with energy density as low as 32 mJ/cm2 was able to immediately uncage calcein inside MDA-MB 231 cells as indicated in the strong fluorescence intensity increase in cytosol and nucleus. Furthermore, the fluorescent signal increase and thus the amount of calcein uncaging shows a strong dependence on the laser energy level. The nanobubbles generated by irradiation of plasmonic liposomes inside cells at different energy levels were measured with an optical pump-probe technique. The optical trace showed that nanobubbles expand and collapse within 20–300 nanoseconds as a function of the laser pulse energy. Higher laser pulse energy leads to nanobubbles with longer lifetime and more efficient calcein uncaging (Figure 4B). No nanobubbles were detected in cells with non-coated liposomes, indicating the absence of calcein uncaging upon near-infrared pulse irradiation. The ultrashort lifetime of nanobubbles explained the ultrafast uncaging speed of plasmonic liposomes upon optical irradiation. To understand the intracellular uncaging kinetics, we then recorded and analyzed sequences of fluorescent microscopy images (Figure 4C). The results show that the intracellular fluorescent intensity immediately increased following near-infrared laser pulse exposure. The fluorescent intensity reached maximum at 74 ms and then decreased possibly due to quenching by the fluorescent excitation light (470 nm). In many cases, cell signaling events can occur on the millisecond time scale. The rate of uncaging of the biomolecules needs to be faster than the process being studied, especially when investigating signaling kinetics. For this reason, investigations of fast signaling events require techniques with an extremely high temporal resolution.[36] Our technique is able to uncage molecules in the sub-millisecond scale and thus provides a powerful tool to study cell signaling pathways regardless of its speed. Furthermore, no significant calcein entry into the cells was observed for cell membrane surface-bound plasmonic liposomes (Figure S6 and S7).
Figure 4. Intracellular calcein uncaging from plasmonic liposomes.
(A) Imaging of intracellular calcein uncaging from plasmonic liposomes upon single near-infrared pulse irradiation with different laser pulse energies, a) uncoated liposomes, 127 mJ/cm2; b) plasmonic liposomes, 32 mJ/cm2; c) plasmonic liposomes, 67 mJ/cm2; d) plasmonic liposomes, 127 mJ/cm2; (B) Nanobubble signal from plasmonic liposomes that has been taken up by cells treated with different pulse energies; (C) Kinetic sequence of intracellular calcein uncaging upon single pulse irradiation and the mean fluorescence intensity of the cytosol as a function of timeScale bar, 20 μm.
2.4 Intracellular distribution of plasmonic liposomes
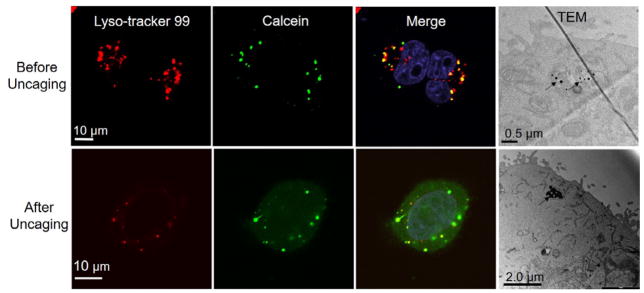
To understand the cellular uptake and intracellular distribution of plasmonic liposomes, confocal microscopy and TEM were used to image the intracellular plasmonic liposomes. For confocal imaging, late endosomes and lysosomes were labeled with LysoTracker Red DND-99 after incubation with plasmonic liposomes. The results show that, after 2 hours’ incubation, the green fluorescence from caged calcein was co-localized with LysoTracker Red DND-99 (Figure 5). Upon single near-infrared laser pulse irradiation, calcein was immediately released from liposomes and endo-lysosomes, followed by even distribution in the cytosol and nuclear compartments. TEM analysis also showed that plasmonic liposomes were trapped inside endo-lysosomes (labeled as black arrows). Interestingly after single laser pulse irradiation, plasmonic liposomes remain in endo-lysosomes. Thus both confocal and TEM imaging suggests the localization of plasmonic liposomes in endo-lysosomes and plasmonic liposomes are likely taken up by endocytosis.
Figure 5. Intracellular distribution of plasmonic liposomes.
Co-localization of calcein encapsulated plasmonic liposomes with endo-lysosomes before and after near-infrared laser pulse irradiation and TEM images of endocytosed plasmonic liposomes before and after single laser pulse activation (60 mJ/cm2).
2.5 Probing calcium signal by intracellular uncaging of IP3
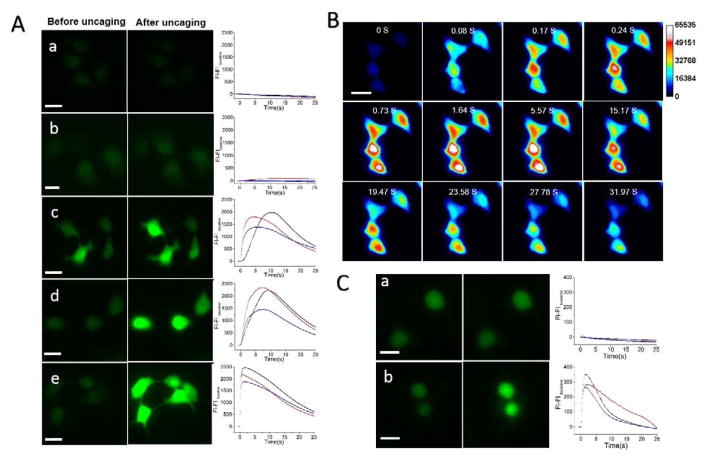
Finally, we demonstrated the capability to activate intracellular calcium signaling by uncaging IP3 using plasmonic liposomes. IP3 is a second messenger molecule that binds to IP3 receptors (IP3R) located on the endoplasmic reticulum membrane. The binding event then causes calcium (Ca2+) release from the endoplasmic reticulum into the cytosol.[37] Cells were incubated with plasmonic liposomes containing 730 μM IP3 [21]. Both MDA-MB-231 cancer cells and primary culture of dorsal root ganglia neurons were tested. For MDA-MB-231 cells, after 2 hours incubation to allow endocytosis, single near-infrared laser pulse led to a spontaneous increase in the Fluo-4 fluorescent signal (Figure 6A and Supplementary Video 3) in the laser pulse energy range 38–127 mJ/cm2. This is also evident by plotting the intracellular Fluo-4 fluorescence intensity with time and demonstrates a faster fluorescent intensity increase with the highest laser pulse energy (127 mJ/cm2). The fluorescence image sequence in Figure 6B shows rapid efflux of Ca2+ from internal stores into the cytosol and then propagation into the nucleus, consistent with previous reports.[38] The decrease of Fluo-4 intensity following the increase is probably due to membrane Ca2+ pumps that actively export Ca2+ from the cell. This is in agreement with previous reports showing that the sudden increase in Ca2+ concentration activates membrane calcium pump to transport Ca2+ out of the cell to maintain low cytosol Ca2+ level.[39] In control groups, no Fluo-4 fluorescence increase was observed for cells treated with non-coated liposomes, suggesting that IP3 was trapped inside liposomes and endo-lysosomes and thus unable to bind to the IP3R to trigger the calcium release. Further, we observed slight Fluo-4 intensity increases in cells that were treated with plasmonic liposome without IP3, however, the magnitude of the Fluo-4 intensity change is much smaller compared with plasmonic liposomes with IP3. Since it has been reported that endo-lysosomes are also intracellular Ca2+ stores,[40] the nanobubbles can eject Ca2+ out of endo-lysosomes into the cytosol, leading to the observed Fluo-4 intensity change. For primary culture of mouse dorsal root ganglia (DRG) neurons, cells were incubated with plasmonic liposomes for 3 hours to ensure endocytosis. Similar to MDA-MB-231 cells, single laser pulse irradiation significant increased the Fluo-4 fluorescence intensity in DRG neurons treated with plasmonic liposomes, suggesting successful uncaging of IP3. No significant change was observed for DRG neurons treated with non-coated liposomes. In summary, our experiments confirmed that near-infrared laser pulse uncages IP3 that was packaged in plasmonic liposomes to activate the intracellular Ca2+ signaling pathway with an ultrafast speed.
Figure 6. Probing calcium signal by the ultrafast uncaging of IP3 from plasmonic liposomes.
(A) Imaging of intracellular Ca2+ increase from intracellular IP3 uncaging in MDA-MB-231 cells and Ca2+ indicator (Fluo-4) fluorescence intensity as a function of time, all figures share the same x-and y- scales and legends; a) non-coated liposomes with IP3,127 mJ/cm2; b) plasmonic liposomes without IP3, 127 mJ/cm2; c) plasmonic liposomes with IP3, 38 mJ/cm2; d) plasmonic liposomes with IP3, 63 mJ/cm2; e) plasmonic liposomes with IP3, 127 mJ/cm2; (B) Fluorescence microscopy image sequence of Ca2+ signaling caused by intracellular IP3 uncaging in MDA-MB-231 cells.. (C) Imaging intracellular Ca2+ increase from intracellular IP3 uncaging in primary culture of DRG neurons, a) non-coated liposomes IP3,127 mJ/cm2; b) plasmonic liposomes with IP3, 127 mJ/cm2. Scale bar, 20 μm
Another important aspect of the intracellular uncaging technique is to minimize cell toxicity. We tested the acute toxicity to the cells using a live/dead viability assay. MDA-MB 231 cells were incubated with empty plasmonic liposomes under the same condition with the intracellular calcein and IP3 uncaging. Cells were stained with live-dead assay working solution immediately after laser exposure. The results showed that plasmonic liposomes and near-infrared laser pulse did not affect the cell viability until up to 191 mJ/cm2 (Figure S8), an energy level well above the threshold for calcein and IP3 uncaging (~30 mJ/cm2). Previous reports suggest that the formation of gas bubbles around gold nanoparticle clusters can be powerful in disrupting organic matrices[41] and the impact of photoactivated cargo release on the cell viability is highly dependent on the laser intensity.[27] The unique features of the nanobubbles including the nanoscale size and ultrashort lifetime (Figure 4B) make them less toxic to living cells when compared with large and long lasting bubbles. By tuning laser pulse energies, we were able to identify experimental conditions for intracellular uncaging without significant toxicity to cells.
3. Conclusions
In conclusion, we developed an ultrafast and highly controllable intracellular uncaging approach to probe cell signaling. Our approach combines plasmonic liposomes with near-infrared picosecond laser pulses to generate nanoscale cavitation bubbles to uncage the packed biomolecules within 0.1 milliseconds. The gold nanoparticle coating on the liposome surface allows efficient energy conversion from a single laser pulse to nanosecond cavitation events. We systematically characterized the rapid uncaging by using single giant liposomes, and then imaged the ultrafast uncaging of the fluorescent dye calcein from plasmonic liposomes inside cells with single near-infrared laser pulse treatment. Furthermore, we demonstrated the ultrafast intracellular IP3 uncaging to trigger the intracellular Ca2+ signaling pathway both in cancer cells and neurons. The ultrafast molecular uncaging technique enabled by nanoscale cavitation provides a general uncaging tool to probe cell signaling events that span a wide timescale using a broad range of bioactive molecules. While this work demonstrated the uncaging of small molecule dye and second messenger IP3, further work is needed to demonstrate the uncaging of large molecules such as proteins and their applications in probing cell signaling. We anticipate that our technique will help investigate and better understand cell signaling and facilitate the development of improved therapies and diagnostics.
4. Experimental Section
4.1 Materials
Dipalmitoylphosphatidylcholine (DPPC) and cholesterol were purchased from Avanti Polar Lipids, Inc. Dulbecco’s modified Eagle’s medium/F12 medium (DMEM/F12), trypsin-EDTA, Dulbecco’s phosphate buffered saline (DPBS), live/dead cell imaging kit (R37601), 1,1′-Dioctadecyl-3,3,3′,3′-tetramethylindocarbocyanine perchlorate (Dil), L-ascorbic acid, Hoechst 33342, Fluo-4 and LysoTracker Red DND-99 were purchased from Thermo Fisher Scientific. Calcein sodium salt was purchased from Alfa Aesar. Gold chloride was purchased from Sigma-Aldrich. IP3 was purchased from Caymen Chemical. All other chemicals were analytical grade. Adult ICR mice were purchased from Envigo. Animal protocols were approved by the Institutional Animal Care and Use Committee of University of Texas at Dallas.
4.2 Preparation and characterization of plasmonic liposomes
Liposomes were prepared from DPPC and cholesterol in a 4:1 molar ratio. Lipid powder was dispersed in chloroform and dried with N2 for several minutes, followed by overnight evaporation under vacuum. Dry lipid film was then dispersed in 10 mM phosphate buffered saline (PBS) containing either calcein (50 mM) or IP3 (730 μM) for 1 hour, and subsequently extruded through 200 and 100 nm polycarbonate membranes for 21 passages using Avanti Mini Extruder (Avanti Polar Lipids). Free calcein or IP3 was removed by size-exclusion chromatography with a Sephacryl S-1000 column. Gold nanoparticles were decorated onto the liposome surface following a previous reported method with minor modification.[34] Aqueous solutions of gold chloride (10 mM) and of ascorbic acid (40 mM) were prepared. Gold chloride solution was added and gently mixed with liposome suspension (1.5 mM lipid concentration) in a molar ratio of 1:4 until uniformly distributed, followed by the addition of the same volume of ascorbic acid solution. Following reduction, plasmonic liposomes samples was dialyzed against PBS (10 mM) overnight at 4°C to removed unreacted gold chloride and ascorbic acid. Plasmonic liposomes and uncoated liposomes were stored at 4°C until needed.
The sizes of plasmonic liposomes and uncoated liposomes were determined by dynamic light scattering measurement (Malvern ZetaSizer Nano ZS). Liposomes were diluted with PBS to 150 μM before measurement. Extinction spectrum of plasmonic liposomes and uncoated liposomes in PBS(150 μM) were obtained with a spectrophotometer (DU800, Beckman Coulter). Spectrum of naked 5 nm gold nanoparticles synthesized by Turkevich–Frens method was also measured as a control. The morphology of the plasmonic liposomes before and after laser irradiation was observed by a transmission electron microscope (TEM, JEM-2100F) at an accelerating voltage of 200 keV. A droplet of plasmonic liposomes at a lipid concentration of 100 μM was placed on a carbon support film, and the excess liquid was evaporated under room temperature for 1 hour before imaging. Size distribution of gold nanoparticles on the liposome surface from TEM images was analyzed in Image J.
4.3 Characterization of ultrafast uncaging
An aliquot of well-dispersed calcein-loaded plasmonic liposomes was placed on a glass slide, covered by cover slide and immobilized on an inverted microscope (Olympus IX73) stage. Plasmonic liposomes with diameter around 4 μm was used for imaging. The laser beam from a picosecond laser (PL2230 coupled with PG 400, Ekspla) was focused into a spot of around 100 μm diameter. Plasmonic liposomes were positioned at the center of focused laser beam, and irradiated with a single 28 ps laser pulse at 750 nm. Real-time fluorescent images were obtained with an inverted fluorescence microscope and a high speed digital camera (Hamamatsu Photonics, ORCA-Flash 4.0). The fluorescence intensity of plasmonic liposomes before and after laser irradiation was analyzed in Image J. The uncaging kinetics of 136 nm calcein encapsulated plasmonic liposomes was investigated following the similar procedure.
4.4 Intracellular ultrafast uncaging
To monitor intracellular uncaging of calcein from plasmonic liposomes, MDA-MB-231 cells were seeded and cultured in 25 mm glass bottom dishes (Biotek) in DMEM/F12 medium supplemented with 10% fetal bovine serum (FBS) for 24 hours. The cells were washed with PBS and replaced with fresh serum free DMEM/F12 medium that contains calcein loaded plasmonic liposomes (final lipid concentration 150 μM) or uncoated liposomes. After 2 hours’ incubation at 37°C in 5% CO2, cell nuclei were stained with 5 μg/mL Hoechst 33342 for 5 min. Cells were then washed with PBS 3 times, and supplied with fresh complete DMEM/F12 medium (with 10% FBS) prior to laser irradiation. Single laser pulse with different energy densities (32, 67, 127 mJ/cm2) was tested. The real-time fluorescence images were captured by a high speed digital camera. The plasmonic nanobubbles generated by irradiation of plasmonic liposomes inside cells at different energy levels were measured with an optical pump-probe technique. Plasmonic liposomes in the cells absorb the near-infrared excitation laser pulse (i.e., pump, 750 nm) and create nanobubbles which strongly scatters another continuous laser beam (i.e., probe, 633 nm), leading to a decrease in the transmitted laser intensity. The axial intensity of the beam was recorded with fast photodetector (FPD510-FV, Thorlabs) which is displayed by a digital oscilloscope (LeCroy WaveRunner204Xi-A) and analyzed as a time-response.
4.5 Intracellular distribution of plasmonic liposomes
To study the intracellular distribution of plasmonic liposomes, confocal microscope and TEM were used to image cells. MDA-MB 231 cells were incubated with calcein encapsulated plasmonic liposome in serum free DMEM/F12 medium for 2 hours. For confocal imaging, after washed with PBS 3 times and stained with nucleus dye (Hoechst 33342), late endosomes and lysosomes were stained with LysoTracker Red DND-99(250 nM, 30 mins) in complete DMEM/F12 medium after laser illumination. Cells was washed with PBS 3 times and supplied with complete cell medium and imaged using a Nikon A1R confocal microscope system (Nikon, Inc.). For TEM, MDA-MB 231 cells were fixed with 0.025% glutaraldehyde for 3 hours, dehydrated through a series of ethanol and propylene oxide solutions. After embedded in hard resin, cross-sections of 100 nm thick were obtained by a ultramicrotome. Samples were placed in TEM grid and then imaged by a JEOL 1200EX transmission microscope (JEOL USA, Inc).
4.6 Probing calcium signal by intracellular uncaging of IP3
To test the capability of intracellular uncaging by near infrared laser pulse irradiation of plasmonic liposomes, calcium signaling pathway in both breast cancer cells (MDA-MB-231) and primary DRG neurons were tested. Primary culture of DRG neurons were prepared following the reported method.[42] Neurons on day 5 (Figure S9) were used for the experiments. MDA-MB-231 cells and DRG neurons in glass bottom dishes were incubated with IP3 loaded plasmonic liposomes and uncoated liposomes in serum free cell medium for 2 hours. After incubation, plasmonic liposomes containing cell medium was discarded and washed with PBS. To observed changes in calcium concentration, cells were loaded with a calcium indicator Fluo-4 (1 μM in complete cell medium, 30 min), which has a 100-fold increase in the fluorescent intensity upon binding to Ca2+. After washed with PBS, cell medium was replaced with fresh complete medium with 10% FBS before laser pulse exposure. Single near-infrared pulse (750 nm) with different laser energy densities (38, 63, 127 mJ/cm2) was used to activate plasmonic liposomes. Non-coated liposomes with IP3 and plasmonic liposomes without IP3 were used as control. Real-time fluorescence image sequences of cells before and after laser activation were captured with fluorescence microscope and a high speed digital camera. The increase in the fluorescence intensity of Fluo-4 (FI-FI baseline) as a function of time was analyzed by HCImage software (Hamamatsu).
Supplementary Material
Acknowledgments
This work was partially supported by UT Brain seed grant from The University of Texas System-−Neuroscience and Neurotechnology Research Institute (UTS-−NNRI, 362492) to ZQ, a NSF grant (1631910) to ZQ, a postdoc research grant from the Phospholipid Research Center Heidelberg, Germany to XL (1603574), and a NIH grant (NS065926) to TJP. We gratefully acknowledge the expert assistance of the UT Southwestern Electron Microscopy Core Facility.
References
- 1.Zhang YW, Huang L, Li ZJ, Ma GL, Zhou YB, Han G. ACS Nano. 2016;10:3881. doi: 10.1021/acsnano.6b02284. [DOI] [PMC free article] [PubMed] [Google Scholar]
- 2.Berridge MJ. Physiol Rev. 2016;96:1261. doi: 10.1152/physrev.00006.2016. [DOI] [PubMed] [Google Scholar]
- 3.Orsinger GV, Williams JD, Romanowski M. ACS Nano. 2014;8:6151. doi: 10.1021/nn5015903. [DOI] [PMC free article] [PubMed] [Google Scholar]
- 4.Kohman RE, Cha SS, Man HY, Han X. Nano lett. 2016;16:2781. doi: 10.1021/acs.nanolett.6b00530. [DOI] [PMC free article] [PubMed] [Google Scholar]
- 5.He L, Zhang YW, Ma GL, Tan P, Li ZJ, Zang SB, Wu X, Jing J, Fang SH, Zhou LJ, Wang YJ, Huang Y, Hogan PG, Han G, Zhou YB. Elife. 2015;4 doi: 10.7554/eLife.10024. [DOI] [PMC free article] [PubMed] [Google Scholar]
- 6.Palankar R, Skirtach AG, Kreft O, Bedard M, Garstka M, Gould K, Mohwald H, Sukhorukov GB, Winterhalter M, Springer S. Small. 2009;5:2168. doi: 10.1002/smll.200900809. [DOI] [PubMed] [Google Scholar]
- 7.Ellis-Davies GC. Nat Methods. 2007;4:619. doi: 10.1038/nmeth1072. [DOI] [PMC free article] [PubMed] [Google Scholar]
- 8.Walker JW, Somlyo AV, Goldman YE, Somlyo AP, Trentham DR. Nature. 1987;327:249. doi: 10.1038/327249a0. [DOI] [PubMed] [Google Scholar]
- 9.Mentel M, Laketa V, Subramanian D, Gillandt H, Schultz C. Angew Chem Int Edit. 2011;50:3811. doi: 10.1002/anie.201007796. [DOI] [PubMed] [Google Scholar]
- 10.Pavlovic I, Thakor DT, Vargas JR, McKinlay CJ, Hauke S, Anstaett P, Camuna RC, Bigler L, Gasser G, Schultz C, Wender PA, Jessen HJ. Nat Commun. 2016;7 doi: 10.1038/ncomms10622. [DOI] [PMC free article] [PubMed] [Google Scholar]
- 11.Nakanishi J, Nakayama H, Shimizu T, Ishida H, Kikuchi Y, Yamaguchi K, Horiike Y. J Am Chem Soc. 2009;131:3822. doi: 10.1021/ja809236a. [DOI] [PubMed] [Google Scholar]
- 12.Ott A, Yu X, Hartmann R, Rejman J, Schutz A, Ochs M, Parak WJ, Carregal-Romero S. Chem Mater. 2015;27:1929. [Google Scholar]
- 13.Ochs M, Carregal-Romero S, Rejman J, Braeckmans K, De Smedt SC, Parak WJ. Angew Chem Int Ed Engl. 2013;52:695. doi: 10.1002/anie.201206696. [DOI] [PubMed] [Google Scholar]
- 14.Li N, Yu ZZ, Pan W, Han YY, Zhang TT, Tang B. Adv Funct Mater. 2013;23:2255. [Google Scholar]
- 15.Yavuz MS, Cheng Y, Chen J, Cobley CM, Zhang Q, Rycenga M, Xie J, Kim C, Song KH, Schwartz AG, Wang LV, Xia Y. Nat Mater. 2009;8:935. doi: 10.1038/nmat2564. [DOI] [PMC free article] [PubMed] [Google Scholar]
- 16.Weissleder R. Nat biotechnol. 2001;19:316. doi: 10.1038/86684. [DOI] [PubMed] [Google Scholar]
- 17.Fomina N, Sankaranarayanan J, Almutairi A. Adv Drug Del Rev. 2012;64:1005. doi: 10.1016/j.addr.2012.02.006. [DOI] [PMC free article] [PubMed] [Google Scholar]
- 18.Miranda Dyego, Lovell JF. Bioeng Transl Med. 2016;10 doi: 10.1002/btm2.10032. [DOI] [PMC free article] [PubMed] [Google Scholar]
- 19.Carter KA, Shao S, Hoopes MI, Luo D, Ahsan B, Grigoryants VM, Song WT, Huang HY, Zhang GJ, Pandey RK, Geng J, Pfeifer BA, Scholes CP, Ortega J, Karttunen M, Lovell JF. Nat Commun. 2014;5 doi: 10.1038/ncomms4546. [DOI] [PMC free article] [PubMed] [Google Scholar]
- 20.Wang C, Tao HQ, Cheng L, Liu Z. Biomaterials. 2011;32:6145. doi: 10.1016/j.biomaterials.2011.05.007. [DOI] [PubMed] [Google Scholar]
- 21.Gregersen KA, Hill ZB, Gadd JC, Fujimoto BS, Maly DJ, Chiu DT. ACS nano. 2010;4:7603. doi: 10.1021/nn102345f. [DOI] [PMC free article] [PubMed] [Google Scholar]
- 22.Rwei AY, Lee JJ, Zhan C, Liu Q, Ok MT, Shankarappa SA, Langer R, Kohane DS. Proc Natl Acad Sci. 2015;112:15719. doi: 10.1073/pnas.1518791112. [DOI] [PMC free article] [PubMed] [Google Scholar]
- 23.Berg K, Weyergang A, Prasmickaite L, Bonsted A, Hogset A, Strand MT, Wagner E, Selbo PK. Methods Cell Biol. 2010;635:133. doi: 10.1007/978-1-60761-697-9_10. [DOI] [PubMed] [Google Scholar]
- 24.Klotz LO, Kroncke KD, Sies H. Photoch Photobio Sci. 2003;2:88. doi: 10.1039/b210750c. [DOI] [PubMed] [Google Scholar]
- 25.Huang J, Jackson KS, Murphy CJ. Nano Lett. 2012;12:2982. doi: 10.1021/nl3007402. [DOI] [PubMed] [Google Scholar]
- 26.Wu G, Mikhailovsky A, Khant HA, Fu C, Chiu W, Zasadzinski JA. J Am Chem Soc. 2008;130:8175. doi: 10.1021/ja802656d. [DOI] [PMC free article] [PubMed] [Google Scholar]
- 27.Javier AM, del Pino P, Bedard MF, Ho D, Skirtach AG, Sukhorukov GB, Plank C, Parak WJ. Langmuir. 2008;24:12517. doi: 10.1021/la802448z. [DOI] [PubMed] [Google Scholar]
- 28.Palankar R, Pinchasik BE, Khlebtsov BN, Kolesnikova TA, Mohwald H, Winterhalter M, Skirtach AG. Nano Lett. 2014;14:4273. doi: 10.1021/nl500907k. [DOI] [PubMed] [Google Scholar]
- 29.Anbrosone A, Marchesano V, Carregal-Romero S, Intartaglia D, Parak WJ, Tortiglione C. ACS nano. 2016;10:4828. doi: 10.1021/acsnano.5b07817. [DOI] [PubMed] [Google Scholar]
- 30.Huschka R, Neumann O, Barhoumi A, Halas NJ. Nano Lett. 2010;10:4117. doi: 10.1021/nl102293b. [DOI] [PMC free article] [PubMed] [Google Scholar]
- 31.Levy ES, Morales DP, Garcia JV, Reich NO, Ford PC. Chem Commun. 2015;51:17692. doi: 10.1039/c5cc07989f. [DOI] [PubMed] [Google Scholar]
- 32.Lukianova-Hleb EY, Ren X, Sawant RR, Wu X, Torchilin VP, Lapotko DO. Nat Med. 2014;20:778. doi: 10.1038/nm.3484. [DOI] [PMC free article] [PubMed] [Google Scholar]
- 33.Sudhof TC. Neuron. 2013;80:675. doi: 10.1016/j.neuron.2013.10.022. [DOI] [PMC free article] [PubMed] [Google Scholar]
- 34.Leung SJ, Kachur XM, Bobnick MC, Romanowski M. Adv Funct Mater. 2011;21:1113. doi: 10.1002/adfm.201002373. [DOI] [PMC free article] [PubMed] [Google Scholar]
- 35.Hamann S, Kiilgaard JF, Litman T, Alvarez-Leefmans FJ, Winther BR, Zeuthen T. J Fluoresc. 2002;12:139. [Google Scholar]
- 36.Wieboldt R, Gee KR, Niu L, Ramesh D, Carpenter BK, Hess GP. Proc Natl Acad Sci. 1994;91:8752. doi: 10.1073/pnas.91.19.8752. [DOI] [PMC free article] [PubMed] [Google Scholar]
- 37.Berridge MJ, Bootman MD, Lipp P. Nature. 1998;395:645. doi: 10.1038/27094. [DOI] [PubMed] [Google Scholar]
- 38.Hardingham GE, Arnold FJL, Bading H. Nat Neurosci. 2001;4:261. doi: 10.1038/85109. [DOI] [PubMed] [Google Scholar]
- 39.Caride AJ, Filoteo AG, Penheiter AR, Paszty K, Enyedi A, Penniston JT. Cell Calcium. 2001;30:49. doi: 10.1054/ceca.2001.0212. [DOI] [PubMed] [Google Scholar]
- 40.Hoglinger D, Haberkant P, Aguilera-Romero A, Riezman H, Porter FD, Platt FM, Galione A, Schultz C. Elife. 2015;4 doi: 10.7554/eLife.10616. [DOI] [PMC free article] [PubMed] [Google Scholar]
- 41.Huhn D, Govorov A, Gil PR, Parak WJ. Adv Funct Mater. 2012;22:294. [Google Scholar]
- 42.Mejia GL, Asiedu MN, Hitoshi Y, Dussor G, Price TJ. Pain Rep. 2016;1 doi: 10.1097/PR9.0000000000000562. [DOI] [PMC free article] [PubMed] [Google Scholar]
Associated Data
This section collects any data citations, data availability statements, or supplementary materials included in this article.


