Abstract
Migration mis-regulation is a hallmark of cancer, and remains an important problem in cancer biology. We postulate the need for better in vitro models to understand the details of cell–matrix interactions. Here, we utilized multiphoton excited (MPE) photochemistry to fabricate models to systematically study migration dynamics operative in breast and ovarian cancer. Gradients are a convenient means to modulate concentration and also have been implicated in metastases. We specifically pattern sub-micron structured gradients from laminin and fibronectin whose up-regulation is associated with increased metastasis and poor prognosis. We developed a new continuous linear bi-directional gradient design, permitting exploration of the underlying cell–matrix interactions of migration, including speed, directness, and f-actin cytoskeleton alignment as a function of concentration. These new models provide both contact guidance and ECM binding cues, and provide a more relevant environment than possible with existing technologies such as flow chambers or 2D printed surfaces. We found an overall increase in these processes with increasing concentration on both laminin and fibronectin gradients for a series of ovarian and breast cancer lines. Moreover, directness was higher for more metastatic cells, indicating that epithelial or mesenchymal state of the cell type governs the dynamics. However, the specifics of the speed and directedness depend on both the cell type and protein, thus we found that we must consider these processes collectively to obtain a self-consistent picture of the migration. For this purpose, we performed a linear discriminate analysis (LDA) and successfully classified the different cell types on the two protein gradients without molecular biology analysis. The bi-gradient structures are versatile tools to performing detailed studies of cell migration, specifically haptotxis. We further suggest the can be used in assessing efficacy of drug treatments targeted at specific matrix components.
Keywords: Gradients, Migration, Ovarian cancer, Breast cancer, Fabrication, Haptotaxis
Introduction
Combined, ovarian and breast cancers will contribute to over 55,000 deaths this year in the US.26 In addition to the genetic alterations, structural and compositional changes in the tumor microenvironment (TME) play a significant role in disease initiation and progression. For example, the dynamic interplay between cancer cells and the extracellular matrix (ECM) composition influences differentiation, promotes proliferation and enhances migration.41 This is important as these events are highly regulated in normal tissues and become highly mis-regulated in cancer. It is thus important to understand the details of the operative cell-ECM interactions that promote cancer growth, as this may provide both new imaging and therapeutic targets.
The ECM is comprised of the basal lamina, a thin membrane comprised primarily of collagen IV and laminin (LN), onto which normal and cancer epithelial cells adhere, and the underlying stroma, comprised primarily of collagen and stromal fibroblasts. The stroma also contains fibronectin (FN) which is up-regulated in both ovarian and breast cancer and can be concentrated near the basal lamina, where it is assembled into fibrils. This is associated with poor prognosis. Given the rich source of these adhesion molecules, the basal lamina is the first site of tumor/host contact and the “breach of barrier” is a first sign of transformation and invasion.53 For example, Col IV and LN are initially down and up-regulated, respectively in ovarian tumors.51 These adhesion molecules and subsequent cell binding integrin expression levels influnece adhesion, growth/survival as well as invasive and metastatic characteristics via various intracellular signaling pathaways.3,11,22,33,39,49,54,56,58
Mis-regulation of migration is hallmark of cancer and it is critical to have a better understanding of the underlying adhesion/migration dynamics. It is now well documented that up-regulation of FN enhances migration and leads to proliferation.1,21,35,55,63 There is little known about the specific effects of LN on migration, however, it is thought that LN is initially downregulated as the basal lamina is breached during invasion but then becomes re-expressed later in disease. Thus, understanding how matrix protein concentration relates to function is important as the distribution of ECM binding sites determines both integrin expression ((density and composition) and cell polarity).7,19,46,59,62
Current fabrication techniques used to create migration models most commonly rely either upon microfluidic devices or microcontact printing as the means to immobilize proteins of a single concentration and are essentially 2D.20,30,48,61 While these models provide insight into the role of immobilized concentration gradients on cell migration and polarity, they are not highly biomimetic.4,23,24,50 For example, microcontact printing cannot reproduce the protein crosslinking found in the native ECM nor provide great flexibility in modulation of protein concentration.40 Additionally, such printed surfaces simultaneously provide both ECM cues and contact guidance. Boyden or flow chambers also have similar limitations as the thin membrane provides ECM binding cues with no topography.52
We aimed to develop a model platform to study aspects of migration dynamics, namely velocity, directionality and cytoskeletal alignment using one protein at a time. This permits hypothesis testing not possible in patients or readily in animal models. Here we use insoluble gradients of LN and FN as models, as haptotaxis is thought to be important in metastasis and additionally as a convenient means to smoothly modulate concentration. For this purpose we use multiphoton excited (MPE) photochemistry, where the photochemical process is analogous to the two-photon excited fluorescence microscopy (TPFE) where the excitation at the focal volume results in crosslinked proteins with 3D features of submicron resolution.6,14,31,37,42,47,57 We previously used the MPE technology approach to generate models consisting of LN “fibers”, i.e., linear structures of constant concentration with sub-micron height and width. Our studies suggested that topographical features in combination with protein concentration significantly influenced the migration dynamics of ovarian cell lines.25 Additionally, we showed that fibroblasts responded in a concentration dependent manner to crosslinked FN gradients.13
To better study the role of concentration on cell dynamics, here we implemented a new bi-directional design of LN and FN gradients and achieved a larger range in concentration. Importantly, the gradients are designed to have a maximum concentration in the middle of the structure, thus there is no sharp cutoff in concentration, i.e., a maximum at one end. Moreover, we improved upon a previous design where which was comprised of a mixture of discrete and contiguous regions in the gradient structures. The new designs are used here to study the migration dynamics (instantaneous velocity, directionality and cytoskeletal alignment) as a function of concentration for a series of normal and cancer cells (breast and ovarian). Using linear discriminate analysis of several migration and cell alignment metrics we found that the resulting dynamics were separable between the different respective cancer cell types and the two ECM components. Our primary purpose was to develop these gradients as versatile models and their use as a platform to pursue signaling studies and response to drug treatments.
Materials and Methods
Sample Preparation
Laminin (EMD Millipore CC095), Fibronectin (EMD Millipore FC010), BSA (Sigma Aldrich A2153) and Rose Bengal (RB) (Sigma Aldrich R3877) were used without further purification. The fabrication solutions consisted of LN and FN at 1 mg/mL, and BSA at 10 mg/mL all containing 2.5 mM Rose Bengal as the photoactivator. The devices were comprised of a silanized slide equipped with an adhesive silicone chamber (GraceBiolabs - SecureSeal) to contain the protein solution during fabrication and aid in manipulation of volumes during cell seeding protocols. A BSA monolayer was formed on the silanized surface one hour prior to fabrication.43 This serves as a nonspecific background whereas LN, FN, and BSA gradient structures are fabricated on top of this layer. Following the fabrication, the structures are washed with DI water, rinsed in 1X PBS and kept hydrated for cell seeding.
Fabrication System and Gradient Design
The ECM proteins were crosslinked into linear gradients and also onto the surface via MPE photochemistry. The optical setup and instrumentation software used for fabrication has been previously described.2,57 We recently developed a new scanning approach known as modulated raster scanning.2 This allows constant scanning (speed and step size) of the laser with rapid modulation of the pixel dwell time (MHz scale) to define the integrated laser exposure while maintaining constant laser peak power. This scheme results in constant absorption probability per exposure time, which is a linear process, and thus allows mapping of the laser exposure to the resulting crosslinked protein concentration. Specifically, a computer generated grey scale design is directly mapped to the desired concentration in the gradient.
The in vitro models of the basal lamina are comprised of either LN or FN or BSA (non-specific control), crosslinked into straight gradients with linearly modulated concentration. These fiber-like structures (here after referred as bi-gradient fibers), have lateral and axial dimensions of 0.7 and 2 μm, respectively, are 600 μm in length, and are separated by 10 μm to ensure that cells contact at least two fibers (based on 10–40 μm diameters of the cells). The length was chosen to be sufficient for cells to migrate over a period of two to three days. Along the gradient, the concentration of the crosslinked protein is linearly increased from the edges converging to a peak at the center of the pattern resulting in what we term a bi-gradient structure. The rationale for the design stems from the ability to generate smooth changes in protein concentration that is perhaps more reflective of the in vivo biology. The peak concentration at the center of the pattern affords examination of key dynamical features when cells face a decision process when reaching the apex.
Cell Culture and Time-Lapse Imaging
Four different ovarian cell lines of varying metastatic potential and characteristics were used in these experiments, where these were HEY1, SKOV3.ip1, OVCA433 and Immortalized Ovarian Surface Epithelium (IOSE) as the normal.9,27 These four cells were cultured at 37 °C and 5% CO2 in DMEM/F12 medium base (Life Technologies) supplemented with 10% FBS (Life Technologies). In addition, the breast cell lines were MDA-MB-231 and MCF-10A, representing highly metastatic and normal, respectively. MDA-MB-231 were cultured using DMEM (Life Technologies) medium base and 10% FBS, whereas MCF-10A medium included DMEM/F12 medium, 5% horse serum, EGF (20 ng/mL- EMD Millipore), hydrocortisone (0.5 µg/mL) and insulin (10 µg/mL) as specified.16 As previously reported, these cells will not grow for 2–3 days without serum.
Prior to cell seeding, the devices were sterilized by washing with 1X PBS containing 100 U/mL penicillin–streptomycin (Invitrogen). All the cell lines were seeded at density of 35 K cell/mL per device (or 55 cells/mm2) and incubated overnight to afford cell attachment prior to imaging. The following day, culture dishes containing fabricated structures and cells were flooded with their respective media supplemented with penicillin–streptomycin in advance of time-lapse imaging of migration.
Time lapse imaging was performed using an inverted Nikon Ti-Eclipse microscope equipped with an incubator system (Pathology Devices, Inc.—LiveCell™) for long term studies. Phase contrast images of each seeded fabricated pattern were collected using a 10 × 0.25 NA objective every 15 min over the 72 h observation period.
Migration Analysis
Cell tracking was performed with Imaris (v7.6.5—Bitplane AG) using the spot tracking tool. Migration patterns of individual cells on gradients were tracked over the 72 h observation period. The manual editing feature allows tracks to be split when cell division occurs during the tracking period. For each fabricated pattern, 20–30 cells were tracked for statistical significance, where this was performed for at least ten independent measurements. We limit the analysis to single cell migration and did not continue the analysis to time points for cells after collective migration was observed. This time varied across cell lines.
Immunofluorescence Staining
Ovarian and breast cells were grown on gradient structures between 16 and 24 h prior to staining. These cells were fixed in with 4% paraformaldahyde in PBS for 10 min. Following a three-step wash with 1X PBS, the cells were permeabilized with 0.2% Triton X-100 and treated with a 5% BSA blocking solution for 45 min. To stain for focal adhesions, the cells were incubated with an anti-vinculin primary antibody (at 1:200 dilution; EMD Millipore) overnight at 4 °C followed by incubation with a fluorescent secondary antibody, IgG Alexa488 (1:1000 dilution; Invitrogen), for 1 h at room temperature. In addition, the cells were stained for f-actin to visualize stress fibers using Texas Red conjugated phalloidin (Invitrogen).
Cells were treated with a DAPI/DABCO anti-fade solution to minimize photobleaching during fluorescent imaging. Fluorescent images of each respective channels were collected with a highly sensitive CCD camera (QImaging R2000R) using a 40X 0.8NA water immersion lens.
Statistical Analysis
The data extracted by Imaris from the tracked cells was processed with self-written code in MATLAB R2013a (Mathworks—Natick MA). The main features include calculations of cell position (with respect to fiduciary marker representing the center of the pattern) and instantaneous speeds, angles and direction of the migration projection. The analyzed data were segregated into 11 regions (approximately 55 µm long) along the entire length of the pattern to represent the migration of cells on different protein concentrations along the LN or FN gradients. In addition, the orientation of immunoflourescent images of actin stress fibers was analyzed using CurveAlign (Image J software).8 This software utilizes curvelet transform analysis to extract “fiber like” features in an image.
Origin14 (OriginLab) was used to perform two sample t tests on the means of migration, where a standard significance level of p < 0.05 was used for all the analysis. Additionally, directional statistics were performed on angles of the migration projections and f-actin distribution using Oriana (Kovach Computing Services) in conjunction with the Circular Statistics Toolbox (MATLAB central). Specifically, the von Mises–Fisher criterion was used to assess circular distribution of the angles associated with migration projection as well as the orientation of f-actin fibers.32 From the probability density function of the angle distribution.
parameters such as mean direction (µ) and concentration (κ) are quantifiable metrics extracted from the distribution. In the instance of the angle of migration projection, the relative value of κ represents the directedness of the migration by the cells. For all circular distributions, the pairwise Watson U 2 test was used to determine the statistical significance at 95% (or p < 0.05) confidence interval.
Lastly, metrics from the migration dynamics were used as inputs to a linear discriminate analysis (LDA) model to extract discriminate variables yielding maximum separation between groups. The canonical discriminate functions are comprised of migration speed, directedness, f-actin distribution and relative protein concentration. Variables such as the cell type and the substrate (LN or FN) were defined as groups in our model. All LDA modelling was performed using Stata14 (SataCorp LP) software.
Results
Characterization of Gradient Models
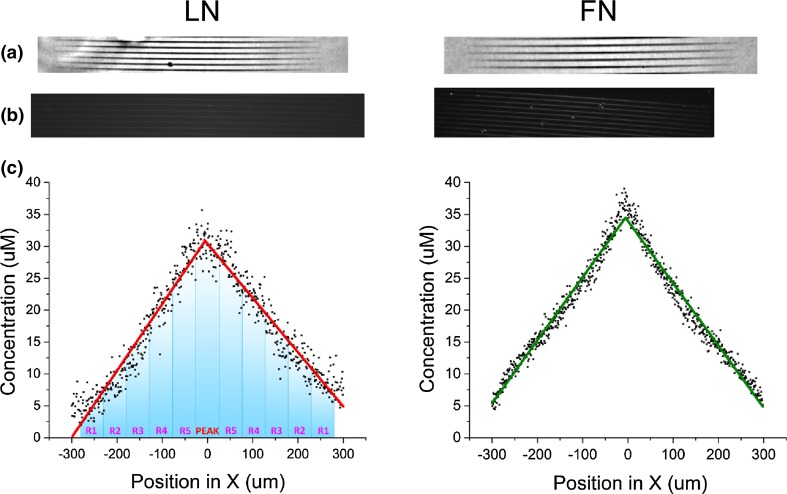
Laminin, fibronectin and BSA gradient fibers were fabricated via MPE with design parameters to maximize concentration at the apex of the bi-gradient pattern. The resulting morphological features are shown in Fig. 1 as phase contrast images of LN (left) and FN (right) gradient fibers, where darker regions correspond to higher concentration. Figure 1b shows immunostaining of the gradient structures using corresponding primary antibodies to demonstrate that binding sites on the crosslinked proteins are available post-fabrication and also as quantitative metrics of the resulting crosslinked protein concentration.
Figure 1.
Characterization of crosslinked LN (left) and FN (right) gradients. (a) images display the morphology of the crosslinked fibers under phase contrast, (b) shows immunofluorescence images, and (c) plots the resulting concentration of each protein over the 600 µm length of the gradient fibers. Concentration measurements were based on the respective immunostaining.
The bottom plots show the resulting protein concentration of LN and FN along 600 micron long fibers, where this was determined by immunofluorescence. Here this intensity was converted to concentration by comparison with corresponding labeled self-assembled monolayers of known concentration. The calculations were carried out by modeling protein adsorption to glass as monolayers of certain thickness.10 Then, we determined that the range of crosslinked concentration from the edge to the center of the fabricated pattern varied from 5 to 35 µM respectively for both LN and FN, or in terms of slope, 94.8 and 98.5 nM/µm respectively.
Crucial to our gradient design is that the geometrical features (width and height) of the fiber remain constant as we vary the total exposure dose and protein concentration across the fiber. We note that due to use of constant laser power (i.e., constant absorption probability), the dimensions of the gradients are indeed independent of concentration,12,13 where we have verified this through higher resolution optical imaging.13
Migration Dynamics
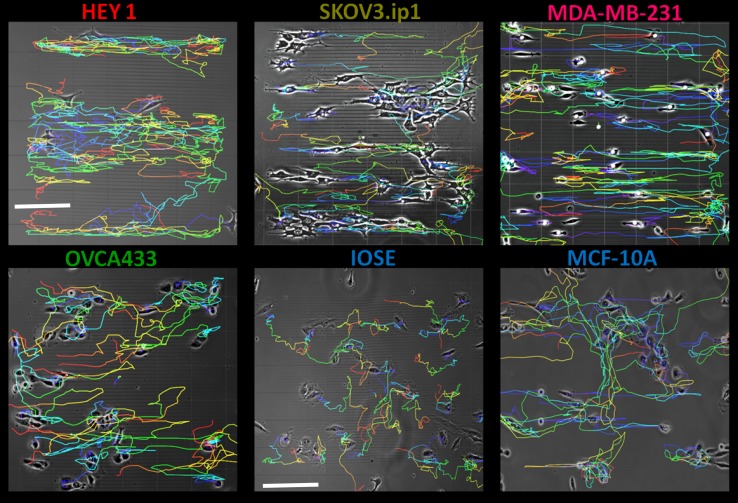
The migration of ovarian and breast cell lines was studied by tracking individual cells on the fabricated patterns over 72 h. Figure 2 is a panel of representative migration trajectories overlaid on the pattern. Initially evident is the directed response of the migratory patterns for the ovarian (HEY1, SKOV3, OVCA433) and breast (MDA-MB-231) cancer cells to the crosslinked LN or FN gradients relative to the normal IOSE and MCF-10A cells. We next quantified the response using metrics of the migration dynamics of the cell lines to LN, FN, and the BSA control (contact guidance only).
Figure 2.
Migration trajectories of ovarian and breast cell lines on fabricated LN bi-gradient patterns. Temporally color coded tracks represent migration of cells over a period of 72 h. In all figures, the fabricated fiber orientation is horizontal (x-axis). The field of view in each image is approximately 600 × 600 µm (scale bar = 150 µm) and 1000 × 1000 µm (scale bar = 200 µm) for the cancer and normal cell lines, respectively.
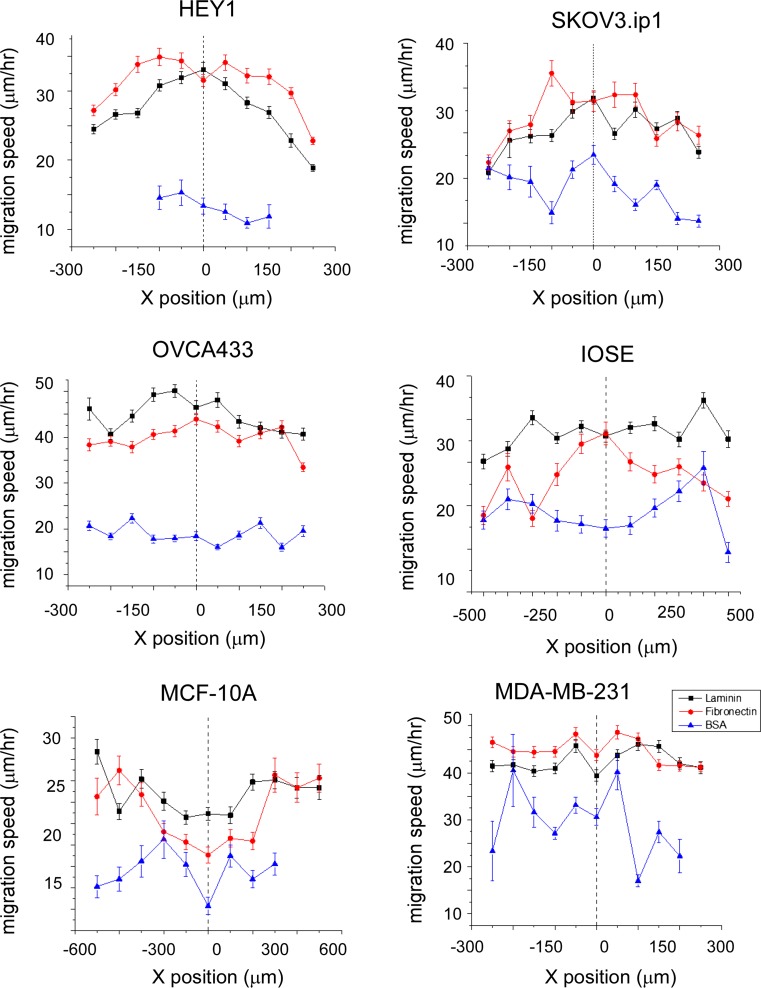
To determine the haptotactic response of the cells on the fiber gradients, we segregated the migration dynamics to 11 specific regions along the direction of changing protein concentration (x direction) equating to approximately 55 µm in length (see Fig. 1). In these regions, we measured the migration speed of individual cells and the corresponding projection angle relative to the axis of the fiber as a measure of migration directedness. Figure 3 shows the migration speed of all the cell lines on LN and FN fibers. The centerline at Position x = 0 µm corresponds to the peak concentration of the bi-gradient pattern (see Fig. 1). As a control, we determined migration speeds of cells on analogously fabricated BSA fiber gradients. These provide only contact guidance and no ECM cues. The experiments indicate very minimal to no modulation in migratory response across all the cell lines on the BSA fibers. The larger variation for MDA-MB-231 cells on BSA likely arises due to the randomness of the migration from a lack of ECM cues. These observations are consistent with our previous studies where we have shown that contact guidance is not the only operative factor in migration on these nanostructures.25
Figure 3.
Migration speeds of ovarian and breast cell lines on LN (black), FN (red) and BSA (blue) gradient fibers. Measured speeds represents cells tracked over 72 h. IOSE and MCF-10A cells are observed over topographies over 1200 µm in length.
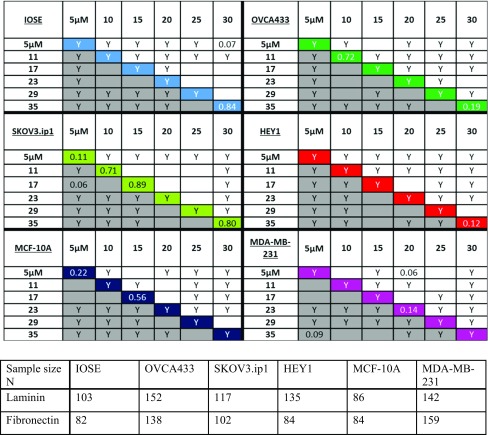
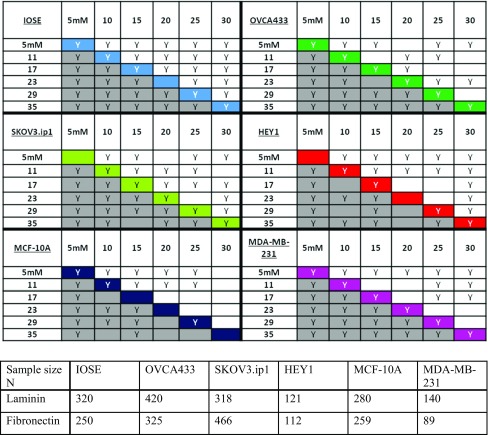
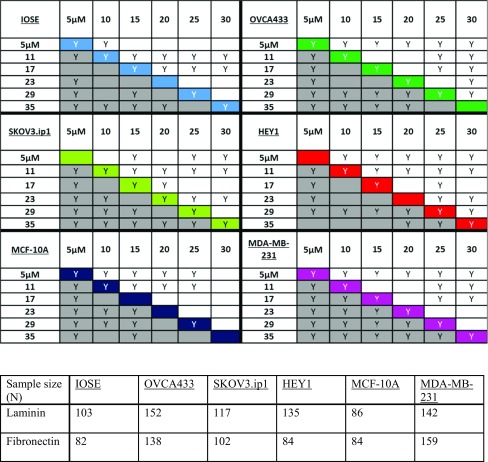
Our results indicate that highly metastatic HEY1 ovarian cancer cells overall display higher migration speeds on FN rather than LN fibers. However, on each, the speed increases with increasing concentration and eventually plateaus at center of the pattern i.e., the highest concentration. Also evident is the decrease in migration speeds at the highest concentration point on the LN and FN gradients. These local decreases are statistically different compared to the highest migration speed along the fiber gradient. Table 1 indicates all the statistical significances of the mean migration speeds using two-sample t-tests at a 95% confidence interval. The diagonal values in Table 1 also shows that when comparing HEY1 cells on LN vs. FN fibers at similar protein concentrations, most of the migration speeds are statistically different at lower ends of the fabrication gradients and only converge at the center of the pattern.
Table 1.
(top) Two sample t-tests on the migration speeds of all of the ovarian and breast cell lines. Migration speeds are compared at each segmented region of the pattern (Region 1—Peak) where 31 or 35 µM is the “PEAK” of the pattern for LN and FN respectively and 5 µM is the edge (Region 1). The letter “Y” indicates statistical significance at p < 0.05 and blank indicates no significant difference. The grey boxes represent cells on FN gradients and the top half represents cells on LN. The color coded diagonal compares migration speed of cells on FN vs. LN only at the relatively same segment of protein concentration. (bottom) Number of cells analyzed in each case.
In analogy with the HEY1 cells, we observed that the highly metastatic breast cancer cells, MDA-MB-231, displayed a propensity to migrate faster on FN structures but had a weaker dependence on the local concentration. These cells were still highly migratory (faster than HEY1 cells) but the only significant modulation in speed occurred towards the center of the pattern where there is a statistically significant decrease relative to the neighboring points on the gradient for both LN and FN structures (see Table 1). We also found that the migration speeds for MDA-MB-231 were statistically faster on FN than LN fiber gradients.
In contrast, we observe that non-metastatic cell lines such as IOSE and MCF-10A migrated faster on LN constructs. Also, IOSE and MCF-10A only show modulation in migration speeds towards the edges of LN fibers and eventually plateau towards the center of the patterns. This could be ascribed as saturation in the cell adhesion where higher protein concentration does not continue to significantly contribute to migration speed.
For the “moderately” metastatic cell lines SKOV3.ip1 and OVCA433 (defined based on their relative position on the epithelial to mesenchymal (EMT) spectrum),28 we found different behavior in migration speeds than the highly metastatic HEY1 and MDA-MB-231 cell lines. For example, for SKOV3.ip1 cells, the migration dynamics showed that these cells respond similarly to FN and LN cues in terms of speed modulation in response to concentration, where Table 1 shows that only a few points are statistically different between the proteins. In contrast the OVCA433 show the greatest modulation on LN vs. FN fibers. One notable difference is that during the 72 h observation period, the OVCA433 begin their migration patterns as single cells and within 4-6 h switch to a more collective migration. During this switch in the migration mechanism, both speed and persistence are highly modulated. We next utilize directional statistics of migration and cytoskeleton alignment as further metrics to understand the relative cell and protein contributions to the migration dynamics.
Migration Directedness and the Cytoskeleton Alignment
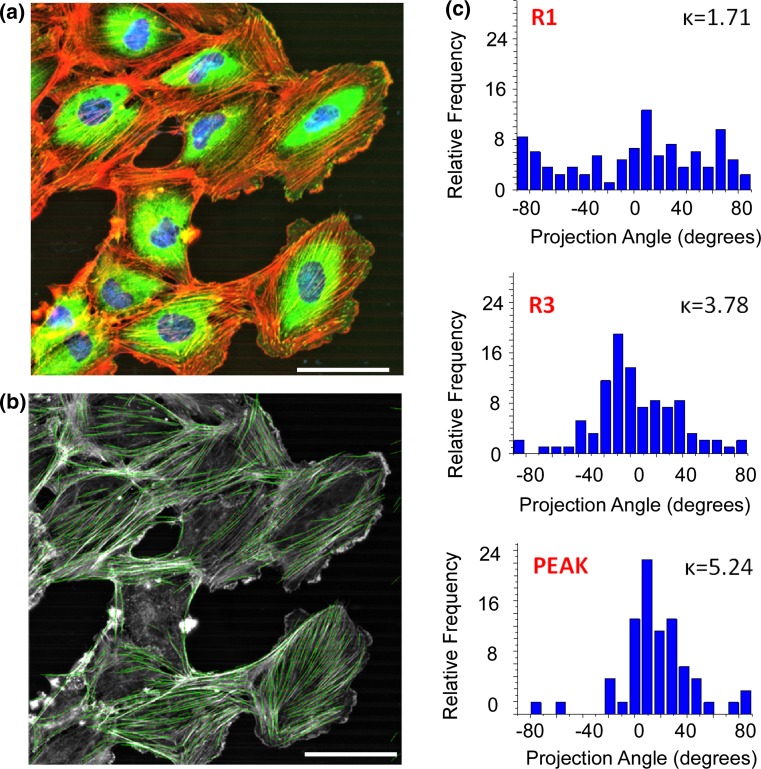
Figure 4 shows an example of an immunolabeled image of IOSE cells on LN fibers stained for f-actin and vinculin. Using curvelet analysis, we extracted the orientation of f-actin fibers (Fig. 4b) and plotted the angular distribution over three specific concentration regions (low, medium and peak) along the fabricated pattern (Fig. 4c). The angular distribution is represented by κ, the isolated metric from directional statistics under the modeling of the von Mises-Fisher criterion (see “Materials and Methods”). We do not report the mean resulting angle (µ) as it is essentially 0° in all cases (in direction of the fiber axis). We found an overall increase in alignment, i.e., narrower distribution of stress fibers at higher protein concentration for all the cells on both protein gradients. Table 2 summarizes the statistical evaluation of f-actin distribution with respect to protein concentration, where for simplicity, “Y” corresponds to p < 0.05.
Figure 4.
(a) F-actin (orange), focal adhesion (green) and nuclei (blue) staining of IOSE cells from the R3 region of the LN gradient fibers; (b) is the extraction of f-actin fibers from the same cells using CurvAlign. (c) Histograms of f-actin distribution along specific regions of the fibers with corresponding kappa value of the concentration of the angle distribution. Scale bar = 50 µm.
Table 2.
(Top) Watson U 2 Test for the f-actin distribution. The grey boxes represent cells on FN gradients and the top half represents cells on LN. The letter “Y” indicates statistical significance at p < 0.05 and blank indicates no significant difference. The color coded diagonal compares migration speed of cells on FN j. LN only at the relatively same segment of protein concentration. (bottom) Number of cells analyzed in each case.
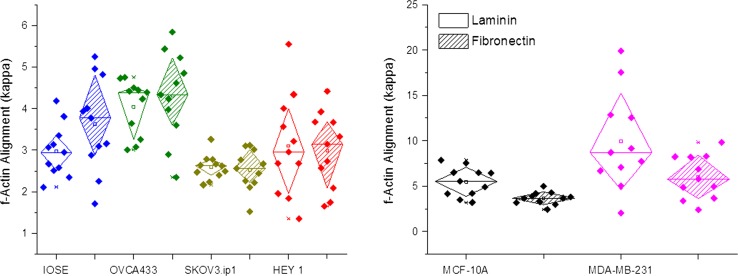
Our findings also indicate that there is a slight shift in cytoskeleton alignment in IOSE and OVCA433 cells with a preference towards FN gradients as shown in Fig. 5. With higher metastatic cell lines such as HEY1 and SKOV3.ip1, this preference in cytoskeleton alignment was not observed. However, our data shows that relative f-actin distribution is significantly different between cell lines and can be used as a discriminate variable (to be used below). When comparing breast cell lines, the cytoskeletal distribution was not significantly different between the proteins, however, the metastatic MDA-MB-231 cells had significantly larger alignment than the normal MCF-10A cells on both proteins.
Figure 5.
Distribution of relative f-actin alignment on LN and FN structures for ovarian (left) and breast (right) cancer cells. The diamond box indicates standard deviation for both ovarian (left) and breast cancer cell (right) lines.
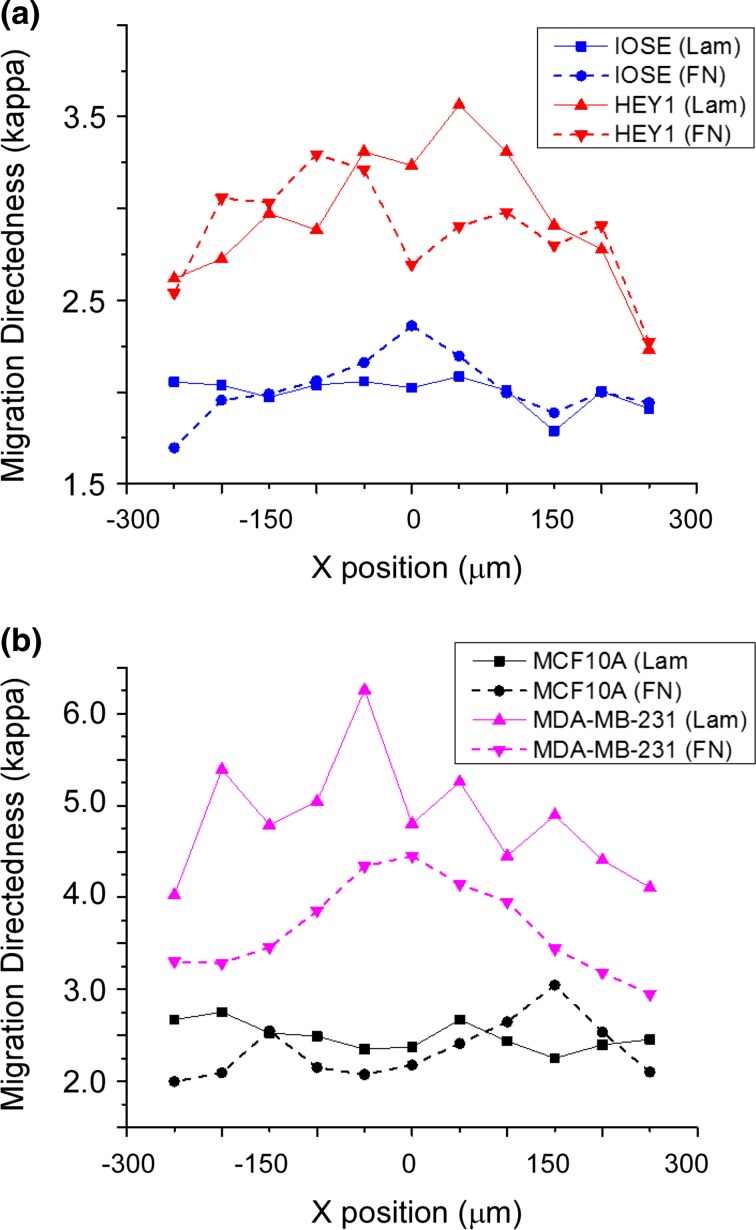
We used the same directional statistical methods to assess the angular distribution of the migration directedness for the ovarian (Fig. 6a) and breast cancer cells (Fig. 6b) on both FN and LN gradients. Here, this is defined as the angle of the position vector from one frame to the next with respect to the axis of the gradient fiber. We found that for both ovarian and breast cells, the resulting directedness is significantly higher for metastatic cell lines compared to their corresponding normal cells. Furthermore, metastatic cell lines overall showed higher directed migration on LN than FN fibers, where strong contrast is especially evident for the highly aggressive MDA-MB-231 cells. The normal cell lines on the other hand show slightly larger directedness on FN fibers. IOSE and MCF-10A cells have very little to no modulation across the varying crosslinked concentration on LN fibers. Table 3 summarizes the statistical evaluation of migration directedness with respect to protein concentration.
Figure 6.
Cell directedness of normal and highly metastatic ovarian (a) and breast (b) cancer cell lines. The modulation of directedness (kappa) is shown as a function of protein concentration.
Table 3.
(top) Two sample t tests on the migration speeds of all of the ovarian and breast cell lines. Migration speeds are compared at each segmented region of the pattern (Region 1—Peak) where 31 or 35 µM is the “PEAK” of the pattern for LN and FN, respectively, and 5 µM is the edge (Region 1). The letter “Y” indicates statistical significance at p < 0.05 and blank indicates no significant difference. The grey boxes represent cells on FN gradients and the top half represents cells on LN. The color coded diagonal compares migration speed of cells on the two gradients only at the relatively same segment of protein concentration. (bottom) Number of cells analyzed in each case.
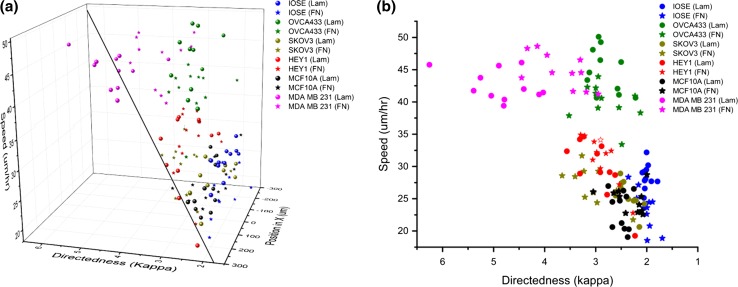
To further illustrate the haptotactic response of ovarian and breast cells on the models, we plotted the migration speed and directedness as a function of protein concentration as shown in Fig. 7. The general trends indicated that cells associated with higher metastatic potential respond to gradient patterns with higher migratory speeds and directedness (delineated by the blue sheet). For the individual ECM components, an increase in migration speeds towards the center of the pattern follows with an increase of directedness (as shown in Fig. 6). However, this trend does not follow when comparing same cell lines on the two protein gradients. The normal IOSE and MCF-10A cell lines show faster migration on LN yet slightly lower directness relative to FN. In contrast, HEY1 and MDA-MB-231 cells display higher migratory speeds on FN yet lower directedness compared to LN models. For SKOV3 cells, migratory speeds are relatively the same for both proteins yet the directness is higher for FN. In contrast, OVCA433 cells show an increase in migratory speeds for LN yet their directedness is the same for both proteins. In sum, these results show that both speed and directness need to be considered and further in the context of the interacting protein.
Figure 7.
Combined migration metrics of cell lines on LN and FN bi-gradients. (a) is a 3D plot of migration speed and directedness as a function of protein concentration for all the cell lines. The blue plane delineates the linear trend in directedness and migration speeds. (b) is a 2D side view displaying relation between cell speed and directedness as a function of cell type.
Linear Discriminate Analysis of Migration Dynamics
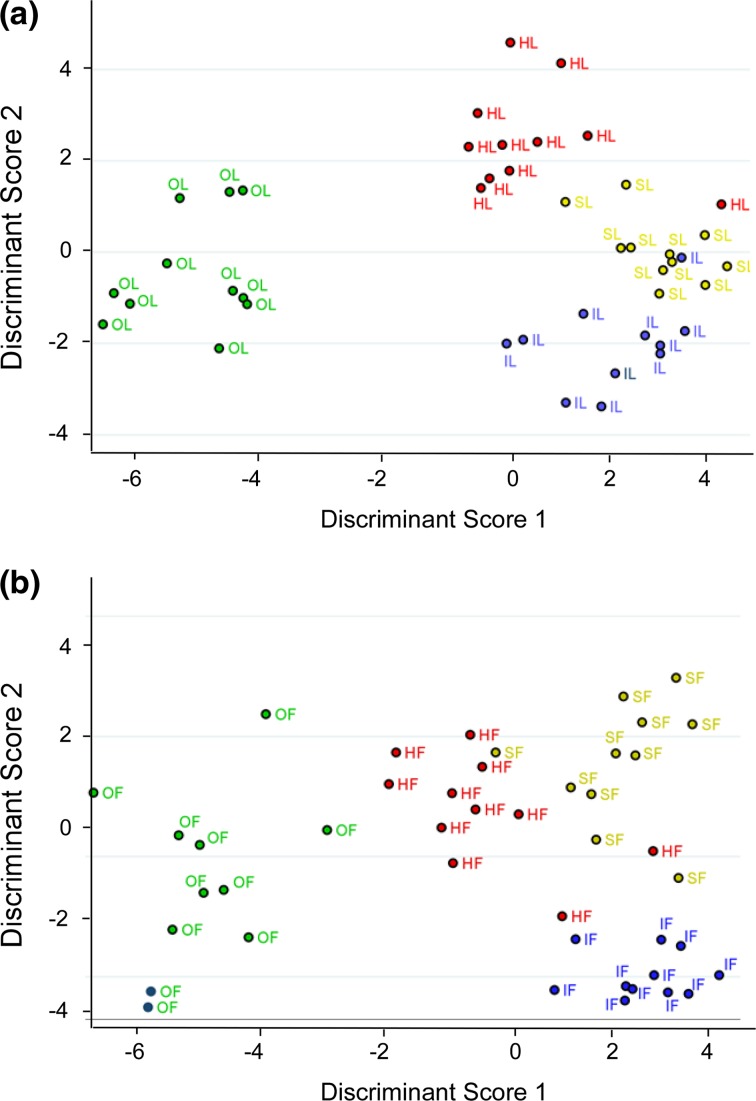
We found that the haptotactic migration dynamics depend on both the cell phenotype and the ECM proteins. To collectively quantify these combinations, we incorporated migration speed, directedness and cytoskeletal alignment of cells along LN and FN gradient fibers as metrics into a canonical LDA model. These metrics are reduced to two orthogonal functional scores used to discriminate the cell types. Figure 8 shows the LDA analysis and Table 4 shows the resulting classification scores for ovarian cells with respect to LN and FN. We first note that the LDA differentiates migration dynamics of all four ovarian cell types using both LN and FN gradient structures (see corresponding accuracy tables in Table 4). Our data indicates that LN fiber models yield larger sensitivity (all >90%) of distinguishing migratory patterns of different cell lines compared to FN models (80–100%). Furthermore, the resulting standardized canonical discriminant function coefficients indicate that the migration speed and directedness at specific protein concentration are the two predominant contributors to these resulting functional scores.
Figure 8.
Linear Discriminate analysis of ovarian cell lines on LN and FN models. Represented are HEY1 (red label), OVCA433 (green), SKOV3.ip1 (yellow) and IOSE (blue).
Table 4.
Classification accuracy of the linear discriminant for ovarian cancer cells on laminin (top) and fibronectin (bottom).
| Laminin | % Classified | ||||
|---|---|---|---|---|---|
| HEY1 | SKOV3.ip1 | OVCA433 | IOSE | ||
| True | HEY1 | 90.9 | 9.1 | 0 | 0 |
| SKOV3.ip1 | 9.1 | 90.9 | 0 | 0 | |
| OVCA433 | 0 | 0 | 100 | 0 | |
| IOSE | 0 | 9.1 | 0 | 90.9 | |
| Fibronectin | % Classified | ||||
|---|---|---|---|---|---|
| HEY1 | SKOV3.ip1 | OVCA433 | IOSE | ||
| True | HEY1 | 81.8 | 9.1 | 0 | 9.1 |
| SKOV3.ip1 | 9.1 | 81.8 | 0 | 9.1 | |
| OVCA433 | 0 | 0 | 100 | 0 | |
| IOSE | 0 | 0 | 0 | 100 | |
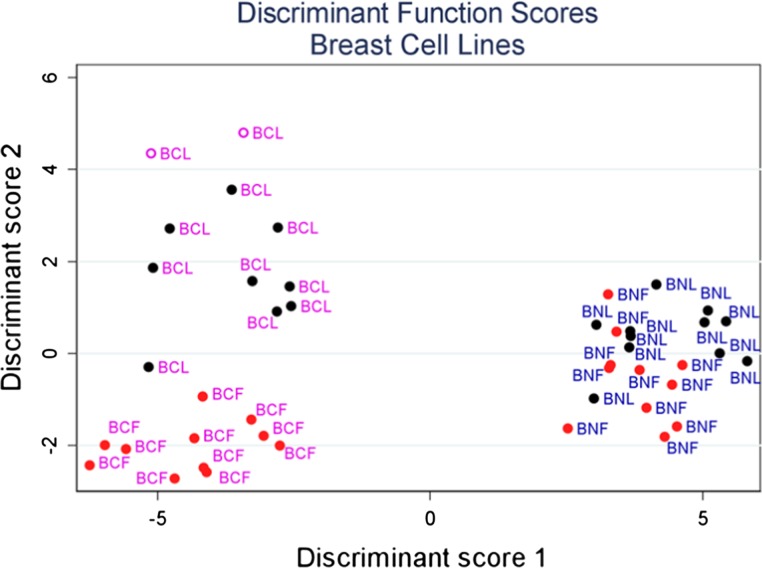
Similarly, the LDA also shows that we can use migratory dynamics to separate the normal and metastatic breast cancer cell lines, where the results and Table 5 are shown in Fig. 9. First, there is excellent discrimination between the normal and cancer lines as the classification accuracy is >90%. For example, classification accuracy between biological groups is typically considered excellent and clinically relevant for values >85%. Although LDA shows little discrimination between the response to LN and FN for the normal MCF-10 cells, highly metastatic MDA-MB-231 behave significantly different in terms of speed, migration directedness and f-actin distribution across varying protein concentration.
Table 5.
Classification accuracy of the linear discriminant for normal breast (BN) and breast cancer (BC) cells on laminin (L) and fibronectin (F).
| % Classified | |||||
|---|---|---|---|---|---|
| BCF | BCL | BNF | BNL | ||
| True | |||||
| BCF | 100 | 0 | 0 | 0 | |
| BCL | 9.1 | 90.9 | 0 | 0 | |
| BNF | 0 | 0 | 72.7 | 27.3 | |
| BNL | 0 | 0 | 18.2 | 81.8 | |
Figure 9.
Linear Discriminate analysis of breast cell lines on LN and FN models. Represented are MDA-MB-231(BCL and BCF) and MCF-10A (BNL and BNF).
Discussion
We utilized multiphoton excited photochemistry to fabricate bi- directional gradient models to study migration of ovarian and breast cancer cells. These constructs offer smooth transitions in immobilized cues at cell relevant size scales; an aspect that is quite difficult to achieve with other patterning techniques. We also find these models to be superior to our previous work by representing linearly modulated ECM components that lack sharp cut-off topographies.13 While these models do not have multiple components and do not recapitulate the native environment, they do allow us to systematically study migration of one protein at a time as a function of concentration. Importantly, the nanostructured gradients provide both contact guidance and ECM cues. While LN is not fibrillar, it is still important to provide topographic cues beyond flat printed surfaces to present a more biomimetic environment.45 For example, it was recently shown that breast cancer cells haptotaxed on FN but not LN printed surfaces.45 In strong contrast, we observed strong haptotaxis on both FN and LN gradients. This likely arises as the gradients present structural cues on the approximate size scale (500 nm) of focal adhesions. Thus, while the gradients do not replicate the in vivo lamellar basal lamina or underlying stroma, the models are a convenient approach to study details of migration where the concentration can be varied quickly while presenting some topographic cues. This affords better hypothesis testing than possible with more established methods including Boyden chambers or microcontact printed surfaces. It would have been interesting to also have used Col I gradients, as differential migration of epithelial cells on FN, LN and Col I has been previously described.15 However, Col I is not compatible with the photochemical approach used here due to pH considerations. We also excluded Col IV gradients from this study for the same reason.
In these models, all the cell lines display an elevation of migration speed, directedness and modification to the cytoskeleton alignment in response to an increase in ECM concentration. Specifically, we observe that migration dynamics are highly correlated with the type of ECM topographical cues represented. In the instance of HEY1, MDA-MB-231 and OVCA433 cells, we also observed a biphasic response in migration speed as these cells approach higher protein concentration with a plateau of speed at the peak of the pattern. Given the geometry where the spacing of the LN and FN gradient fibers is chosen to be 10 um (or less than half the cell size), we believe saturation of the focal adhesion sites for the specific ligand (i.e., LN or FN) at the peak of the pattern induces either cell spreading or modulation of the cell polarity.
When comparing effects of single ECM component, our results indicate that highly metastatic cells, HEY1 and MDA-MB-231 preferentially migrate faster on FN yet show higher directedness on LN gradient fibers. Higher migratory speeds on FN suggest a higher turnover rate in adhesion complexes and resulting lower cell polarity and lower directedness in migration.29 Consistent with significant number of studies,1,17,36,63 these findings collectively suggest that FN may play a crucial role in the initial attachment of cancer cells and dissemination. However, markers of increased invasive characteristics are attributed to increases in LN expression (via Ras-MAPK, Erk and Akt pathways) with implications of proteolysis, which may be a later step in the invasion/metastasis process.5,18,34,60 Consistent with this suggestion, the non-metastatic cells (IOSE and MCF-10A) show higher migratory speeds on LN fibers yet slightly elevated directedness and larger modulation of migratory speeds on the FN constructs. Cell migration on LN has not been as well-studied, but detailed analysis could be carried out on these gradients.
With the fabricated LN and FN models, we also show that increase in migration speed and directedness directly correlates with metastatic potential in both ovarian and breast cancer cells. Furthermore, our models elucidate migratory behavior of cells that fall in the middle of the spectrum of metastatic behavior with mixed epithelial (OVCA433) and mesenchymal (SKOV3.ip1) characteristics.28 SKOV3.ip1 cells display relatively medium migratory speeds (compared to HEY1 and MDA-MB-231) yet show higher preferential directedness on FN rather than LN, i.e., their behavior is dominated by directedness in migration rather than speed. Similarly, the more epithelial like OVCA433 cells overall display significantly larger migratory speeds compared to HEY1 cells, where the latter has undergone significant epithelial-mesenchymal transition (EMT).38,44 Their preference for higher migratory speeds on the LN gradient is an indication of their epithelial behavior. These results reinforce a crucial concept in cancer biology that EMT is a significant step in cancer invasion and metastasis. Our results are consistent with a hypothesis of cancer evolution that mis-regulation of migration precedes an up-regulation of intercellular pathways towards increased directedness and subsequent invasion.
In sum, all the aspects of migration need to be considered, i.e., concentration of the gradient, speed, directedness, actin cytoskeleton alignment as well as the metastatic potential of the cells. This suggested the use of the LDA for analysis, where using this approach we found high classification accuracy between the different cell types and between LN and FN gradients. Cross-validation analysis along with incorporating other cell lines such as MCF-7 (human breast adenocarcinoma cell lines), OVCAR4 and Kuramochi (ovarian cancer cell lines) can be used in future experiments to better assess the predictive value of this model.
Conclusions
The LN and FN bi-gradient fibers are used to identify migration in normal and malignant ovarian and breast cells. We showed that metrics such as speed and directness need to be considered when interrogating cells on the different ECM proteins, as each alone is not sufficient. The resulting behaviors that we observed were consistent with whether the cells had undergone an EMT transition, i.e., were more epithelial or mesenchymal in nature. By incorporating metrics such as migration speed, directedness and cytoskeletal alignment, we discriminated all cell types without relying on complex molecular biological tools. Furthermore, given the high fidelity and reproducibility of these gradient fiber based models, we foresee applications as diagnostics platforms and toxicology experiments in assessing efficacy of drug treatments targeted at specific ECM components.
Acknowledgments
PJC gratefully acknowledges support under a University of Wisconsin Vilas Award, the Rivkin Foundation, and NSF CBET – 1445650 and NIH NCI CA206561-01. We thank Prof. Patricia Keely and Prof. Molly Brewer for technical discussions.
Conflict of interest
Visar Ajeti, Jorge Lara-Santiago, Samuel Alkmin, and Paul J. Campagnola declare no conflicts of interest.
Ethical standards
No human studies were carried out by the authors for this article. No animal studies were carried out by the authors for this article.
References
- 1.Ahmed N, Riley C, Rice G, Quinn M. Role of integrin receptors for fibronectin, collagen and laminin in the regulation of ovarian carcinoma functions in response to a matrix microenvironment. Clin. Exp. Metastasis. 2005;22:391–402. doi: 10.1007/s10585-005-1262-y. [DOI] [PubMed] [Google Scholar]
- 2.Ajeti V, Lien CH, Chen SJ, Su PJ, Squirrell JM, Molinarolo KH, Lyons GE, Eliceiri KW, Ogle BM, Campagnola PJ. Image-inspired 3D multiphoton excited fabrication of extracellular matrix structures by modulated raster scanning. Opt. Express. 2013;21:25346–25355. doi: 10.1364/OE.21.025346. [DOI] [PubMed] [Google Scholar]
- 3.Alexander S, Friedl P. Cancer invasion and resistance: interconnected processes of disease progression and therapy failure. Trends Mol. Med. 2012;18:13–26. doi: 10.1016/j.molmed.2011.11.003. [DOI] [PubMed] [Google Scholar]
- 4.Arnold M, Hirschfeld-Warneken VC, Lohmüller T, Heil P, Blümmel J, Cavalcanti-Adam EA, López-García M, Walther P, Kessler H, Geiger B, Spatz JP. Induction of cell polarization and migration by a gradient of nanoscale variations in adhesive ligand spacing. Nano Lett. 2008;8:2063–2069. doi: 10.1021/nl801483w. [DOI] [PMC free article] [PubMed] [Google Scholar]
- 5.Bast RC, Jr, Hennessy B, Mills GB. The biology of ovarian cancer: new opportunities for translation. Nat. Rev. Cancer. 2009;9:415–428. doi: 10.1038/nrc2644. [DOI] [PMC free article] [PubMed] [Google Scholar]
- 6.Basu S, Cunningham LP, Pins GD, Bush KA, Taboada R, Howell AR, Wang J, Campagnola PJ. Multiphoton excited fabrication of collagen matrixes cross-linked by a modified benzophenone dimer: bioactivity and enzymatic degradation. Biomacromol. 2005;6:1465–1474. doi: 10.1021/bm049258y. [DOI] [PubMed] [Google Scholar]
- 7.Bilder D. Epithelial polarity and proliferation control: links from the Drosophila neoplastic tumor suppressors. Genes Dev. 2004;18:1909–1925. doi: 10.1101/gad.1211604. [DOI] [PubMed] [Google Scholar]
- 8.Bredfeldt JS, Liu Y, Conklin MW, Keely PJ, Mackie TR, Eliceiri KW. Automated quantification of aligned collagen for human breast carcinoma prognosis. J. Pathol. Inform. 2014;5:28. doi: 10.4103/2153-3539.139707. [DOI] [PMC free article] [PubMed] [Google Scholar]
- 9.Brewer M, Wharton JT, Wang J, McWatters A, Auersperg N, Gershenson D, Bast R, Zou C. in vitro model of normal, immortalized ovarian surface epithelial and ovarian cancer cells for chemoprevention of ovarian cancer. Gynecol. Oncol. 2005;98:182–192. doi: 10.1016/j.ygyno.2005.01.051. [DOI] [PubMed] [Google Scholar]
- 10.Bush K, Driscoll P, Soto E, Lambert C, McGimpsey W, Pins G. Designing tailored biomaterial surfaces to direct keratinocyte morphology, attachment, and differentiation. J. Biomed. Mater. Res. Part A. 2009;90:999–1009. doi: 10.1002/jbm.a.32168. [DOI] [PMC free article] [PubMed] [Google Scholar]
- 11.Cannistra SA, Ottensmeier C, Niloff J, Orta B, DiCarlo J. Expression and function of β1 and αvβ3 integrins in ovarian cancer. Gynecol. Oncol. 1995;58:216–225. doi: 10.1006/gyno.1995.1214. [DOI] [PubMed] [Google Scholar]
- 12.Chen X, Brewer MA, Zou C, Campagnola PJ. Adhesion and migration of ovarian cancer cells on crosslinked laminin fibers nanofabricated by multiphoton excited photochemistry. Integr. Biol. 2009;1:469–476. doi: 10.1039/b906310b. [DOI] [PMC free article] [PubMed] [Google Scholar]
- 13.Chen X, Su Y-D, Ajeti V, Chen S-J, Campagnola PJ. Cell adhesion on micro-structured fibronectin gradients fabricated by multiphoton excited photochemistry. Cell. Mol. Bioeng. 2012;5:307–319. doi: 10.1007/s12195-012-0237-8. [DOI] [PMC free article] [PubMed] [Google Scholar]
- 14.Cunningham LP, Veilleux MP, Campagnola PJ. Freeform multiphoton excited microfabrication for biological applications using a rapid prototyping CAD-based approach. Opt. Express. 2006;14:8613–8621. doi: 10.1364/OE.14.008613. [DOI] [PubMed] [Google Scholar]
- 15.de Rooij J, Kerstens A, Danuser G, Schwartz MA, Waterman-Storer CM. Integrin-dependent actomyosin contraction regulates epithelial cell scattering. J. Cell Biol. 2005;171:153–164. doi: 10.1083/jcb.200506152. [DOI] [PMC free article] [PubMed] [Google Scholar]
- 16.Debnath J, Muthuswamy SK, Brugge JS. Morphogenesis and oncogenesis of MCF-10A mammary epithelial acini grown in three-dimensional basement membrane cultures. Methods. 2003;30:256–268. doi: 10.1016/S1046-2023(03)00032-X. [DOI] [PubMed] [Google Scholar]
- 17.Ding JA, Li D, Wang XZ, Wang CD, Wu T. Fibronectin promotes invasiveness and focal adhesion kinase tyrosine phosphorylation of human colon cancer cell. Hepatogastroenterology. 2008;55:2072–2076. [PubMed] [Google Scholar]
- 18.Engbring JA, Kleinman HK. The basement membrane matrix in malignancy. J. Pathol. 2003;200:465–470. doi: 10.1002/path.1396. [DOI] [PubMed] [Google Scholar]
- 19.Etienne-Manneville S. Polarity proteins in migration and invasion. Oncogene. 2008;27:6970–6980. doi: 10.1038/onc.2008.347. [DOI] [PubMed] [Google Scholar]
- 20.Fosser KA, Nuzzo RG. Fabrication of patterned multicomponent protein gradients and gradient arrays using microfluidic depletion. Anal. Chem. 2003;75:5775–5782. doi: 10.1021/ac034634a. [DOI] [PubMed] [Google Scholar]
- 21.Furcht LT, McCarthy JB, Palm SL, Basara ML, Enenstein J. Peptide fragments of laminin and fibronectin promote migration (haptotaxis and chemotaxis) of metastatic cells. Ciba Found. Symp. 1984;108:130–145. doi: 10.1002/9780470720899.ch9. [DOI] [PubMed] [Google Scholar]
- 22.Gardner MJ, Jones LMH, Catterall JB, Turner GA. Expression of cell adhesion molecules on ovarian tumour cell lines and mesothelial cells, in relation to ovarian cancer metastasis. Cancer Lett. 1995;91:229–234. doi: 10.1016/0304-3835(95)03743-G. [DOI] [PubMed] [Google Scholar]
- 23.Gunawan RC, Choban ER, Conour JE, Silvestre J, Schook LB, Gaskins HR, Leckband DE, Kenis PJ. Regiospecific control of protein expression in cells cultured on two-component counter gradients of extracellular matrix proteins. Langmuir. 2005;21:3061–3068. doi: 10.1021/la048303k. [DOI] [PubMed] [Google Scholar]
- 24.Gunawan RC, Silvestre J, Gaskins HR, Kenis PJ, Leckband DE. Cell migration and polarity on microfabricated gradients of extracellular matrix proteins. Langmuir. 2006;22:4250–4258. doi: 10.1021/la0531493. [DOI] [PubMed] [Google Scholar]
- 25.He R-Y, Ajeti V, Chen S-J, Brewer MA, Campagnola PJ. Ovarian cancer cell adhesion/migration dynamics on micro-structured laminin gradients fabricated by multiphoton excited photochemistry. Bioengineering. 2015;2:139–159. doi: 10.3390/bioengineering2030139. [DOI] [PMC free article] [PubMed] [Google Scholar]
- 26.Howlader N, Noone AM, Krapcho M, Garshell J, Miller D, Altekruse SF, Kosary CL, Yu M, Ruhl J, Tatalovich Z, Mariotto A, Lewis, Chen HS, Feuer EJ, Cronin KA. SEER Cancer Statistics Review, 1975–2012. Bethesda: National Cancer Institute; 2015. [Google Scholar]
- 27.Huang S, Robinson JB, DeGuzman A, Bucana CD, Fidler IJ. Blockade of nuclear factor-κB signaling inhibits angiogenesis and tumorigenicity of human ovarian cancer cells by suppressing expression of vascular endothelial growth factor and interleukin 8. Can. Res. 2000;60:5334–5339. [PubMed] [Google Scholar]
- 28.Huang RY, Wong M, Tan T, Kuay K, Ng A, Chung V, Chu Y, Matsumura N, Lai H, Lee Y. An EMT spectrum defines an anoikis-resistant and spheroidogenic intermediate mesenchymal state that is sensitive to e-cadherin restoration by a src-kinase inhibitor, saracatinib (AZD0530) Cell Death Dis. 2013;4:e915. doi: 10.1038/cddis.2013.442. [DOI] [PMC free article] [PubMed] [Google Scholar]
- 29.Huttenlocher A, Horwitz AR. Integrins in cell migration. Cold Spring Harbor Perspect. Biol. 2011;3:a005074. doi: 10.1101/cshperspect.a005074. [DOI] [PMC free article] [PubMed] [Google Scholar]
- 30.Jeon NL, Dertinger SK, Chiu DT, Choi IS, Stroock AD, Whitesides GM. Generation of solution and surface gradients using microfluidic systems. Langmuir. 2000;16:8311–8316. doi: 10.1021/la000600b. [DOI] [Google Scholar]
- 31.Kaehr B, Allen R, Javier DJ, Currie J, Shear JB. Guiding neuronal development with in situ microfabrication. Proc. Natl. Acad. Sci. USA. 2004;101:16104–16108. doi: 10.1073/pnas.0407204101. [DOI] [PMC free article] [PubMed] [Google Scholar]
- 32.Kaunas R, Nguyen P, Usami S, Chien S. Cooperative effects of Rho and mechanical stretch on stress fiber organization. Proc. Natl. Acad. Sci. USA. 2005;102:15895–15900. doi: 10.1073/pnas.0506041102. [DOI] [PMC free article] [PubMed] [Google Scholar]
- 33.Keely P. Mechanisms by which the extracellular matrix and integrin signaling act to regulate the switch between tumor suppression and tumor promotion. J. Mammary Gland Biol. Neoplasia. 2011;16:205–219. doi: 10.1007/s10911-011-9226-0. [DOI] [PMC free article] [PubMed] [Google Scholar]
- 34.Kenny HA, Chiang C-Y, White EA, Schryver EM, Habis M, Romero IL, Ladanyi A, Penicka CV, George J, Matlin K. Mesothelial cells promote early ovarian cancer metastasis through fibronectin secretion. J. Clin. Investig. 2014;124:4614. doi: 10.1172/JCI74778. [DOI] [PMC free article] [PubMed] [Google Scholar]
- 35.Kenny HA, Chiang CY, White EA, Schryver EM, Habis M, Romero IL, Ladanyi A, Penicka CV, George J, Matlin K, Montag A, Wroblewski K, Yamada SD, Mazar AP, Bowtell D, Lengyel E. Mesothelial cells promote early ovarian cancer metastasis through fibronectin secretion. J. Clin. Investig. 2014;124:4614–4628. doi: 10.1172/JCI74778. [DOI] [PMC free article] [PubMed] [Google Scholar]
- 36.Kenny HA, Kaur S, Coussens LM, Lengyel E. The initial steps of ovarian cancer cell metastasis are mediated by MMP-2 cleavage of vitronectin and fibronectin. J. Clin. Investig. 2008;118:1367–1379. doi: 10.1172/JCI33775. [DOI] [PMC free article] [PubMed] [Google Scholar]
- 37.LaFratta CN, Fourkas JT, Baldacchini T, Farrer RA. Multiphoton fabrication. Angew. Chem. Int. Ed. 2007;46:6238–6258. doi: 10.1002/anie.200603995. [DOI] [PubMed] [Google Scholar]
- 38.Latifi A, Abubaker K, Castrechini N, Ward AC, Liongue C, Dobill F, Kumar J, Thompson EW, Quinn MA, Findlay JK. Cisplatin treatment of primary and metastatic epithelial ovarian carcinomas generates residual cells with mesenchymal stem cell-like profile. J. Cell. Biochem. 2011;112:2850–2864. doi: 10.1002/jcb.23199. [DOI] [PubMed] [Google Scholar]
- 39.Lessan K, Aguiar DJ, Oegema T, Siebenson L, Skubitz APN. CD44 and β1 integrin mediate ovarian carcinoma cell adhesion to peritoneal mesothelial cells. Am. J. Pathol. 1999;154:1525–1537. doi: 10.1016/S0002-9440(10)65406-5. [DOI] [PMC free article] [PubMed] [Google Scholar]
- 40.Levental KR, Yu H, Kass L, Lakins JN, Egeblad M, Erler JT, Fong SF, Csiszar K, Giaccia A, Weninger W, Yamauchi M, Gasser DL, Weaver VM. Matrix crosslinking forces tumor progression by enhancing integrin signaling. Cell. 2009;139:891–906. doi: 10.1016/j.cell.2009.10.027. [DOI] [PMC free article] [PubMed] [Google Scholar]
- 41.Liotta L, Kohn E. The microenvironment of the tumor-host interface. Nature. 2001;411:375–379. doi: 10.1038/35077241. [DOI] [PubMed] [Google Scholar]
- 42.Maruo S, Nakamura O, Kawata S. Three-dimensional microfabrication with two-photon-absorbed photopolymerization. Opt. Lett. 1997;22:132–134. doi: 10.1364/OL.22.000132. [DOI] [PubMed] [Google Scholar]
- 43.Mooney J, Hunt A, McIntosh J, Liberko C, Walba D, Rogers C. Patterning of functional antibodies and other proteins by photolithography of silane monolayers. Proc. Natl. Acad. Sci. 1996;93:12287–12291. doi: 10.1073/pnas.93.22.12287. [DOI] [PMC free article] [PubMed] [Google Scholar]
- 44.Ning Y, Zeineldin R, Liu Y, Rosenberg M, Stack MS, Hudson LG. Down-regulation of integrin α2 surface expression by mutant epidermal growth factor receptor (EGFRvIII) induces aberrant cell spreading and focal adhesion formation. Can. Res. 2005;65:9280–9286. doi: 10.1158/0008-5472.CAN-05-0407. [DOI] [PubMed] [Google Scholar]
- 45.Oudin MJ, Jonas O, Kosciuk T, Broye LC, Guido BC, Wyckoff J, Riquelme D, Lamar JM, Asokan SB, Whittaker C, Ma D, Langer R, Cima MJ, Wisinski KB, Hynes RO, Lauffenburger DA, Keely PJ, Bear JE, Gertler FB. Tumor cell-driven extracellular matrix remodeling drives haptotaxis during metastatic progression. Cancer Discov. 2016;6:516–531. doi: 10.1158/2159-8290.CD-15-1183. [DOI] [PMC free article] [PubMed] [Google Scholar]
- 46.Petrie RJ, Doyle AD, Yamada KM. Random versus directionally persistent cell migration. Nat. Rev. Mol. Cell Biol. 2009;10:538–549. doi: 10.1038/nrm2729. [DOI] [PMC free article] [PubMed] [Google Scholar]
- 47.Pitts JD, Campagnola PJ, Epling GA, Goodman SL. Submicron multiphoton free-form fabrication of proteins and polymers: studies of reaction efficiencies and applications in sustained release. Macromolecules. 2000;33:1514–1523. doi: 10.1021/ma9910437. [DOI] [Google Scholar]
- 48.Plummer ST, Wang Q, Bohn PW, Stockton R, Schwartz MA. Electrochemically derived gradients of the extracellular matrix protein fibronectin on gold. Langmuir. 2003;19:7528–7536. doi: 10.1021/la030075r. [DOI] [Google Scholar]
- 49.Poon SL, Klausen C, Hammond GL, Leung PC. 37-kDa laminin receptor precursor mediates GnRH-II-induced MMP-2 expression and invasiveness in ovarian cancer cells. Mol. Endocrinol. 2011;25:327–338. doi: 10.1210/me.2010-0334. [DOI] [PMC free article] [PubMed] [Google Scholar]
- 50.Rhoads DS, Guan J-L. Analysis of directional cell migration on defined FN gradients: role of intracellular signaling molecules. Exp. Cell Res. 2007;313:3859–3867. doi: 10.1016/j.yexcr.2007.06.005. [DOI] [PMC free article] [PubMed] [Google Scholar]
- 51.Ricciardelli C, Rodgers RJ. Extracellular matrix of ovarian tumors. Semin. Reprod. Med. 2006;24:270–282. doi: 10.1055/s-2006-948556. [DOI] [PubMed] [Google Scholar]
- 52.Roussos ET, Condeelis JS, Patsialou A. Chemotaxis in cancer. Nat. Rev. Cancer. 2011;11:573–587. doi: 10.1038/nrc3078. [DOI] [PMC free article] [PubMed] [Google Scholar]
- 53.Rowe RG, Weiss SJ. Navigating ECM barriers at the invasive front: the cancer cell-stroma interface. Annu. Rev. Cell Dev. Biol. 2009;25:567–595. doi: 10.1146/annurev.cellbio.24.110707.175315. [DOI] [PubMed] [Google Scholar]
- 54.Shibata K, Kikkawa F, Nawa A. Enhanced matrix metalloproteinase 9 secretion by fibronectin both focal adhesion kinase and c-Ras are required for the in ovarian cancer cells. Can. Res. 1998;58:900–903. [PubMed] [Google Scholar]
- 55.Sisci D, Aquila S, Middea E, Gentile M, Maggiolini M, Mastroianni F, Montanaro D, Ando S. Fibronectin and type IV collagen activate ERalpha AF-1 by c-Src pathway: effect on breast cancer cell motility. Oncogene. 2004;23:8920–8930. doi: 10.1038/sj.onc.1208098. [DOI] [PubMed] [Google Scholar]
- 56.Sood AK, Coffin JE, Schneider GB, Fletcher MS, DeYoung BR, Gruman LM, Gershenson DM, Schaller MD, Hendrix MJ. Biological significance of focal adhesion kinase in ovarian cancer: role in migration and invasion. Am. J. Pathol. 2004;165:1087–1095. doi: 10.1016/S0002-9440(10)63370-6. [DOI] [PMC free article] [PubMed] [Google Scholar]
- 57.Sridhar M, Basu S, Scranton VL, Campagnola PJ. Construction of a laser scanning microscope for multiphoton excited optical fabrication. Rev. Sci. Instrum. 2003;74:3474–3477. doi: 10.1063/1.1584079. [DOI] [Google Scholar]
- 58.Strobel T, Cannistra SA. β1-integrins partly mediate binding of ovarian cancer cells to peritoneal mesothelium in vitro. Gynecol. Oncol. 1999;73:362–367. doi: 10.1006/gyno.1999.5388. [DOI] [PubMed] [Google Scholar]
- 59.Théry M, Racine V, Piel M, Pépin A, Dimitrov A, Chen Y, Sibarita J-B, Bornens M. Anisotropy of cell adhesive microenvironment governs cell internal organization and orientation of polarity. Proc. Natl. Acad. Sci. 2006;103:19771–19776. doi: 10.1073/pnas.0609267103. [DOI] [PMC free article] [PubMed] [Google Scholar]
- 60.Turpeenniemi-Hujanen T, Thorgeirsson U, Rao C, Liotta L. Laminin increases the release of type IV collagenase from malignant cells. J. Biol. Chem. 1986;261:1883–1889. [PubMed] [Google Scholar]
- 61.von Philipsborn AC, Lang S, Jiang Z, Bonhoeffer F, Bastmeyer M. Substrate-bound protein gradients for cell culture fabricated by microfluidic networks and microcontact printing. Sci. STKE. 2007;2007:pl6. doi: 10.1126/stke.4142007pl6. [DOI] [PubMed] [Google Scholar]
- 62.Wodarz A, Nathke I. Cell polarity in development and cancer. Nat. Cell Biol. 2007;9:1016–1024. doi: 10.1038/ncb433. [DOI] [PubMed] [Google Scholar]
- 63.Yousif NG. Fibronectin promotes migration and invasion of ovarian cancer cells through up-regulation of FAK-PI3K/Akt pathway. Cell Biol. Int. 2014;38:85–91. doi: 10.1002/cbin.10184. [DOI] [PubMed] [Google Scholar]


