Abstract
In this protocol, we describe proximal ligation assay (PLA), an antibody-based detection method for protein-protein interaction. This method relies on specific binding of individual primary antibodies to the two putative interacting proteins. The primary antibodies need to have different hosts. The secondary antibodies against the two hosts have complementary oligonucleotide moieties attached to them. If the two antigens are in close proximity (presumably interacting with each other), the complementary oligonucleotides can anneal and fluorescent nucleotides can be incorporated in a single DNA polymerization step. Under a microscope, these reactions appear as punctate fluorescent spots, indicating successful PLA reaction and suggesting protein-protein interaction between the two antigens.
Keywords: Proximal ligation assay, Protein-protein interaction, Toll-like receptors, Fluorescence microscopy, Bronchial epithelium, Macrophages, J774, Duolink
Background
Proximal ligation assay (PLA) is an antibody-based technique to determine whether two proteins are with 40 nm of each other. Proteins detected in this manner are identifiable by fluorescence ( Ho et al., 2012 ; Banerjee et al., 2015 ). This makes PLA an excellent tool for locating protein-protein interactions. Activation of toll-like receptor (TLR) pathways is an important part of the innate immune response to pathogenic threats. TLRs recognize pathogen-associated molecules and induce a signaling cascade to effect a rapid response to infection. TLR2 and TLR4 are two well-studied members of the TLR family that respond to different stimuli. While both receptors activate in response to bacterial infection, only TLR4 responds to lipopolysaccharide exposure. They activate some shared signaling cascades, however, including the MyD88/Traf6 pathway. The induction of this pathway includes the formation a signaling complex known as the myddosome ( Gay et al., 2011 ; Xiong et al., 2011 ; Cleaver et al., 2014 ), a protein complex that includes the MyD88, IRAK1, IRAK4 and Traf6 among others. Myddosome assembly results in NF-κb-mediated inflammatory response and pathogen clearance.
Visualizing the engagement of TLR signaling pathways is an important step in identifying and locating immune response. Here, we use PLA to detect TLR pathway activation in fixed lung tissue and a cultured peritoneal macrophage cell-line under treatment with LPS or exposure to opportunistic infection. This method fluorescently labels proteins that interact and remain within close proximity. Using fluorescence microscopy to visualize the resulting labels in vivo allows us to identify the protein complex in respect to tissue location. Here, we demonstrate the ability of this assay to detect TLR2 activation during opportunistic lung infection in vivo and myddosome formation after LPS treatment of peritoneal macrophage cells in vitro. We have also shown the specificity of the technique, as it does not indicate TLR2 activation after LPS treatment in vivo.
Materials and Reagents
NuncTM Lab-TekTM II Chamber SlideTM System (Thermo Fisher Scientific, Thermo ScientificTM, catalog number: 154534)
0.22 µm PVDF syringe filter (EMD Millipore, catalog number: SLGV004SL)
Coverslip (22 x 40 mm) (VWR, catalog number: 470019-008)
Lung tissue harvested from morphine-treated and/or Streptococcus pneumoniae-infected mice
J774 cells, a murine peritoneal macrophage cell line (ATCC, catalog number: TIB-67)
-
Primary antibodies
Note: Each pair used in PLA reaction needs to be validated for specificity with Western blot (both native and SDS-PAGE) and must come from a different host, compatible with Duolink secondary antibodies with PLA probes.
-
Affinity isolated anti-TRAF6 antibody raised in rabbit (Sigma-Aldrich, catalog number: SAB2102531)
Note: This product has been discontinued.
Affinity isolated anti-TLR2 antibody raised in rabbit (Sigma-Aldrich, catalog number: SAB1300199)
Monoclonal anti-MYD88 (Clone OTI2B2) (OriGene Technologies, catalog number: TA502117)
-
-
Secondary antibodies linked to PLA probes
Duolink® in situ PLA® probe anti-mouse MINUS, Affinity purified Donkey anti-Mouse IgG (H+L) (Sigma-Aldrich, catalog number: DUO92004)
Duolink® in situ PLA® probe anti-rabbit PLUS, Affinity purified Donkey anti-Rabbit IgG (H+L) (Sigma-Aldrich, catalog number: DUO92002)
Formalin solution, neutral buffered, 10% (10% NBF) (Sigma-Aldrich, catalog number: HT501128-4L)
Paraffin (Fisher Scientific, catalog number: P31-500)
Xylene (Histological grade) (Fisher Scientific, catalog number: X3S-4)
Ethanol 200 proof (Merck, catalog number: AX0441)
Fixation-permeabilization buffer set (Thermo Fisher Scientific, eBiosciencesTM, catalog number: 88-8824-00)
Phosphate-buffered saline (PBS) pH 7.4 (1x) (Thermo Fisher Scientific, GibcoTM, catalog number: 10010023)
Tween® 20 (Fisher Scientific, catalog number: BP337-100)
Duolink® in situ mounting medium with DAPI (Sigma-Aldrich, catalog number: DUO82049)
Nail polish (as cover slip sealant)
DMEM/High glucose (4,500 mg/L L-glucose) (GE Healthcare, HyCloneTM, catalog number: SH30243.01)
Penicillin-streptomycin (10,000 U/ml) (Thermo Fisher Scientific, GibcoTM, catalog number: 15140122)
Fetal bovine serum (FBS), qualified, USDA-approved regions (Thermo Fisher Scientific, GibcoTM, catalog number: 10437010)
Ultrapure 0.5 M EDTA, pH 6.0 (Thermo Fisher Scientific, InvitrogenTM, catalog number: 15575020)
Lipopolysaccharides from Escherichia coli O127:B8 (Sigma-Aldrich, catalog number: L3880)
Duolink® in situ wash buffers, fluorescence (Sigma-Aldrich, catalog number: DUO82049)
Duolink® in situ detection reagents orange (Sigma-Aldrich, catalog number: DUO92007)
Duolink in situ wash buffers A and B (Sigma-Aldrich, catalog number: DUO82047)
Duolink in situ wash buffer A working solution (see Recipes)
Duolink in situ wash buffer B working solution (see Recipes)
Equipment
Coplin Jar (Generic)
Oil marker (Aqua-hold pap pen) (Electron Microscopy Sciences, catalog number: 71311)
Vegetable steamer (Generic)
Slide humidity chamber (Simport, model: M920)
Laboratory shaker or rocker
-
Flourescence filters (Leica)
Filter set 49, Excitation G365, Emission 445/50
Filter set 43 HE, Excitation BP550/25, Emission 605/70
Flourescence microscope
Software
ImageJ software (https://imagej.nih.gov/ij/)
Procedure
-
Antibody selection
To identify protein-protein interactions, primary antibodies recognizing both proteins must be used. Since the specificity of the antibody is of paramount importance, it is recommended that the antibody is used for Western blot analysis using tissue lysate in both naïve and denaturing conditions. The goal is to obtain highest specificity in both conditions as the following steps might have a mix of target antigens in naïve and denatured condition within the cell.
Primary antibodies must differ in the source species (e.g., anti-MyD88 raised in rabbit and anti-TRAF6 raised in mouse).
Each oligonucleotide-conjugated secondary antibody must recognize one of the primary antibodies.
-
Sample preparation
-
Tissue slides
Tissue collected from in vivo sources should be immediately fixed in 10% NBF before embedding in paraffin.
Mount 5-8 µm sections from paraffin blocks to slides.
Deparaffinize slides by dipping them into xylene bath (3-4 dips and 15-20 sec holding time) and rehydrate slides with serial ethanol washes (100, 70, 50, 30 and 0% solutions with water).
Add permeabilization buffer (1x) sufficient to cover the section for 40 min at 4 °C in the dark.
Wash the slides once with PBS and incubate slides in a vegetable steamer for 1 h.
Note: In our example, we use lung tissue harvested from morphine-treated and/or pneumococcus-infected mice.
-
Cultured cell slides
Plate 40,000 to 50,000 cells/ml media, on a chamber slide and incubate overnight to allow cells to adhere to the slide to a concentration of 60-80% confluence.
Perform any necessary treatments to the cells within chambers.
Remove media and immediately fix cells by adding 10% NBF to each chamber and incubating for 20 min at room temperature.
Remove chamber walls.
Wash slides with PBS three times.
Permeabilize by incubating slides with 0.01% Tween 20 in PBS for 10 min at room temperature.
Wash slides with PBS three times.
Note: In our example, we use J774 cells, a murine peritoneal macrophage cell line. We treated these cells with different concentrations of LPS for 1 h to induce myddosome ligation with TLR4.
-
-
PLA protocol
Tap slides to remove excess liquid then air-dry and outline tissue sections or wells with an oil marker.
Incubate slides with blocking solution in a humidity chamber for 30 min at 37 °C.
Remove blocking solution and add enough of both primary antibodies reconstituted in blocking solution (approximately 1 µg antibody/chamber or per section) to cover each section or chamber.Note: Approximately 40 µl of solution will be sufficient to cover a chamber.
Incubate in a humidity chamber overnight at 4 °C.
Place slides in a Coplin jar filled with wash buffer A (see Recipes) two times for five minutes each on a laboratory shaker.
Add oligonucleotide-linked secondary antibody solution, diluted 1:10 in wash buffer A (enough to cover the section/cells) to slides.
Incubate in a humidity chamber for 1 h at 37 °C.
Wash in wash buffer A two times for five minutes each on a shaker.
-
Add ligase solution to slide (enough to cover the section/cells) and incubate for 30 min in a humidity chamber at 37 °C.
Note: Working concentration of ligase should be 1:40 from the original vial, diluted with molecular biology grade water.
Wash in wash buffer A two times for five minutes each on a shaker.
-
Add premixed polymerase and nucleotide solution to slide and incubate for 100 min at 37 °C.
Note: After this point, limit exposure of slide to light. Working concentration of polymerase should be 1:80 of original solution, diluted with molecular biology grade water. Wash in wash buffer B (see Recipes) twice for 10 min each.
Wash in 1x wash buffer B for one minute.
Allow slides to dry.
Mount coverslip in mounting medium with DAPI.
Seal edges of cover slip with nail polish.
Allow to dry.
Data analysis
-
Imaging (Figure 1)
Using a fluorescence microscope and DAPI-appropriate filter (such as Filter set 49 from Leica), identify and photograph cells/tissue on your slide.
-
Photograph the same area using a filter appropriate for your PLA probe.
Notes:
In our example, we use filter set 43 HE from Leica to identify our PLA probe, Duolink in situ detection reagents orange.
Be sure to save the individual image files for your DAPI and PLA probe images separately, in addition to the merged image.
-
Quantification (Figure 2)
-
Determine cell count
In ImageJ, open the file containing the DAPI image.
-
Select Image > Adjust > Color Threshold...
Note: This applies to color images. If using a grey-scale image, select Image > Adjust > Threshold...
Adjust the parameters in this dialog box until DAPI-stained nuclei are entirely, but distinctly highlighted.
Select Analyze > Analyze particles...
Check the ‘Summary’ checkbox then select ‘OK’.
The resulting ‘Summary’ window will contain the total count of nuclei.
-
Determine the number of PLA reactions
In Image J, open the file containing the PLA image.
-
Select Image > Adjust > Color Threshold...
Note: This applies to color images. If using a grey-scale image, select Image > Adjust > Threshold...
Adjust the parameters in this dialog box until PLA reaction sites are entirely, but distinctly highlighted.
Select Analyze > Analyze particles...
Check the ‘Summary’ checkbox then select ‘OK’.
The resulting ‘Summary’ window will contain the total count of PLA reactions.
-
Compare the number of PLA reactions in your sample to the number of nuclei to determine the number of protein interactions per cell.
Notes: This is a simple ratio of positive PLA fluorescence and DAPI.
Macros and batch analysis may be used to rapidly analyze multiple pictures in ImageJ.
If the cell number is low in the image, manual counting may be better suited and more accurate for your study.
-
-
Results
J774 cells: J774 is a murine macrophage cell lines, which was treated with varying concentrations of LPS to activate the TLR4 pathway. This entails recruitment of Myd88 (as a part of a bigger myddosome complex) to TLR4 and its subsequent ligation to Traf6, an E3 ubiquitin ligase. If TLR4 is activated successfully, Myd88 and Traf6 would be ligated within the first hour of reaction as shown in Figure 3.
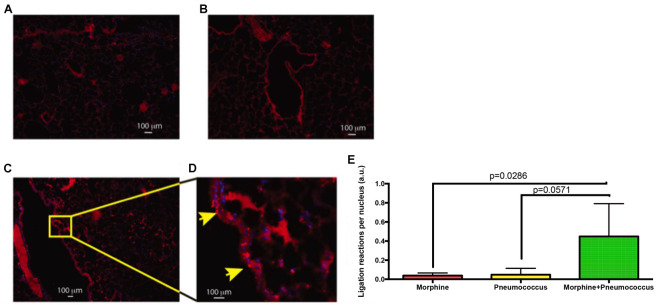
Lung Section: C57bl6/j animals were either treated with Morphine or S. pneumoniae or both for 72 h and their lung sections were used to perform PLA between TLR2 and Myd88. As shown in Figure 4, individual treatments did not exhibit positive PLA reaction. This is expected because morphine treatment by itself does not activate TLRs, but makes the individual susceptible to opportunistic infections. S. pneumoniae alone also doesn’t activate TLR2 due to intact epithelial barrier of the lungs. A combined treatment, however, shows positive PLA reaction due to activation of TLR2.
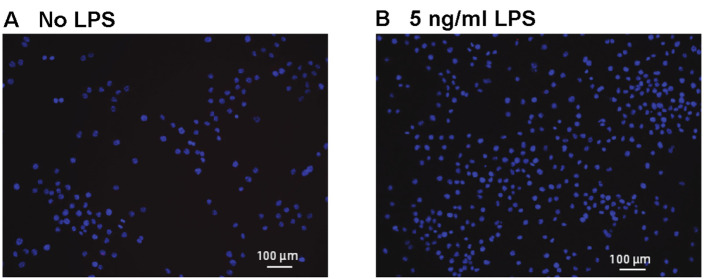
Negative control: This experiment was performed to test the integrity of the method, in addition to individual controls within each experiment. As shown in Figure 5, we performed a PLA reaction for TLR2 and Myd88 in J774 cells treated with LPS. This reaction was negative as expected, since LPS stimulates TLR4 and Myd88 should not bind to TLR2 under these conditions.
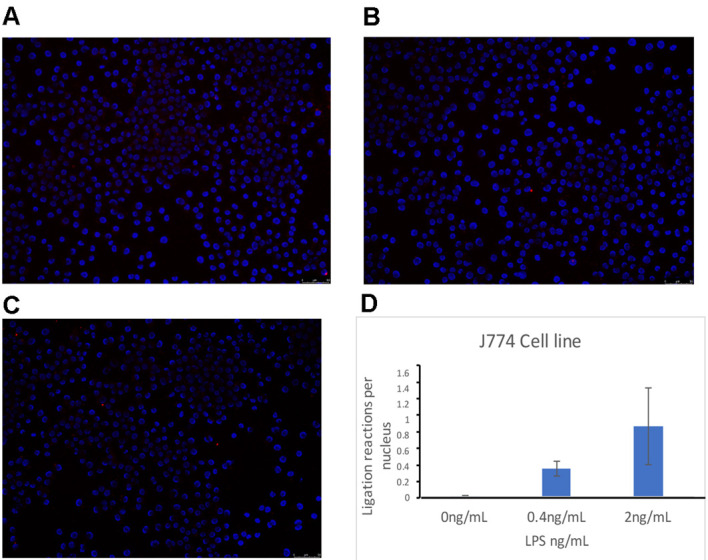
Positive control: We validated the capability of the method to detect protein interactions. As shown in Figure 6, we performed a PLA reaction for TLR4 and CD14 in J774 cells treated with LPS. We detected LPS-dependent interaction between TLR4 and CD14. This is expected since TLR4/CD14 interaction under LPS treatment has been characterized thoroughly.
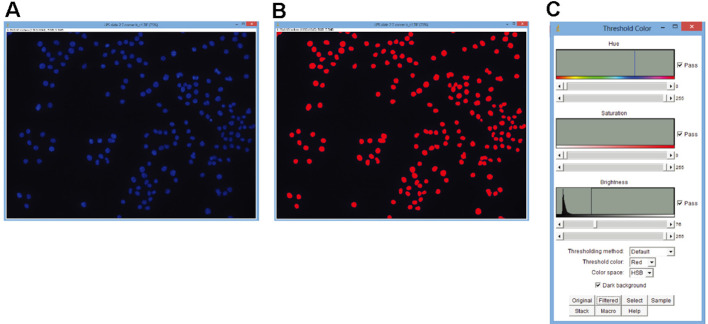
Figure 1. Use of ImageJ to detect fluorescent particles.
Color threshold was used as described above. A. Unedited image of DAPI-stained J774 cells; B. The same image after application of a color threshold; C. Example of the settings used for this threshold.
Figure 2. Example of a, IJM language macro used to create a color threshold for PLA reactions in a fluorescent image.
Because the image used was only the PLA fluorescence instead of the merged image, min and max settings for the hue and saturation could be inclusive (Lines 14, 15 for Hue; lines 17, 18 for saturation). Minimum brightness was adjusted to eliminate background while including signal (Line 20). Macro creates a mask and counts particles remaining after the threshold is applied. Macro may be used to count particles from multiple image files at once by use of the batch function built into ImageJ.
Figure 3. Proximal ligation assay showing MyD88 Traf6 activation in J774 cells.

Cells were treated with LPS at varying concentrations for 1 h before fixation and PLA. A. Untreated J774 cells; B. 2 ng/ml LPS-treated J774 cells; C. Quantification of the number of ligation reactions per DAPI-stained cell. Scale bars =100 µm.
Figure 4. PLA showing TLR2/MyD88 interaction in mouse lung epithelium.
Images represent (A) 72-h morphine treatment (B) Infection with S. pneumoniae (C) 72-h morphine treatment and S. pneumoniae infection. D. Expanded section showing ligation reaction sites (Arrows) in the lung epithelium of the Morphine + Pneumococcus group. E. Results were quantified by counting the number of ligation reactions per DAPI-stained nucleus. Scale bars = 100 µm.
Figure 5. PLA showing no interaction between TLR2 and MyD88 in J774 cells treated with LPS.
We observed few or no PLA reactions in any of the treatment groups. LPS is an activator of TLR4, not TLR2. While both TLR2 and MyD88 antibodies are likely interacting with their respective antigens, the antigens are not present within 40 nm of each other and will not induce PLA reactions. Scale bars = 100 µm.
Figure 6. Proximal ligation assay showing TLR4/CD14 interaction in J774 cells treated for 30 min with LPS.

A. Untreated J774 cells; B. 0.4 ng/ml LPS-treated J774 cells; C. 2 ng/ml LPS-treated J774 cells; D. Quantification of the number of ligation reactions per DAPI-stained cell. Scale bars = 50 µm.
Notes
As mentioned before, Duolink PLA method works reproducibly well in both in vitro and in vivo conditions with caveats. The considerations one should keep in mind are as follows:
In our experience, the quality of chamber slides is very important. Various brands were tried and Nunc brand (No. 1 in Materials above) gave us the cleanest results. Chamber slides with synthetic base should be avoided. Good quality optically clear glass base works the best.
We have used the 8-well chamber slide for reagent optimization and having enough experimental replicates (n = 4 in this case for each condition). However, care should be taken in washing steps since the edge surface tension is quite strong in these chamber slides and optimal wash could be challenging. While washing, occasional swirling motion is advised to cover the whole chamber, including the edges.
PLA works best for 60-80% confluent cells. We have always preferred this concentration since it leaves patches of the chamber base empty, which serves as an additional control for non-specific binding of the reagents.
For in vivo experiments, the background staining is higher than in plated cells. This is expected and the non-specific background is usually a uniform hue, rather than punctate stain. Due to high levels of non-specific staining observed in in vivo samples, you may wish to increase blocking times for tissue samples. This should be optimized depending on the source of the tissue e.g., intestinal and adipose tissues may require less or more incubation time compared to the lung tissues used here.
Fixed tissue slides must be subject to antigen retrieval before incubation with individual antibodies. A combination of flow-cytometric permeabilization buffer and vegetable steamer based antigen retrieval has consistently given us successful PLA reaction.
In general, PLA reaction always gives punctate fluorescence. In rare circumstances, if the PLA reaction gives continuous stain, specific reaction should be verified using proper experimental controls and single-antibody controls.
In reference to the selection of primary antibodies, each pair used in the PLA reaction needs to be validated for specificity by Western blot (both native and SDS-PAGE) and must come from a different host, compatible with Duolink secondary antibodies with PLA probes.
Recipes
-
Duolink in situ wash buffer A
-
Alternative 1–use Duolink in situ wash buffer A
To prepare a 1x buffer, dissolve the content of one pouch in high purity water to a final volume of 1,000 ml. Store pouches at room temperature
Note: Expiry date is marked on each individual lot. 1x solutions may be kept at room temperature for short time storage (one week or less). For long time storage store at 4 °C. Bring the solutions to room temperature before use.
-
Alternative 2–make your own Duolink in situ wash buffer A
Dissolve 8.8 g NaCl, 1.2 g Tris base and 0.5 ml Tween 20 in 800 ml high purity water
Adjust pH to 7.4 using HCl
Add high purity water to 1,000 ml (final concentrations 0.01 M Tris, 0.15 M NaCl and 0.05% Tween 20)
Filter the solution through a 0.22 µm filter and store at 4 °C
Bring the solutions to room temperature before use
-
-
Duolink in situ wash buffer B
-
Alternative 1–use Duolink in situ wash buffer B
To prepare a 1x buffer, dissolve the content of one pouch in high purity water to a final volume of 1,000 ml. Store pouches at room temperature
Note: Expiry date is marked on each individual lot. 1x solutions may be kept at room temperature for short time storage (one week or less). For long time storage store at 4 °C. Bring the solutions to room temperature before use.
-
Alternative 2–make your own Duolink in situ wash buffer B
Dissolve 5.84 g NaCl, 4.24 g Tris base and 26.0 g Tris-HCl in 500 ml high purity water
Adjust pH to 7.5 using HCl
Add high purity water to 1,000 ml (final concentrations 0.2 M Tris and 0.1 M NaCl)
Filter the solution through a 0.22 µm filter and store at 4 °C
Bring the solutions to room temperature before use
-
Acknowledgments
This work was partially supported by NIH R21HL125021 and University of Miami institutional support (to SB). The authors declare no conflict of interests. Data for all figures were generated exclusively for this protocol. However, PLA protocol was adapted for J774 cells from our previous publication ( Banerjee et al., 2015 ), SciRep 5:11384; Reference No. 1 for this protocol), where it was performed on 16HBE14o (human bronchial epithelium cell line). PLA on lung tissue was adapted and modified exclusively for this protocol as described in the text.
Citation
Readers should cite both the Bio-protocol article and the original research article where this protocol was used.
References
- 1.Banerjee S., Ninkovic J., Meng J., Sharma U., Ma J., Charboneau R. and Roy S.(2015). Morphine compromises bronchial epithelial TLR2/IL17R signaling crosstalk, necessary for lung IL17 homeostasis. Sci Rep 5: 11384. [DOI] [PMC free article] [PubMed] [Google Scholar]
- 2.Cleaver J. O., You D., Michaud D. R., Pruneda F. A., Juarez M. M., Zhang J., Weill P. M., Adachi R., Gong L., Moghaddam S. J., Poynter M. E., Tuvim M. J. and Evans S. E.(2014). Lung epithelial cells are essential effectors of inducible resistance to pneumonia. Mucosal Immunol 7(1): 78-88. [DOI] [PMC free article] [PubMed] [Google Scholar]
- 3.Gay N. J., Gangloff M. and O’Neill L. A.(2011). What the Myddosome structure tells us about the initiation of innate immunity. Trends Immunol 32(3): 104-9. [DOI] [PubMed] [Google Scholar]
- 4.Ho P. C., Tsui Y. C., Feng X., Greaves D. R. and Wei L. N.(2012). NF-κB-mediated degradation of the coactivator RIP140 regulates inflammatory responses and contributes to endotoxin tolerance. Nat Immunol 13(4): 379-386. [DOI] [PMC free article] [PubMed] [Google Scholar]
- 5.Xiong Y., Qiu F., Piao W., Song C., Wahl L. M. and Medvedev A. E.(2011). Endotoxin tolerance impairs IL-1 receptor-associated kinase(IRAK) 4 and TGF-β-activated kinase 1 activation, K63-linked polyubiquitination and assembly of IRAK1, TNF receptor-associated factor 6, and IκB kinase γ and increases A20 expression. J Biol Chem 286(10): 7905-7916. [DOI] [PMC free article] [PubMed] [Google Scholar]


