

Abstract
Purpose
We examined disparities in prognosis between patients with ovarian clear cell carcinoma (OCCC) and serous epithelial ovarian cancer (SOC).
Methods
We reviewed data from FIGO stage I–IV epithelial ovarian cancer patients who participated in 12 prospective randomized GOG protocols. Proportional hazards models were used to compare progression-free survival (PFS) and overall survival (OS) by cell type (clear cell versus serous).
Results
There were 10,803 patients enrolled, 9,531 were eligible, evaluable and treated with platinum, of whom 544 (6%) had OCCC, 7,054 (74%) had SOC, and 1,933 (20%) had other histologies and are not included further. In early stage (I–II) patients, PFS was significantly better in OCCC than in SOC patients. For late stage (III, IV) patients, OCCC had worse PFS and OS compared to SOC, OS HR= 1.66 (1.43, 1.91; p<0.001. After adjusting for age and stratifying by protocol and treatment arm, stage, performance status, and race, OCCC had a significantly decreased OS, HR= 1.53 (1.33, 1.76; p<0.001). In early stage cases, there was a significantly decreased treatment effect on PFS for consolidative therapy with weekly Paclitaxel versus observation in OCCC compared to SOC (p=0.048).
Conclusions
This is one of the largest analyses to date of OCCC treated on multiple cooperative group trials. OCCC histology is more common than SOC in early stage disease. When adjusted for prognostic factors, in early stage patients, PFS was better for OCCC than for SOC; however, in late-stage patients, OCCC was significantly associated with decreased OS. Finally, treatment effect was influenced by histology.
Keywords: Ovarian, cancer, clear cell, survival, histology
INTRODUCTION
Ovarian tumors are classified into three categories based on progenitor cell type: surface-epithelial, sex cord-stromal and germ cell neoplasms.1 Of these, epithelial ovarian cancers (EOCs which may, in fact, often originate from the fallopian tube) comprise the majority of cases, and these are usually diagnosed at an advanced stage with an associated poor prognosis. Serous epithelial ovarian carcinoma (SOC) is the most commonly observed subtype of EOC both in the United States2 and worldwide.3,4 In the United States, ovarian clear cell carcinoma (OCCC) accounts for approximately 4–9.5%2 of ovarian tumors, whereas in Japan, the rate is upwards of 15–25%.3,5 Meanwhile, Asians, as defined in the SEER registry, in the United States account for a disproportionate share of OCCC cases with a percentage of SOC rate of 11.1% when compared with whites (4.8%).6
Controversy exists in the literature regarding the prognostic effect of the clear cell histology, although it has been generally accepted as unfavorable when compared with SOC. In long-term follow-up of two early Gynecologic Oncology Group (GOG) studies, multivariate analysis revealed histology other than clear cell or mucinous to be a statistically significant favorable characteristic for overall survival (OS) in advanced stage disease.7 Several other retrospective studies have highlighted the relatively poor prognosis conferred by clear cell histology, when compared to other histologic subtypes of epithelial ovarian cancer (EOC).8–10 However, these observations have been refuted by some retrospective studies11,12.
We sought to clarify the suggested differences in prognosis between OCCC and SOC by leveraging the robust data obtained during the course of twelve prospective cooperative group studies. The objectives of this analysis were to confirm whether disparity exists with regard to outcome between ovarian cancer patients with OCCC and SOC in prospectively enrolled clinical trials, to identify factors associated with survival, and to identify factors related to response to chemotherapy. Factors considered included age, stage, performance status, clear cell versus serous histology, and race.
METHODS
We reviewed data from International Federation of Gynecology and Obstetrics (FIGO) stage I–IV EOC patients who participated in twelve prospective, randomized GOG chemotherapy protocols (GOG protocol 95, 157 (both early stage), 111, 114, 132, 152, 158, 162, 172, 175, 182, 218 (all late stage) Table 1) conducted between 1992 and 2009, all of which were IRB approved. All patients included in these protocols were diagnosed with primary, histologically-confirmed by central pathology review, epithelial ovarian, tubal or primary peritoneal cancer. All borderline and low malignant potential tumors were excluded. All patients signed institutionally IRB-approved informed consent. All patients included in this analysis received platinum based chemotherapy per specific protocol. Table 1 lists the treatment arms for each of the protocols under evaluation.
Table 1.
Protocol Treatment Arms by Cell Type All – Non-Excluded Patients (N=9,842)
| GOG Protocol/Treatment | Clear Cell, Serous, or Other | ||||||
|---|---|---|---|---|---|---|---|
| Clear Cell | Serous | Other | |||||
| n | (%) | n | (%) | n | (%) | ||
| All | 573 | (6) | 7233 | (73) | 2036 | 21 | |
| 95 | IP P32† | 25 | (26) | 22 | (22) | 51 | (52) |
| Cyclophosphamide + Cisplatin | 22 | (21) | 19 | (18) | 66 | (62) | |
| 111 | Cyclophosphamide + Cisplatin | 5 | (2) | 131 | (65) | 66 | (33) |
| Paclitaxel + Cisplatin | 3 | (2) | 141 | (77) | 40 | (22) | |
| 114 | Cyclophosphamide + Cisplatin | 2 | (4) | 34 | (62) | 19 | (35) |
| Paclitaxel + Cisplatin | 7 | (3) | 158 | (70) | 61 | (27) | |
| Carboplatin, then Cisplatin + paclitaxel | 8 | (3) | 150 | (64) | 78 | (33) | |
| 132 | Cisplatin | 1 | (1) | 142 | (71) | 57 | (29) |
| Paclitaxel† | 4 | (2) | 157 | (74) | 52 | (24) | |
| Paclitaxel + Cisplatin | 8 | (4) | 131 | (65) | 62 | (31) | |
| 152 | Cisplatin + Paclitaxel, 2nd surgery | 4 | (2) | 163 | (77) | 46 | (22) |
| Cisplatin + Paclitaxel | 3 | (1) | 159 | (76) | 47 | (22) | |
| 157 | Carboplatin + Paclitaxel × 3 | 52 | (33) | 34 | (22) | 70 | (45) |
| Carboplatin + Paclitaxel × 6 | 38 | (26) | 33 | (23) | 75 | (51) | |
| 158 | Cisplatin + Paclitaxel (24 hr) | 10 | (3) | 281 | (70) | 109 | (27) |
| Carboplatin + Paclitaxel (3 hr) | 21 | (5) | 290 | (74) | 81 | (21) | |
| 162 | Cisplatin + Paclitaxel (24 hr) | 5 | (4) | 103 | (74) | 32 | (23) |
| Cisplatin + Paclitaxel (96 hr) | 6 | (4) | 108 | (77) | 26 | (19) | |
| 172 | IV Paclitaxel + Cisplatin | 9 | (4) | 170 | (81) | 31 | (15) |
| IV Paclitaxel + IP Cisplatin + IP Paclitaxel | 11 | (5) | 157 | (77) | 36 | (18) | |
| 175 | Paclitaxel + Carboplatin followed by weekly Paclitaxel | 80 | (31) | 69 | (27) | 105 | (41) |
| Paclitaxel + Carboplatin followed by observation | 77 | (31) | 74 | (29) | 100 | (40) | |
| 182 | Paclitaxel + Carboplatin | 19 | (3) | 614 | (83) | 105 | (14) |
| Paclitaxel + Carboplatin + Gem | 27 | (4) | 618 | (84) | 89 | (12) | |
| Paclitaxel + PLD + Carboplatin | 26 | (4) | 604 | (81) | 112 | (15) | |
| Carboplatin + Topotecan followed by Paclitaxel + Carboplatin | 23 | (3) | 600 | (81) | 114 | (15) | |
| Carboplatin + Gemcitabine followed by Paclitaxel + Carboplatin | 26 | (4) | 594 | (81) | 116 | (16) | |
| 218 | Carboplatin + Paclitaxel + Placebo, then Placebo | 11 | (2) | 510 | (88) | 60 | (10) |
| Carboplatin + Paclitaxel + Bevacizumab, then Placebo | 21 | (4) | 479 | (84) | 69 | (12) | |
| Carboplatin + Paclitaxel + Bevacizumab, then Bevacizumab | 19 | (3) | 488 | (86) | 61 | (11) | |
Protocols 95, 157, and 175 include only early stage (I–II) cancers. All other protocols include only late stage (III–IV) cancers.
Highlighted arms, excluded from analysis
Pearson chi-square tests were used to test the hypothesis of independence between histology (clear cell versus serous) and baseline characteristics (age, race, performance status, stage, and optimal (< 1cm residual disease)/suboptimal debulking (>1cm residual disease)). A proportional hazards regression model adjusted for age and stratified by protocol and treatment arm, stage, performance status, and race was used to compare the hazard of progression free survival (PFS) by histology (clear cell vs serous); the same model was used for overall survival. Patients with missing strata variables were excluded from the model; numbers excluded are noted for the specific analyses (see below). Results of significance test were considered statistically significant if p <0.05 (two-sided). Tests of the proportional hazards assumption were done using interactions of histology (clear cell, serous) and log(time). If non-proportional hazards were found, the method of fractional polynomials was used to fit an appropriate function of time.13 For stage III, the function for PFS was time−0.5 and for OS was time−0.5+log(time); and for stage IV, log(time) was used for both PFS and OS.
RESULTS
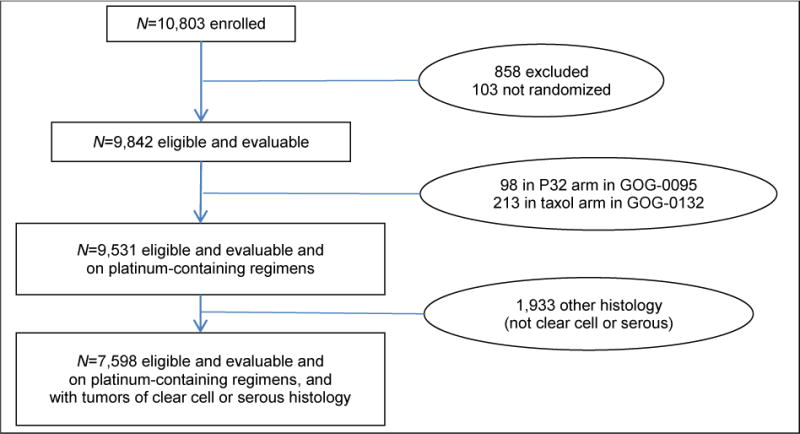
The flowchart of patient exclusions is presented in Figure 1. There were 10,803 patients enrolled in the twelve GOG trials. Table 1 provides the treatment arms of each protocol and the number of patients of each histologic subtype prior to exclusions. Of the 10,803 total patients considered, 858 were not eligible or evaluable and 103 were not randomized, leaving 9,842 patients. An additional 311 patients were excluded for absence of platinum in their adjuvant therapy: 98 in GOG 0095 who received intraperitoneal (IP) P32 and 213 in GOG 0132 who received single-agent paclitaxel. The remaining 9,531 patients were randomized to platinum-containing regimens, of which 544 (6%) had OCCC, 7,054 (74%) had SOC, and 1,933 (20%) had other tumor types [data not shown]. Central pathology review was performed on all patients included at the time of original protocol participation, and only the OCCC and SOC patients were considered in this analysis, for a total of 7,598 patients. While the prevalence of clear cell tumors was higher in the Japanese patients (30% [21/71]) than in US patients (6% [515/9216]), the number of Japanese clear cell patients was so small that comparison of US and Japanese OCCC was not feasible [data not shown].
Figure 1.
Flowchart of Patient Exclusions
Statistically significant relationships between histology and baseline characteristics were seen for age, race, performance status, stage, optimal/suboptimal debulking, and grade (Table 2). Clear cell patients were significantly younger than serous patients and were more commonly of Asian race. Patients with OCCC more often presented with early stage disease, had better performance status, and more often had optimal cytoreduction when compared to the patients with SOC. Of note, debulking status was assessed only in the 61% (2,961/7,598) of patients who presented with advanced stage (III–IV) disease. Thus, debulking status was more frequently assessed in patients with SOC than in patients with OCCC. All of these factors (except race) point to a potentially better prognosis for clear cell patients than for serous patients.
Table 2.
Baseline Characteristics by Cell Type – All Clear Cell and Serous Patients on Platinum-Containing Regimens Treated (N=7,598)
| Histology | ||||
|---|---|---|---|---|
| N | Clear Cell n (%)† | Serous n (%)† | p-value | |
| Total | 7598 | 544 (7%) | 7054 (93%) | |
| Age (y) | ||||
| <30 | 58 | 2 (0%) | 56 (1%) | <.001 |
| 30–39 | 282 | 35 (6%) | 247 (4%) | |
| 40–49 | 1374 | 140 (26%) | 1234 (17%) | |
| 50–59 | 2347 | 196 (36%) | 2151 (30%) | |
| 60–69 | 2280 | 121 (22%) | 2159 (31%) | |
| >=70 | 1257 | 50 (9%) | 1207 (17%) | |
| Race | ||||
| Asian | 240 | 43 (8%) | 197 (3%) | <.001 |
| Black | 351 | 7 (1%) | 344 (5%) | |
| Other | 202 | 16 (3%) | 186 (3%) | |
| White | 6805 | 478 (88%) | 6327 (90%) | |
| Stage | ||||
| [missing] | 7 | 0 | 7 | |
| I | 355 | 226 (42%) | 129 (2%) | <.001 |
| II | 143 | 43 (8%) | 100 (1%) | |
| III | 5808 | 230 (42%) | 5578 (79%) | |
| IV | 1285 | 45 (8%) | 1240 (18%) | |
| Performance Status | ||||
| [missing] | 62 | 2 | 60 | |
| 0 | 3442 | 290 (54%) | 3152 (45%) | <.001 |
| 1 | 3497 | 229 (42%) | 3268 (47%) | |
| 2 | 593 | 22 (4%) | 571 (8%) | |
| 3 | 4 | 1 (0%) | 3 (0%) | |
| Debulking§ | ||||
| [missing] | 2961 | 355 | 2606 | |
| Optimal | 3413 | 151 (80%) | 3262 (73%) | 0.045 |
| Suboptim al | 1224 | 38 (20%) | 1186 (27%) | |
| Grade | ||||
| [missing] | 329 | 296 | 33 | |
| 1 | 511 | 5 (2%) | 506 (7%) | <.001 |
| 2 | 2394 | 30 (12%) | 2364 (34%) | |
| 3 | 4364 | 213 (86%) | 4151 (59%) | |
Percentages are column percentages except for the total row, which are row percentages.
p-value is from Pearson chi-square test and excludes missing values.
Debulking was assessed in advanced stage (III–IV) patients not early stage (I–II) patients and thus in only protocols 0111, 0132, 0158, 0172, and 0182.
Prior to any adjustment, clear cell patients had better PFS and OS (Table 3); however, this was due to the preponderance of favorable prognostic factors (stage, age, and performance status) in this cohort. After adjusting for age and stratifying by protocol and treatment arm, stage, performance status, and race, the hazard ratio for PFS was 1.37 (95% CI: 1.20, 1.56; p <0.001) for OCCC versus SOC patients. After adjusting for age and stratified by protocol and treatment arm, stage, performance status, and race, the hazard ratio for overall survival was 1.58 (95% CI: 1.38, 1.82; p <0.001) for OCCC versus SOC patients. Because grade 1 serous tumors are thought to have different clinical pathology and genetic makeup, we did analyses (across all stages) excluding grade 1 tumors; results were nearly identical to the main results.
Table 3.
Hazard Ratios for Clear Cell vs. Serous – Overall and by Stage
| Stage | m/n | HR (95% CI) for Clear Cell vs. Serous†
|
Non-PH pঠ| |
|---|---|---|---|---|
| Unadjusted | Adjusted‡ | |||
| PFS | ||||
| All | 6,842/7,598 | 0.47 (0.42, 0.52) | 1.37 (1.20, 1.56) | — |
| I–II | 164/498 | 0.69 (0.51, 0.94) | 0.69 (0.50, 0.96) | 0.145 |
| III | 5,102/5,808 | 1.26 (1.09, 1.45) | 1.35 (1.16, 1.57) | <0.001 |
| IV | 1,209/1,285 | 2.79 (2.07, 3.76) | 3.27 (2.39, 4.48) | 0.001 |
| Interaction | p§ | <0.001 | <0.001 | |
| Overall Survival | ||||
| All | 5,482/7,598 | 0.56 (0.49, 0.63) | 1.58 (1.38, 1.82) | — |
| I–II | 137/498 | 0.75 (0.54, 1.05) | 0.76 (0.53, 1.09) | 0.140 |
| III | 4,286/5,808 | 1.47 (1.23, 1.66) | 1.54 (1.32, 1.80) | <0.001 |
| IV | 1,053/1,285 | 2.68 (1.98, 3.62) | 3.41 (2.47, 4.70) | 0.001 |
| Interaction | p§ | <0.001 | <0.001 | |
| Excluding Patients with Grade 1 Tumors | ||||
| PFS | 5,482/7,598 | 0.56 (0.49, 0.63) | 1.58 (1.38, 1.82) | — |
| OS | 5,156/7,087 | 0.54 (0.48, 0.61) | 1.54 (1.34, 1.77) | — |
m = number of events. n = sample size (7 patients had missing stage).
Reference group is serous
Adjusted for age and stratified by protocol and treatment arm, performance staus, and race
p-value for test of non-proportional hazards (PH): interaction of histology and log(time)
Stage × Histology interaction p-values
There was a statistically significant (p<0.001) interaction between stage and histology for both PFS and OS indicating differing effects of histology across stage (Table 3). In stage I–II patients, PFS was significantly better in OCCC than in SOC, while OS was numerically but not statistically significantly better (Table 3 and Figure 2), tests of nonproportional hazards were not significant for the stage I and II patients. In stage III and IV patients, OCCC patients were at statistically significantly increased risk of progressing or dying (Table 2 and Figures 3 and 4). However, for both stages, tests of nonproportional hazards were statistically significant (p≤0.001). For stage III patients, the PFS hazard and OS hazard are dramatically higher for OCCC patients than for SOC patients but this effect lessens and even reverses itself after 2–3 years (Figure 3). In stage IV patients, a similar pattern exists; however, it is not as dramatic as for stage III, and for OS, does not actually reverse directions (Figure 4).
Figure 2.

PFS and OS in Patients with Stage I–II Tumors
Figure 3.

PFS and OS for Time-varying Hazards Ratios in Patients with Stage III Tumors
Figure 4.

PFS and OS for Time-varying Hazards Ratios in Patients with Stage IV Tumors
In two protocols (0157 and 0175), there were sufficient numbers of both clear cell and serous patients in order to examine the treatment effect by cell type. GOG 0157 was a randomized phase III trial comparing three cycles of every three weeks carboplatin (AUC 7.5) and paclitaxel (175mg/m2) on day 1 to six courses of the same regimen in stage I and II ovarian carcinomas. GOG 0175 was a randomized phase III trial of carboplatin (AUC 6) and paclitaxel (175mg/m2) every three weeks for 3 cycles followed by weekly paclitaxel (40mg/m2/week) versus observation in patients with early stage ovarian carcinoma. A proportional hazards model adjusted for age, and stratified by performance status, race, and stage comparing 6 cycles of adjuvant q21 day carboplatin/paclitaxel to 3 cycles of the same for GOG 0157 revealed statistically significantly (p=0.048) greater treatment effect on PFS for early stage SOC (HR: 0.42, 95% CI: 0.18, 0.99) when compared with the effect for early stage OCCC (HR: 1.32, 95% CI: 0.62, 2.82) (Table 4). Results for OS in 0157 and for PFS and OS in 0175 were similar to those for PFS in 0157 although the interaction was not statistically significant.
Table 4.
Treatment Effect in Clear Cell and Serous Patients – Protocols 0157 and 0175
| Comparison (latter group is referent) | Cell Type | Stage 1/2 (%) | HR (95% CI) | Interaction p |
|---|---|---|---|---|
| PFS | ||||
| 0157: Taxol carbo followed by: Weekly Taxol vs. Observation‡ |
Clear Cell Serous |
81/19 | 1.32 (0.62, 2.82) 0.42 (0.18, 0.99) |
0.048 |
| 47/53 | ||||
| 0175: Carbo + Taxol × 6 vs. Carbo + Taxol × 3¶ | Clear Cell Serous |
82/18 | 1.00 (0.52, 1.91) 0.56 (0.31, 1.00) |
0.20 |
| 61/39 | ||||
| Survival | ||||
| 0157: Taxol carbo followed by: Weekly Taxol vs. Observation‡ |
Clear Cell Serous |
89/11 | 1.10 (0.50, 2.43) 0.54 (0.22, 1.31) |
0.236 |
| 54/46 | ||||
| 0175: Carbo + Taxol × 6 vs. Carbo + Taxol × 3¶ | Clear Cell Serous |
86/14 | 1.37 (0.67, 2.80) 0.57 (0.28, 1.14) |
0.086 |
| 64/36 |
Proportional hazards model adjusted for age, and stratified by performance status, race, and stage.
n=2 observations deleted due to missing strata values.
n=2 observations deleted due to missing strata values.
DISCUSSION
This study represents one of the largest analyses in the literature in which patients with OCCC were treated in a uniform manner under cooperative group studies. Early stage OCCC has been generally regarded as grade 3 tumor, however, OCCC often has been shown to display a comparatively chemoresistant phenotype,5,8,14,15 and the actual effect of adjuvant chemotherapy remains unclear. Clear cell histology has been found to be a significant predictor for impaired chemotherapy response in both univariate and multivariate analysis.12 Takano et al.14 performed a retrospective evaluation of 219 patients with stage I OCCC. Multivariate analysis revealed that adjuvant chemotherapy was not a prognostic factor (p = 0.80) for survival.14 In another retrospective chart review of 158 patients with advanced and recurrent OCCC, the investigators reported a 73% failure rate with adjuvant and palliative chemotherapies, including platinum-based regimens.15 In the current study, for early stage SOC, the positive effect on PFS of cytotoxic chemotherapy treatment was statistically significantly greater than in early stage OCCC. These results confirm previous findings that OCCC appears to be chemoresistant as previously believed and this resistance is not limited to taxanes and platinum medications14. Another interpretation of the data would say that early stage clear cell is more likely to be controlled with surgery alone and not as likely to have occult metastasis as HGSOC. It also could suggest that early stage OCCC and advanced stage OCCC may have different origins. We realize that including all grades of serous carcinoma could affect analysis given different clinical behavior of low grade serous carcinomas. An analysis omitting grade 1 tumors did not change results.
Recently elucidated molecular and genetic mechanisms distinguishing OCCC from SOC are likely, at least in part, to be responsible for our findings. Yamaguchi et al.16 highlighted derangements in oxidative stress, hypoxia, mitogen-activated protein kinase activity, and cytokine-related pathways for OCCC. Stany et al.17 reported whole genomic expression profiling of laser capture micro dissected OCCC specimens, also identifying activation in hypoxic cell growth, angiogenesis, and glucose metabolism pathways involving HIF-1α and enolase. ARID1A has been found to be mutated in over 50% of ovarian clear cell carcinomas (OCCCs)18. Somatic mutations of PIK3CA (phosphoinositide-3-kinase) have recently been shown playing an important role in the pathogenesis of ovarian clear cell carcinoma19. factor is also a promising therapeutic target for the treatment of clear cell carcinoma of the ovary20. The overexpression of certain types of genes in the clear cell histotype can also provide insights into its disproportionately poor prognosis relative to other subtypes of ovarian cancer. Two genes are also implicated in impaired chemotherapy response: overexpression of ANXA4 has been associated with resistance to both paclitaxel21 and to platinum-based chemotherapy,22 whereas upregulated UGT1A1 increases clearance of the active metabolite of irinotecan.23 TFPI2, with its inhibitory effects on the invasion and growth activity of the tumor cells, may serve to maintain OCCC tumors in earlier stages than their SOC counterparts.24 Increased apoptotic signaling (MAP3K5/ASK1 and GLRX), inhibited cellular proliferation (TFPI2), increased resistance to chemotherapy (ANXA4 and UGT1A1), and insensitivity to hypoxic stress (HIF-1α and HNF-1β) combine to produce early stage, large, indolent, chemotherapy-resistant tumors that may well arise within endometriotic lesions. This disparate hypothesis regarding the origin of OCCC either ovarian or endometriotic could have affected analysis. The histological and genetic alterations in endometriosis seem to explain why endometriosis can be a precursor of some ovarian cancers, especially clear cell and endometrioid carcinomas25. This study is subject to weaknesses inherent in retrospective analyses. The patients were not allocated at random to treatments that differed only by total treatment time. As a result you cannot exclude the existence of factors that may have confounded this analysis. The major strength of this work is the high quality of the data, collected prospectively in multi-institutional cooperative group trials in a large number of patients. In fact, this the largest analysis ever conducted on clear cell ovarian cancer patients.Given the relatively rarity of OCCC, compiling data from prospectively accrued patients in cooperative group trials is imperative in order to better investigate variations in the molecular and genetic underpinnings of the clear cell histologic subtype which confer the survival disadvantages described here. As further investigations better elucidate the molecular and genetic foundations of ovarian carcinogenesis, treatment paradigms can be refined to better address and leverage the differences between various ovarian histologic subtypes. Once such a paradigm is in place, rational drug design can be devoted to the formulation of more diverse and focused targeted therapies. Thus, ovarian cancers can begin to be treated as the heterogeneous group of tumors they represent, an achievement which is paramount to the advancement of truly personalized medicine.
Supplementary Material
HIGHLIGHTS.
In early stage patients, PFS was better for OCCC than for SOC.
In late-stage patients, OCCC was significantly associated with decreased OS.
Treatment effect was influenced by histology.
Acknowledgments
The following National Cancer Institute grants also supported this study: NRG Oncology Operations grant number U10 CA180868 as well as NRG SDMC grant U10 CA180822, Gynecologic Oncology Group (GOG) Administrative Office and the GOG Tissue Bank (CA 27469) and the GOG Statistical and Data Center (CA 37517).
The following Gynecologic Oncology Group member institutions participated in the primary treatment studies: Ohio State University Comprehensive Cancer Center, University of California Medical Center at Irvine, University of Minnesota Medical Center, University of Oklahoma Health Sciences Center, Duke University Medical Center, University of Iowa Hospitals and Clinics, Washington University School of Medicine, Indiana University Hospital/Melvin and Bren Simon Cancer Center, Walter Reed National Military Medical Center, University of North Carolina at Chapel Hill, Fred Hutchinson Cancer Research Center, Abington Memorial Hospital, Abramson Cancer Center of the University of Pennsylvania, Tacoma General Hospital, Mayo Clinical, University of Mississippi Medical Center, Southwest Oncology Group, Moffitt Cancer Center and Research Institute, MD Anderson Cancer Center, Cancer Trials Support Unit, Australia New Zealand Gynaecological, University of Colorado Cancer Center, University of Kentucky, Wake Forest University Health Sciences, Cleveland Clinic Foundation, University of Alabama at Birmingham, Women’s Cancer Center of Nevada, Tufts-New England Medical Center, Gynecologic Oncology Network/Brody School of Medicine, Rush University Medical Center, Cooper Hospital University Medical Center, Gynecologic Oncology Network/Brody School of Medicine, Rush University Medical Center, Cooper Hospital University Medical Center, Stony Brook University Medical Center, Penn State4 Milton S Hershey Medical Center, University of Massachusetts Memorial Health Care, University of California at Los Angeles Health System, University of Cincinnati, Fox Chase Cancer Center, Thomas Jefferson University Hospital, University of Texas Southwestern Medical Center, Case Western Reserve University, Roswell Park Cancer Institute, Wayne State University/Karmanos Cancer Institute, University of Chicago, North Shore University Hospital, Community Clinical Oncology Program, Yale University, Saitama Medical University International Medical Center, University of Virginia, Johns Hopkins Oncology Center, Eastern Pennsylvania GYN/ONC Center, P.C., Oregon Health Sciences University, Metro-Minnesota CCOP, Albany Medical College, State University of New York, Downstate Medical Center, Medical University of South Carolina, University of Wisconsin Hospital and Clinics, University of Rochester Medical Center, Georgetown University Hospital, Ellis Fischel Cancer Center, Memorial Sloan Kettering Cancer Center, Seoul National University Hospital, University of Pittsburgh Cancer Institute, Fletcher Allen Health Care, Cancer Research for the Ozarks NCORP, University of Miami School of Medicine, Women and Infants Hospital, Northwestern University, Emory University Clinic, University of Hawaii, The Hospital of Central Connecticut, Mount Sinai School of Medicine, University of Southern California, University of Texas – Galveston, University of New Mexico, Northern Indiana Cancer Research Consortium, Stanford University Medical Center, Eastern Virginia Medical School, University of Arizona, Michigan Cancer Research Consortium Community Clinical Oncology Program, Saint Vincent Hospital, Cancer Research Consortium of West Michigan NCORP, Georgia Center for Oncology Research and Education (CORE), Missouri Valley Cancer Consortium CCOP, ECOG Statistical Center, Long Island Jewish Medical Center, Scott and White Memorial Hospital, Wisconsin NCI Community Oncology Research Program, Carle Cancer Center, Gynecologic Oncology of West Michigan PLLC, Central Illinois CCOP, Delaware/Christiana Care CCOP, Virginia Commonwealth University, Kalamazoo CCOP, State University of New York/Syracuse, University of Toronto/Sunnybrook Regional Cancer Centre, Kansas City CCOP, Southeast Gynecologic Oncology Associates, Northern New Jersey CCOP, New York University Medical Center, University of Illinois, Evanston CCOP-NorthShore University Health System, Western Regional CCOP, William Beaumont Hospital, Colorado Cancer Research Program NCORP, Saint Louis-Cape Girardeau CCOP, Aurora Women’s Pavilion of Aurora West Allis Medical Center, Geisinger Medical Center, Virginia Mason CCOP, North Central Cancer Treatment Group, Drexel University College of Medicine, Columbia River Oncology Program, Upstate Carolina CCOP, Dayton Clinical Oncology Program, Mainline Health CCOP and Wichita CCOP.
Footnotes
Publisher's Disclaimer: This is a PDF file of an unedited manuscript that has been accepted for publication. As a service to our customers we are providing this early version of the manuscript. The manuscript will undergo copyediting, typesetting, and review of the resulting proof before it is published in its final citable form. Please note that during the production process errors may be discovered which could affect the content, and all legal disclaimers that apply to the journal pertain.
The views expressed in this article are those of the authors and do not necessarily reflect the official policy or opinion of the Department of Defense the United States Army or Navy, or the United States Government.
CONFLICTS OF INTEREST
Dr. Robert Mannel wishes to disclose that he has received personal fees from AstraZeneca, Medimmune, Oxigene, Endocyte, Bayer, Clovis and Tesaro outside of the submitted work. Additionally, Dr. Angeles Secord reports grants from AstraZeneca, Elsai, Bristol Myers Squibb, Incyte, Amgen, Genentech, Endocyte, Exelixis, Boerhinger Ingelheim, Astex Pharmaceuticals Inc, Prima Biomed, Abbie-Vie, Astellas Pharma Inc, Tesaro, other from Janssen, Clovis, Genentech, AstraZeneca, Astex, Tesaro, Alexion, outside the submitted work. Finally, Michael Bookman reports grants from AstraZeneca, during the conduct of the study; personal fees from McKesson Specialty Health and USOR, personal fees from Genentech-Roche, personal fees from Mateon, personal fees from AstraZeneca, personal fees from AbbVie, personal fees from Tesaro, personal fees from Endocyte, personal fees from Clovis, personal fees from Pfizer, outside the submitted work. All other authors have nothing to report.
References
- 1.Lee KR, Tavassolli FA, Prat J, et al. Surface epithelial stromal tumors. In: Tavassoli FA, Devilee P, editors. World Health Organization Classification of Tumours. Pathology and Genetics of Tumours of the Breast and Female Genital Organs. Lyon: IARC Press; 2003. pp. 117–145. [Google Scholar]
- 2.Kobel M, Kalloger SE, Huntsman DG, et al. Differences in tumor type in low-stage versus high-stage ovarian carcinomas. Int J Gynecol Pathol. 2010;29:203–211. doi: 10.1097/PGP.0b013e3181c042b6. [DOI] [PubMed] [Google Scholar]
- 3.Yahata T, Banzai C, Tanaka K. Histology-specific long-term trends in the incidence of ovarian cancer and borderline tumor in Japanese females: a population-based study from 1983 to 2007 in Niigata. J Obstet Gynaecol Res. 2012;38:645–650. doi: 10.1111/j.1447-0756.2011.01755.x. [DOI] [PubMed] [Google Scholar]
- 4.Vasey PA, Jayson GC, Gordon A, et al. Phase III randomized trial of docetaxel-carboplatin versus paclitaxel-carboplatin as first-line chemotherapy for ovarian carcinoma. J Natl Cancer Inst. 2004;96:1682–1691. doi: 10.1093/jnci/djh323. [DOI] [PubMed] [Google Scholar]
- 5.Sugiyama T, Kamura T, Kigawa J, et al. Clinical characteristics of clear cell carcinoma of the ovary: a distinct histologic type with poor prognosis and resistance to platinum-based chemotherapy. Cancer. 2000;88:2584–2589. [PubMed] [Google Scholar]
- 6.Chan JK, Teoh D, Hu JM, et al. Do clear cell ovarian carcinomas have poorer prognosis compared to other epithelial cell types? A study of 1411 clear cell ovarian cancers. Gynecol Oncol. 2008;109:370–376. doi: 10.1016/j.ygyno.2008.02.006. [DOI] [PubMed] [Google Scholar]
- 7.Omura GA, Brady MF, Homesley HD, et al. Long-term follow-up and prognostic factor analysis in advanced ovarian carcinoma: the Gynecologic Oncology Group experience. J Clin Oncol. 1991;9:1138–1150. doi: 10.1200/JCO.1991.9.7.1138. [DOI] [PubMed] [Google Scholar]
- 8.Goff BA, Sainz de la Cuesta R, Muntz HG, et al. Clear cell carcinoma of the ovary: a distinct histologic type with poor prognosis and resistance to platinum-based chemotherapy in stage III disease. Gynecol Oncol. 1996;60:412–417. doi: 10.1006/gyno.1996.0065. [DOI] [PubMed] [Google Scholar]
- 9.Winter WE, 3rd, Maxwell GL, Tian C, et al. Prognostic factors for stage III epithelial ovarian cancer: a Gynecologic Oncology Group Study. J Clin Oncol. 2007;25:3621–3627. doi: 10.1200/JCO.2006.10.2517. [DOI] [PubMed] [Google Scholar]
- 10.Duska LR, Garrett L, Henretta M, et al. When ‘never-events’ occur despite adherence to clinical guidelines: the case of venous thromboembolism in clear cell cancer of the ovary compared with other epithelial histologic subtypes. Gynecol Oncol. 2010;116:374–377. doi: 10.1016/j.ygyno.2009.10.069. [DOI] [PubMed] [Google Scholar]
- 11.Bamias A, Psaltopoulou T, Sotiropoulou M, et al. Mucinous but not clear cell histology is associated with inferior survival in patients with advanced stage ovarian carcinoma treated with platinum-paclitaxel chemotherapy. Cancer. 2010;116:1462–1468. doi: 10.1002/cncr.24915. [DOI] [PubMed] [Google Scholar]
- 12.Pectasides D, Fountzilas G, Aravantinos G, et al. Advanced stage clear-cell epithelial ovarian cancer: the Hellenic Cooperative Oncology Group experience. Gynecol Oncol. 2006;102:285–291. doi: 10.1016/j.ygyno.2005.12.038. [DOI] [PubMed] [Google Scholar]
- 13.Sauerbrei W, Royston P, Look M. A new proposal for multivariable modelling of time-varying effects in survival data based on fractional polynomial time-transformation. Biom J. 2007;49:453–473. doi: 10.1002/bimj.200610328. [DOI] [PubMed] [Google Scholar]
- 14.Takano M, Sugiyama T, Yaegashi N, et al. Less impact of adjuvant chemotherapy for stage I clear cell carcinoma of the ovary: a retrospective Japan Clear Cell Carcinoma Study. Int J Gynecol Cancer. 2010;20:1506–1510. doi: 10.1111/IGC.0b013e3181fcd089. [DOI] [PubMed] [Google Scholar]
- 15.Al-Barrak J, Santos JL, Tinker A, et al. Exploring palliative treatment outcomes in women with advanced or recurrent ovarian clear cell carcinoma. Gynecol Oncol. 2011;122:107–110. doi: 10.1016/j.ygyno.2011.03.011. [DOI] [PubMed] [Google Scholar]
- 16.Yamaguchi K, Mandai M, Oura T, et al. Identification of an ovarian clear cell carcinoma gene signature that reflects inherent disease biology and the carcinogenic processes. Oncogene. 2010;29:1741–1752. doi: 10.1038/onc.2009.470. [DOI] [PubMed] [Google Scholar]
- 17.Stany MP, Vathipadiekal V, Ozbun L, et al. Identification of novel therapeutic targets in microdissected clear cell ovarian cancers. PLoS One. 2011;6:e21121. doi: 10.1371/journal.pone.0021121. [DOI] [PMC free article] [PubMed] [Google Scholar]
- 18.Bitler BG, Aird KM, Zhang R. Epigenetic synthetic lethality in ovarian clear cell carcinoma: EZH2 and ARID1A mutations. Mol Cell Oncol. 2016;3:e1032476. doi: 10.1080/23723556.2015.1032476. [DOI] [PMC free article] [PubMed] [Google Scholar]
- 19.Rahman M, Nakayama K, Rahman MT, et al. Clinicopathologic and biological analysis of PIK3CA mutation in ovarian clear cell carcinoma. Hum Pathol. 2012;43:2197–2206. doi: 10.1016/j.humpath.2012.03.011. [DOI] [PubMed] [Google Scholar]
- 20.Mabuchi S, Kawase C, Altomare DA, et al. Vascular endothelial growth factor is a promising therapeutic target for the treatment of clear cell carcinoma of the ovary. Mol Cancer Ther. 2010;9:2411–2422. doi: 10.1158/1535-7163.MCT-10-0169. [DOI] [PMC free article] [PubMed] [Google Scholar]
- 21.Han EK, Tahir SK, Cherian SP, et al. Modulation of paclitaxel resistance by annexin IV in human cancer cell lines. Br J Cancer. 2000;83:83–88. doi: 10.1054/bjoc.2000.1311. [DOI] [PMC free article] [PubMed] [Google Scholar]
- 22.Choi CH, Sung CO, Kim HJ, et al. Overexpression of annexin A4 is associated with chemoresistance in papillary serous adenocarcinoma of the ovary. Hum Pathol. 2013;44:1017–1023. doi: 10.1016/j.humpath.2012.08.024. [DOI] [PubMed] [Google Scholar]
- 23.Schulz C, Boeck S, Heinemann V, et al. UGT1A1 genotyping: a predictor of irinotecan-associated side effects and drug efficacy? Anticancer Drugs. 2009;20:867–879. doi: 10.1097/CAD.0b013e328330c7d2. [DOI] [PubMed] [Google Scholar]
- 24.Arakawa N, Miyagi E, Nomura A, et al. Secretome-based identification of TFPI2, a novel serum biomarker for detection of ovarian clear cell adenocarcinoma. J Proteome Res. 2013;14:4340–4350. doi: 10.1021/pr400282j. [DOI] [PubMed] [Google Scholar]
- 25.Munksgaard P, Blaakaer J. The association between endometriosis and ovarian cancer: a review of histological, genetic and molecular alterations. Gynecol Oncol. 2012 Jan;124(1):164–9. doi: 10.1016/j.ygyno.2011.10.001. [DOI] [PubMed] [Google Scholar]
Associated Data
This section collects any data citations, data availability statements, or supplementary materials included in this article.