

Summary
Verticillium wilt (VW), caused by infection by Verticillium dahliae, is considered one of the most yield‐limiting diseases in cotton. To examine the genetic architecture of cotton VW resistance, we performed a genome‐wide association study (GWAS) using a panel of 299 accessions and 85 630 single nucleotide polymorphisms (SNPs) detected using the specific‐locus amplified fragment sequencing (SLAF‐seq) approach. Trait–SNP association analysis detected a total of 17 significant SNPs at P < 1.17 × 10⁻⁵ (P = 1/85 630, –log10 P = 4.93); the peaks of SNPs associated with VW resistance on A10 were continuous and common in three environments (RDIG2015, RDIF2015 and RDIF2016). Haplotype block structure analysis predicted 22 candidate genes for VW resistance based on A10_99672586 with a minimum P‐value (–log10 P = 6.21). One of these genes (CG02) was near the significant SNP A10_99672586 (0.26 Mb), located in a 372‐kb haplotype block, and its Arabidopsis AT3G25510 homologues contain TIR‐NBS‐LRR domains that may be involved in disease resistance response. Real‐time quantitative PCR and virus‐induced gene silencing (VIGS) analysis showed that CG02 was specific to up‐regulation in the resistant (R) genotype Zhongzhimian2 (ZZM2) and that silenced plants were more susceptible to V. dahliae. These results indicate that CG02 is likely the candidate gene for resistance against V. dahliae in cotton. The identified locus or gene may serve as a promising target for genetic engineering and selection for improving resistance to VW in cotton.
Keywords: cotton, Verticillium wilt, genome‐wide association, candidate gene, virus‐induced gene silencing (VIGS)
Introduction
Verticillium wilt (VW) is caused by the soil‐borne fungus Verticillium dahliae, which has a broad host range of over 400 plant species, including economically important cotton, and can survive in soil for many years (Zhang et al., 2016a). VW was first reported in Virginia, USA, in 1914 and is found in almost all cotton‐growing areas worldwide. Infected plants typically exhibit symptoms including vascular discoloration, leaf chlorosis, curling or necrosis, followed by defoliation and eventually wilt and plant death as the disease progresses (Bell and Hillocks, 1992; Li et al., 2016). VW is a notorious and devastating disease that results in major losses in the yield and quality of cotton (Cai et al., 2009; Xu et al., 2011); it has been considered one of the most important fungal diseases, inspiring considerable research to develop control measures.
Developing resistant cultivars is an effective and economic approach to controlling wilt disease. Most commercial cultivars are susceptible or only slightly resistant to VW, and cotton breeders mainly rely on sources with partial resistance for cultivar improvement (Wang et al., 2008). Thus, to improve VW resistance, cotton breeders must conduct introgression and gene pyramiding from different VW‐resistant sources using marker‐assisted selection (MAS) (Zhao et al., 2014). The development and utilization of molecular markers in quantitative trait locus (QTL) mapping provides further information about the genetics of VW resistance in cotton. With the assistance of markers tightly linked to VW resistance, it is possible to transfer resistant genes to develop cultivars with high resistance to VW (Wang et al., 2008). To date, more than 100 QTLs conferring VW resistance have been mapped on 22 chromosomes of tetraploid cotton, with the exception of chromosomes 6, 10, 12 and 18, from interspecific populations of Gossypium hirsutum × G. barbadense (Bolek et al., 2005; Du et al., 2004; Fang et al., 2013; Yang et al., 2008; Zhen et al., 2006) and from G. hirsutum intraspecific populations (Jiang et al., 2009; Ning et al., 2013; Wang et al., 2007; Yang et al., 2007) evaluated at different growing stages with different V. dahliae isolates. However, genetic loci and molecular markers have not been used effectively in MAS to breed resistant varieties due to limited allelic segregation between the two parents and because fewer recombination events occur in biparental populations.
Genome‐wide association study (GWAS), based on linkage disequilibrium (LD), has emerged as a powerful tool for gene mapping in plants, to take advantage of phenotypic variation and historical recombination in natural populations and overcome the limitations of biparental populations, resulting in higher QTL mapping resolution (Nordborg and Weigel, 2008; Weng et al., 2011; Zhu et al., 2008). Next‐generation sequencing technologies including genotyping by sequencing (GBS), restriction site‐associated DNA sequencing (RAD‐seq) and specific‐locus amplified fragment sequencing (SLAF‐seq) have been applied for the high‐throughput discovery of high‐quality SNPs for GWAS (Chen et al., 2015b; Su et al., 2016; Zhao et al., 2015b). GWAS has been employed in the breeding of many major crops, such as maize, soya bean, barley, wheat, sorghum and potato, to identify genes responsible for the quantitative variation in complex traits (Breseghello and Sorrells, 2006; Casa et al., 2008; Hao et al., 2012; Kraakman et al., 2006; Malosetti et al., 2007; Thornsberry et al., 2001). In cotton, GWAS has been performed with respect to yield (Mei et al., 2013; Zhang et al., 2013) and fibre quality traits (Abdurakhmonov et al., 2008; Cai et al., 2014; Kantartzi and Stewart, 2008; Zeng et al., 2009). A recent GWAS using elite cotton accessions identified molecular markers related to VW resistance, indicating the advantages of GWAS in determining the genetic basis of complex traits in cotton (Zhao et al., 2014).
However, few studies have identified the candidate genes underlying VW resistance by GWAS. The tomato Ve1 and Ve2 encoding leucine‐rich repeat class of receptor‐like proteins are the only cloned genes that are responsible for VW resistance (Kawchuk et al., 2001). Both genes confer resistance when expressed in potato, while only Ve1 provides resistance in both tomato (Fradin et al., 2009) and Arabidopsis (Fradin et al., 2011). In cotton, the transcriptomes and proteomes of VW resistance responses have been analysed, and several genes that contribute to the defence response against VW have been reported, including GbTLP1 (Munis et al., 2010), GbVe1 (Zhang et al., 2012), GbCAD1/GbSSI2 (Gao et al., 2013), GbRLK (Zhao et al., 2015a) and Hcm1 (Zhang et al., 2016b). Expression of Arabidopsis NPR1 (Parkhi et al., 2010), Hpa1 Xoo (Miao et al., 2010) and Nicotiana alata NaD1 (Gaspar et al., 2014) in cotton is reported to confer significant resistance to VW.
In this study, we performed a GWAS for VW resistance in the stem of 299 upland cotton accessions genotyped using SLAF‐seq and identified significant associated single nucleotide polymorphism (SNP) loci and potential candidate genes to be verified by virus‐induced gene silencing (VIGS). Our objectives were to supply marker candidates for MAS, identify candidate genes involved in VW resistance and provide insight into the genetic mechanisms of resistance to VW in cotton.
Results
Phenotypic characteristics of VW resistance in natural populations
The association panel used in this study consisted of 299 cotton accessions, which were classified into five major groups according to their regional distribution: Yellow River region (YR), Yangtze River region (YZR), Northwest inland region (NW), Liaoning Province (LN) and Foreign group (FG) (Table S1). We evaluated resistance to VW in the 299 accessions in a glasshouse (RDIG2015) and in a field screening nursery in 2015 (RDIF2015) and 2016 (RDIF2016), with three replicates per environment. Extensive phenotypic variation was observed in the disease index (DI), which was calculated and adjusted to a relative disease index (RDI) with a correction factor K. The RDI of all lines ranged from 3.89 to 93.33, with an average of 42.29 in RDIG2015, from 2.72 to 76.67, with an average of 32.10 in RDIF2015, and from 13.06 to 100.00, with an average of 45.31 in RDIF2016 (Table 1). An analysis of variance (ANOVA) of the RDI in three environments revealed significant differences among the genotypes (F = 8.26, P < 0.0001) (Table S2).
Table 1.
Phenotypic variation in cotton
| Environment | Mean | SD | Min | Max | CV(%) |
|---|---|---|---|---|---|
| RDIG2015 | 42.29 | 21.33 | 3.89 | 93.33 | 50.44 |
| RDIF2015 | 32.10 | 17.15 | 2.72 | 76.67 | 53.43 |
| RDIF2016 | 45.31 | 19.87 | 13.06 | 100.00 | 43.85 |
SD, standard deviation; CV(%), coefficient of variation.
SNP‐based genotyping of the cotton accessions
To finely map the VW resistance genes and investigate beneficial haplotypes in the cotton germplasm, we constructed a haplotype map for the 299 cotton accessions using SLAF‐seq approach. Over 1297 million reads (125 bp each) were generated for the 299 genotypes, encompassing 324.19 Gb of the cotton genomic DNA sequence. Approximately 649 625 high‐quality tags (or SLAFs) were identified from 1297 million paired‐end reads after sequence alignment with the TM‐1 reference genome. The SLAFs used to call SNPs had an average depth of 5.97‐fold per individual among 299 accessions. In total, 884 799 SNPs were initially called for this set of lines; a proportion of these were found to have a minor allele frequency (MAF) of <5%, leaving 85 630 SNPs at MAF ≥ 0.05 and missing rate ≤50% to be used for analysis. The mean genomic distance between SNP tags was approximately 29.2 kb. The data set of 85 630 SNP markers covered all 26 chromosomes. The largest number of SNPs was found on chromosome A08 (8764 SNPs) followed by chromosome A06 (6295 SNPs), and the smallest number of SNPs was found on chromosomes D03 (970 SNPs) and D04 (879 SNPs) (Table S3). The number of SNPs on each chromosome was consistent with the physical length of the chromosome.
Population structure and linkage disequilibrium
A principal component analysis (PCA) was performed using 85 630 SNPs of the 299 accessions in the genome‐wide mapping panel to estimate the influence of population structure on the mapping results. Principal component 1 (PC1) explained 12.05% of the variation in the genotypic data, while PC2 and PC3 explained 8.12% and 3.01% of the variation, respectively. Based on the first three axes of the PCA, the testing accessions were divided into two groups designated Group I (mainly form YZR) and Group II (mainly from YR and NW) (Figure 1a, b). Using the same SNP set, a neighbour‐joining analysis was performed to understand the genetic diversity of our association panel and classified the population into two groups (Figure 1c), which was consistent with the results of PCA. In this study, the first three PCs were added to the compressed mixed linear model (CMLM) for association analysis.
Figure 1.

Population structure of the cotton association panel. (a, b) Scatter plots of the first three principal components (PC1, PC2 and PC3) of the panel with colour‐coded groups. Each dot represents an accession; (c) neighbour‐joining tree of 299 cotton accessions in the panel; (d) linkage disequilibrium (LD) decay rate of all cotton accessions and of the two groups (Group I and Group II). The mean LD decay rate was estimated as r 2, using all pairs of single nucleotide polymorphisms (SNPs) located within 1 Mb of physical distance in 299 cotton germplasm accessions.
We estimated the LD (indicated by r 2) decay rate for the entire genome to determine the mapping resolution of the GWAS. The r 2 was approximately 0.47, where the mean LD decay of our population was 1.0 Mb. Due to variation among different populations, LD decay rates were estimated separately for each of the two groups and revealed that the LD decay distance in Group I was higher than that in Group II (Figure 1d). Given that the marker density was 29.2 kb per SNP, the SNP set was sufficiently dense to capture the genetic variation in the association panel.
Genome‐wide association analysis
We performed trait–SNP association analysis for the three environments (RDIG2015, RDIF2015 and RDIF2016) with the CMLM, and which accounts for both population structure and familial relatedness. The quantile–quantile plots showed that the model of the three environments could be used to identify association signals (Figure 2b, d, f). A total of 3, 3 and 11 significant SNPs were detected at P < 1.17 × 10⁻⁵ (P = 1/85 630, –log10 P = 4.93) in RDIG2015, RDIF2015 and RDIF2016, respectively (Table 2). Manhattan plots of association analysis showed three peaks (A04, A10 and D10) in RDIG2015, three peaks (A03, A04 and A10) in RDIF2015 and two peaks (A04 and A10) in RDIF2016 (Figure 2a, c, e). Further investigation showed that the A10 peaks were continuous and common to all three environments. Five SNPs (A10_98859056, A10_99071882, A10_99071906, A10_99110423 and A10_99240983) were identified in all three environments among the SNPs at –log10 P > 4.5 on A10 (Table S4). The first peak, SNP A10_99071906 (P = 1.13 × 10⁻⁵, –log10 P = 4.95), was identified in RDIG2015, then A10_98859056 (P = 5.41 × 10⁻⁶, –log10 P = 5.27) in RDIF2015 and A10_99672586 (P = 6.14 × 10⁻⁷, –log10 P = 6.21) in RDIF2016, which are located in a genomic region with a distance of 0.81 Mb (Table 2).
Figure 2.
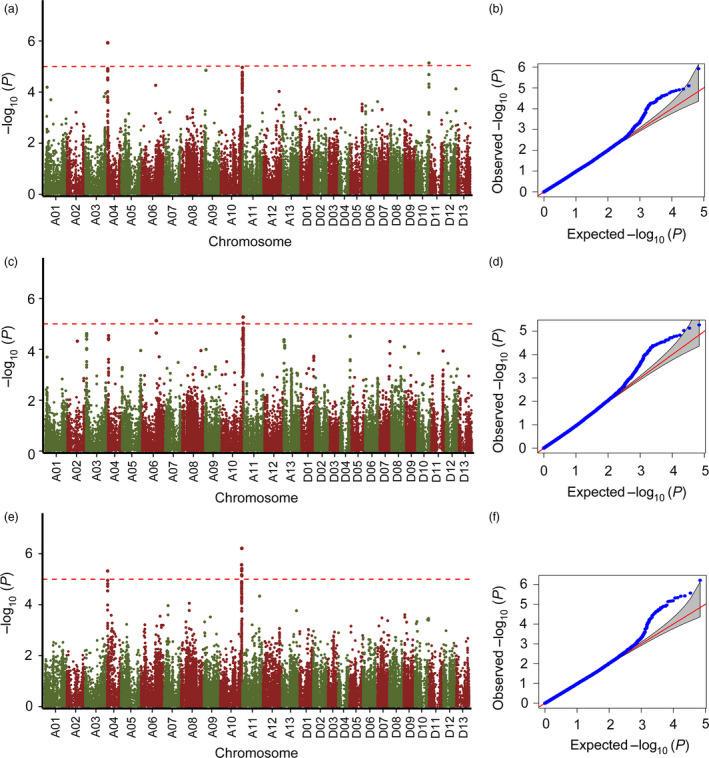
Manhattan and quantile–quantile plots resulting from the GWAS for Verticillium wilt (VW) resistance in cotton. (a, c, e) Manhattan plots for VW resistance in (a) RDIG2015, (c) RDIF2015 and (e) RDIF2016. The x‐axis shows the single nucleotide polymorphism (SNPs) along each chromosome; the y‐axis is the –log10 P for the association. The dashed horizontal line indicates the Bonferroni‐adjusted significance threshold (–log10 P = 4.93); (b, d, f) quantile–quantile plots for VW resistance in (b) RDIG2015, (d) RDIF2015 and (f) RDIF2016.
Table 2.
SNPs associated with VW resistance
| SNP | Position | SNP Allele | MAF | RDIG2015 | RDIF2015 | RDIF2016 | |||
|---|---|---|---|---|---|---|---|---|---|
| −log10(P) | R 2 (%) | −log10(P) | R 2 (%) | −log10(P) | R 2 (%) | ||||
| A04_2334165 | 2334165 | C/A | 0.34 | 5.92 | 7.52 | ||||
| A04_3445154 | 3445154 | A/G | 0.07 | 4.95 | 4.53 | ||||
| A04_3516941 | 3516941 | A/G | 0.07 | 5.32 | 4.93 | ||||
| A06_65034874 | 65034874 | A/G | 0.25 | 5.13 | 6.37 | ||||
| A10_98700922 | 98700922 | G/A | 0.14 | 5.57 | 5.19 | ||||
| A10_98859056 | 98859056 | G/A | 0.14 | 5.27 | 6.57 | ||||
| A10_99071882 | 99071882 | A/C | 0.13 | 5.18 | 4.77 | ||||
| A10_99071906 | 99071906 | A/C | 0.14 | 4.95 | 6.1 | 5.33 | 4.94 | ||
| A10_99110423 | 99110423 | T/C | 0.14 | 5.03 | 6.22 | 5.16 | 4.75 | ||
| A10_99672524 | 99672524 | T/C | 0.17 | 5.13 | 4.72 | ||||
| A10_99672553 | 99672553 | A/G | 0.17 | 5.42 | 5.03 | ||||
| A10_99672585 | 99672585 | G/A | 0.17 | 5.41 | 5.02 | ||||
| A10_99672586 | 99672586 | C/T | 0.17 | 6.21 | 5.89 | ||||
| A10_99672605 | 99672605 | G/A | 0.17 | 5.17 | 4.76 | ||||
| D10_60486237 | 60486237 | C/T | 0.24 | 5.1 | 6.33 | ||||
SNP allele, major and minor alleles; MAF, minor allele frequency; R 2 (%), percentage of phenotypic variation.
To further confirm these significant SNPs associated with VW, we compared our GWAS results with those of previous linkage studies. Three significant SNPs (A04_2334165, A04_3445154 and A04_3516941) on A04 were mapped to regions where VW resistance QTL (qVWR‐08‐c4‐1) had been previously reported (Zhang et al., 2015a), adding support to our findings (Figure S1a). Although previously reported VW resistance QTLs were not found on A10, the region of SNPs identified on A10 was enriched with resistance gene analogues (RGAs) that exhibited clusters using bioinformatics methods (Figure S2) (Holub, 2001). Thus, the significant SNPs that we identified on A10 were novel, and we assigned it for further analysis.
Identification of favourable SNP alleles associated with VW resistance
To understand the effects of allelic variation on VW resistance, we selected three significant SNPs (A10_99672586, A10_98859056 and A10_99071906) on A10 as identified favourable alleles. These SNPs exhibited the minimum P‐values (−log10 P = 6.21, 5.27 and 4.95, respectively), and the R 2 were 5.89%, 6.57% and 6.1%, respectively, explaining the most phenotypic variation among the significantly associated SNPs. The SNP alleles were C/T, A/G and A/C, respectively. For the first peak SNP (A10_99672586), the average RDI of accessions with favourable alleles (T) was 27.81, which was lower than the average RDI (48.68) of accessions with unfavourable alleles (C) investigated in RDIF2016. The RDI values of accessions with favourable alleles (A) at A10_98859056 (17.58) and (C) at A10_99071906 (26.26) were both lower than the average RDI values for accessions with unfavourable alleles (G) at A10_98859056 (34.57) and (A) at A10_99071906 (44.98) (P < 0.01) (Figure 3a). These results indicate that the phenotypic characteristics of the genotypes with favourable SNP alleles were significantly enhanced compared to those of the genotypes with unfavourable SNP alleles.
Figure 3.

Mining of favourable SNP alleles. (a) Relative disease index of accessions with favourable and unfavourable alleles at the SNPs (A10_99071906, A10_98859056 and A10_99672586) for VW resistance. ** indicates significant difference (P < 0.01); (b) relative disease index of accessions with different numbers of favourable alleles (CC, AA and TT). FA indicates the numbers of favourable alleles. Different letters (a, b, and c) indicate significant difference (P < 0.01).
The mean RDI values for accessions that contained different numbers of favourable SNP alleles indicate that lower RDI values occurred in the cotton accessions with favourable SNP alleles compared to those either without such alleles or with fewer such alleles. The average RDI values for accessions without favourable alleles were 34.36, 48.01 and 44.78 in RDIF2015, RDIF2016 and RDIG2015, respectively; the average RDI values for accessions with a single favourable allele were 21.28, 36.40 and 34.97, respectively. The average RDI values for accessions with two or three favourable alleles were lower significantly than those with zero or a single favourable allele (P < 0.01). These results indicate that favourable SNP alleles had significant pyramiding effects on VW resistance (Figure 3b).
Prediction of candidate genes of VW resistance
The first peak SNP (A10_99672586) on A10 exhibited the minimum P‐value (–log10 P = 6.21) in RDIF2016, and may be a major genetic locus responsible for VW resistance in cotton. Thus, we investigated the haplotype block structure based on A10_99672586, within 300 kb on either side, to determine candidate genes. Block structures showed that the first peak SNP (A10_99672586) was involved in a 372‐kb haplotype block encompassed by 45 SNPs (Figure 4). Haplotype block structure analysis for A10 indicated that the candidate gene regions were 99.38–99.75 Mb, and a total of 22 genes were found on A10. A gene ontology analysis showed that three genes were without any definite annotation concerning their biological function and four genes had unpredicted pathways. Four genes were linked to biological pathways involved in plant stress response, including disease resistance, and the other genes were predicted to be involved in transport, translational regulation, transcription regulation and signal transduction, among other processes (Table 3).
Figure 4.

Genomic location of SNP locus associated with VW resistance and haplotype block analysis. Red arrows denote significantly associated SNPs located in the haplotype block. Genes within this region are indicated below.
Table 3.
Candidate genes linked genomic region of SNP most highly associated with VW resistance in cotton
| Code | Gene | Start | Stop | Arabidopsis homologues | Description | GO annotation |
|---|---|---|---|---|---|---|
| CG01 | Gh_A10G2075 | 99409815 | 99410634 | Hypothetical protein | Function unknown | |
| CG02 | Gh_A10G2076 | 99411620 | 99415320 | AT3G25510 | Disease resistance protein (TIR‐NBS‐LRR class), putative | Defence response |
| CG03 | Gh_A10G2077 | 99423054 | 99425281 | AT4G16890 | Disease resistance protein (TIR‐NBS‐LRR class), putative | Response to stimulus |
| CG04 | Gh_A10G2078 | 99443579 | 99452906 | AT3G25510 | Disease resistance protein (TIR‐NBS‐LRR class), putative | Response to stimulus |
| CG05 | Gh_A10G2079 | 99466199 | 99467209 | AT3G09250 | Nuclear transport factor 2 (NTF2) family protein | Function unknown |
| CG06 | Gh_A10G2080 | 99507293 | 99508656 | AT1G69550 | Disease resistance protein (TIR‐NBS‐LRR class) | Pathway unpredicted |
| CG07 | Gh_A10G2081 | 99521849 | 99524748 | AT3G25510 | Disease resistance protein (TIR‐NBS‐LRR class), putative | Signal transduction |
| CG08 | Gh_A10G2082 | 99547079 | 99552644 | AT4G13360 | ATP‐dependent caseinolytic (Clp) protease/crotonase family protein | Proteolysis |
| CG09 | Gh_A10G2083 | 99555764 | 99557360 | AT3G24450 | Heavy metal transport/detoxification superfamily protein | Cellular transition metal ion homeostasis |
| CG10 | Gh_A10G2084 | 99561564 | 99563596 | AT3G24460 | Serinc domain containing serine and sphingolipid biosynthesis protein | Pathway unpredicted |
| CG11 | Gh_A10G2085 | 99601580 | 99603022 | AT2G39980 | HXXXD‐type acyl‐transferase family protein | Pathway unpredicted |
| CG12 | Gh_A10G2086 | 99613022 | 99614422 | AT2G39980 | HXXXD‐type acyl‐transferase family protein | Pathway unpredicted |
| CG13 | Gh_A10G2087 | 99631484 | 99632864 | AT3G11260 | WUSCHEL related homeobox 5 | Regulation of transcription |
| CG14 | Gh_A10G2088 | 99640405 | 99643453 | AT2G39990 | Eukaryotic translation initiation factor 2 | Regulation of translational initiation |
| CG15 | Gh_A10G2089 | 99656268 | 99657394 | AT4G00430 | Plasma membrane intrinsic protein 1;4 | Transport |
| CG16 | Gh_A10G2090 | 99664460 | 99665584 | AT4G00430 | Plasma membrane intrinsic protein 1;4 | Transport |
| CG17 | Gh_A10G2091 | 99675191 | 99676314 | AT4G00430 | Plasma membrane intrinsic protein 1;4 | Transport |
| CG18 | Gh_A10G2092 | 99682369 | 99683695 | AT2G29670 | Tetratricopeptide repeat (TPR)‐like superfamily protein | Pathway unpredicted |
| CG19 | Gh_A10G2093 | 99688252 | 99689673 | AT2G40000 | Orthologue of sugar beet HS1 PRO‐1 2 | Defence response |
| CG20 | Gh_A10G2094 | 99701603 | 99703792 | AT2G40010 | Ribosomal protein L10 family protein | Cytoplasmic translation |
| CG21 | Gh_A10G2095 | 99705983 | 99708239 | AT5G05760 | Syntaxin of plants 31 | Transport |
| CG22 | Gh_A10G2096 | 99741994 | 99744974 | AT2G38120 | Transmembrane amino acid transporter family protein | Transport |
GO annotation of biological process was indicated in the table.
To investigate which genes were responsible for resistance to VW, we used quantitative real‐time PCR (qRT‐PCR) analysis to determine differential gene expression in candidate genes identified by GWAS analysis. The results showed that five genes (CG02, CG03, CG12, CG13 and CG19) were up‐regulated in the resistant (R) genotype Zhongzhimian2 (ZZM2) and susceptible (S) genotype Jimian11 (JM11) at different times after V. dahliae inoculation (Table S5). Two genes (CG02 and CG13) specific to the R genotype were implicated in resistance against V. dahliae in cotton (Figure 5). Arabidopsis homologues of CG02 and CG13 encode TIR‐NBS‐LRR protein and WOX family transcription factors, respectively, which have been proposed to be involved in disease resistance response and signal transduction.
Figure 5.

Heat map for expression patterns of the candidate genes at 2, 6, 12, 24, 48, 72 and 120 h postinoculation with V. dahliae strain Vd991 in R genotype (Zhongzhimian2) and S genotype (Jimian11). Red represents high expression; green represents low expression.
Potential functional roles of CG02 in V. dahliae resistance
To further investigate the function of the five R genotype up‐regulated genes in VW resistance, we performed VIGS, constructing recombinant viruses including pTRV2:CG02, pTRV2:CG03, pTRV2:CG12, pTRV2:CG13 and pTRV2:CG19 to silence endogenous genes, with pTRV1 serving as a mock treatment. When plants infiltrated with pTRV2:CLA1 showed bleaching in newly emerged leaves, we used qRT‐PCR to confirm the silencing of the genes, which exhibited lower expression levels in five genes in infiltrated pTRV2:CG02, pTRV2:CG03, pTRV2:CG12, pTRV2:CG13 and pTRV2:CG19 plants than the control (ZZM2, WT and pTRV2:00, CK) (Figure S3). We inoculated these plants by dip infection with conidial suspension (5 × 10⁶ conidia/mL). After 3 weeks, the control plants seldom exhibited leaf wilting; approximately 15% of plants were diseased. Among the gene‐silenced plants, 27% of CG03‐silenced plants, 21% of CG12‐silenced plants, 20% of CG13‐silenced plants and 23% of CG19‐silenced plants exhibited the wilting phenotype when infected with V. dahliae, indicating no significant difference from the proportion of control plants. Furthermore, 67% of CG02‐silenced plants were severely infected by V. dahliae, similar to the proportion observed in susceptible control plants JM11, with 92% diseased plants; (Figures 6a, c and S4). The vascular wilt symptoms varied; the stems of CG02‐silenced plants turned brown, whereas other gene‐silenced plants showed no wilt symptoms in stems (Figure 6b). Fungal biomass qRT‐PCR analysis demonstrated that CG02‐silenced plants developed significantly higher fungal biomass than control plants, 4.3‐fold higher than that in WT and 3.9‐fold higher than in CK, whereas fungal biomass in CG03‐, CG12‐, CG13‐ and CG19‐silenced plants did not differ significantly from that in control plants (Figure 6d). These results strongly indicate that CG02 is required for V. dahliae resistance in cotton.
Figure 6.

Analysis of five candidate genes implicated in V. dahliae resistance as determined by VIGS. (a) Plant phenotypes at 21 day postinoculation; (b) stem symptoms of control and silenced plants inoculated with V. dahliae strain Vd991; (c) percentage of diseased leaves after V. dahliae inoculation. Experiments were performed using 20 plants per treatment; (d) fungal biomass determined by qRT‐PCR in control and gene‐silenced plants. Experiments were performed using at least nine inoculated plants and the Verticillium elongation factor 1‐α gene was used for equilibration of transcript levels. Error bars were calculated based on three biological replicates using standard deviation. WT and CK represent Zhongzhimian2 (ZZM2) and pTRV2:00, respectively. CG02, CG03, CG12, CG13 and CG19 represent gene‐silenced plants. ** indicates significant difference (P < 0.01).
Discussion
GWAS and population structure
VW caused by V. dahliae is one of the most destructive diseases in cotton. Understanding the mechanism of host resistance to VW through gene/QTL analysis and breeding resistant cultivars through MAS are thought to be the most practical and effective ways to manage this disease. However, it is difficult to reliably identify VW resistance QTLs for various reasons, including limited biparental allelic separation and the low genome coverage of molecular markers (Fang et al., 2013; Zhang et al., 2014a, 2015a; Zhou et al., 2014). In addition to the small effects of most loci, the limited allelic segregation and recombination of biparental populations in linkage mapping hinder the identification of VW resistance QTLs or genes. Moreover, most previous studies on QTL mapping for VW resistance in cotton have been based on early‐segregating mapping populations that could not be evaluated repeatedly, causing higher experimental errors (Wang et al., 2007; Wu et al., 2009; Zhen et al., 2006). In this study, we used an association population consisting of 299 upland cotton accessions from broader breeding populations for VW resistance QTL detection, which can offer more historical recombination events to overcome the limitations of biparental populations.
We performed PCA to ascertain the divergence of the populations in our panel. The first three principal components were correlated with geographical distribution and defined two groups, although different degrees of introgression were detected within these groups. The accessions of Group I mainly derived from YZR and Group II mainly derived from YR (Group II–A) and NW (Group II–B), which was consistent with the results of phylogenetic analysis (Figure 1c). The accessions from LN and FG were more dispersive than those of the other groups (Figure 1a, b). We suppose that these accessions are exchanged frequently during the cultivation process. We also found that some accessions from Jiangsu and Jiangxi provinces in YZR are more closely related to the YR group and present greater genetic introgression from the YR group (Figure 1a, b; Table S1); this result suggests that the accessions from Jiangsu and Jiangxi might initially derive from YR cotton.
Screening for VW resistance in cotton
In this study, we evaluated a population of 299 accessions for VW resistance under field screening nursery and glasshouse inoculation conditions. Fields heavily infested with V. dahliae can serve as long‐term or permanent natural nurseries for screening and selecting cotton for VW resistance (Bell and Hillocks, 1992); however, it is difficult to maintain a relatively uniform distribution of inocula at high density under field conditions. Seasonally variable environmental factors and weather also affect screening results (Zhang et al., 2014a). Because VW is highly sensitive to environmental and developmental factors, in‐field evaluation can be a challenge in achieving reliable VW resistance screening results. Due to the limitations of field evaluation of VW resistance, we performed artificial inoculation in a glasshouse. In glasshouse assays, cotton plants with two true leaves were infected by root inoculation using root‐dipping techniques (Liu et al., 2013). A defoliating V. dahliae isolate Vd991, abundant in the Yellow River and Yangtze River cotton regions (Zhang et al., 2014b), was used for disease infection in our glasshouse assay. A single V. dahliae isolate infection could allow accurate and effective identification of resistant accessions under the same criteria. However, biological limitations are associated with using a single isolate, which cannot represent the diversity that would generally be observed in the field, where mixed populations of V. dahliae would typically be found (Wei et al., 2015). A number of V. dahliae isolates may be found in the field; 67 isolates of V. dahliae have been identified in pepper fields belonging to different vegetative compatibility groups (Bhat et al., 2003). Due to this variability in distribution in field and glasshouse environments, different QTLs should be identified in cotton associated with resistance to V. dahliae isolates. Zhao et al. (2014) showed that 15 and 32 markers were significantly associated with VW resistance in cotton in a glasshouse and a disease nursery, respectively; five of these markers were significantly associated with VW resistance in both environments. Given this previous result, we performed two assays under field and glasshouse conditions to identify the overlapping QTLs associated with VW resistance in cotton. We found that three peaks on A10 identified in three environments were overlapped (Figure 2) and five SNPs were common at –log10 P > 4.5 (Table S4).
It is recommended to perform multiple replicated tests to reduce experimental errors in evaluating VW resistance and provide more reliable phenotypic data for genetic studies and QTL mapping (Fang et al., 2013; Ning et al., 2013). We screened 60 plants with three replicates for each genotype (20 plants per genotype) for VW resistance in the field and 90 plants with three replicates (30 plants per genome) in the glasshouse after inoculation with V. dahliae isolate Vd991. This improved screening method for evaluating VW resistance was performed for more efficient and effective QTL mapping (Zhang et al., 2014a).
Associated SNP comparison with known QTLs
We used GWAS to detect SNPs associated with VW resistance in cotton and identified 17 SNPs that had significant association with V. dahliae response. To further confirm these loci for VW resistance, a comparison of the GWAS was performed with QTLs identified in previous studies. A total of 85 QTLs for VW resistance containing 139 simple sequence repeat (SSR) markers were selected from 11 QTL mapping reports (Table S6). The physical locations of these SSR primer sequences were mapped to the reference genome sequence (Zhang et al., 2015b) via electronic PCR (e‐PCR). A previous report evaluated VW resistance in a backcross inbred line population, and a QTL (qVWR‐08‐c4‐1) was detected in the region of 0.97–3.87 Mb on A04 (Zhang et al., 2015a). Three significant SNPs (A04_2334165, A04_3445154 and A04_3516941) on A04 as identified by GWAS were positioned between BNL3089 and NAU3469 of the QTL qVWR‐08‐c4‐1 (Figure S1a). Furthermore, some peak SNPs on A02, A13, D05 and D12 identified in this study overlapped with previous QTLs, although they were lower than the threshold (P < 1.17 × 10⁻⁵, –log10 P = 4.93) (Figure S1b). The SNP (A02_45851582) located on the A02 peak in RDIF2015 was positioned between MUSS294 and NAU1072 in QTL qFDI711‐30‐0.01 (Wu et al., 2010). Peak SNPs A13_2361609 identified in RDIG2015 and A13_2361299 in RDIF2015 were positioned between NAU2730 and NAU5110 in qVWI‐09‐c13‐1 (Zhang et al., 2015a). Peak SNP D05_54737235 in RDIG2015 was mapped to the regions of QTLs qFDI711‐27‐26.01 and qVV‐D5‐1BC1S2592 (Wu et al., 2010; Yang et al., 2008). Peak SNP D12_11092664 identified in RDIF2015 was positioned between BNL3867 and BNL1605 in q7.22‐2 (Wang et al., 2008). These results show that the loci for VW resistance identified in this study had considerable overlap with previously reported loci, suggesting that a GWAS with a panel of 299 cotton accessions is suitable for the identification of significant SNPs associated with VW resistance. Although the significant SNPs identified on A10 were not mapped to regions of previous QTLs, this was consistent with our expectation that it would be a novel locus for VW resistance in this study.
Identification of candidate genes
Trait–SNP association analysis showed that the peaks associated with VW resistance on A10 were continuous and common in three environments. We infer that it is a major genetic locus responsible for VW resistance in cotton. Comparative genomic analyses have indicated that plant genomes can encode several hundreds of NB‐LRR genes (He et al., 2004), and they often occur in clusters at specific loci following gene duplication and amplification events (Chen et al., 2015a; Richly et al., 2002). Furthermore, many NB‐LRR genes were showed to be colocalized with resistance loci based on the physical or genetic mapping (Daniela et al., 2013). In this study, the resistance locus identified in A10 was present to be rich in NB‐LRR genes which occurred in RGA clusters, and there were 16 RGAs in the region of 99‐100 Mb on A10 (Figure S2).
Many resistant genes (R) have been cloned from diverse plant species, most of which encode NB‐LRR proteins (Collier and Moffett, 2009; Wang et al., 2015). Effector‐triggered activation of R proteins leads to an array of protective responses, often culminating in a hypersensitive response to prevent further ingress of the pathogen (Greenberg and Yao, 2004; Slootweg et al., 2013). NB‐LRR proteins recognize pathogen effectors either directly by physical binding of effectors to R proteins or indirectly through the perception of effector‐induced modifications of host proteins known as guardees, decoys or more generally cofactors by R proteins (Collier and Moffett, 2009; Dodds and Rathjen, 2010). Two NB‐LRR proteins from rice, RGA4 and RGA5, were found to be required for the recognition of the Magnaporthe oryzae effectors AVR1‐CO39 and AVR‐Pia by direct binding (Cesari et al., 2013). Research in Arabidopsis has shown that the TIR‐NBS‐LRR resistance protein RPP1 associated by its LRR domain with the effector ATR1 in Peronospora parasitica, while the Toll/interleukin‐1 receptor (TIR) domain facilitates the induction of the hypersensitive cell death response (Krasileva et al., 2010). In this study, the candidate gene CG02, its homologues in Arabidopsis encoding NB‐LRR proteins, was shown to be involved in VW resistance response in cotton. However, the molecular mechanisms of effector recognition with the activation of downstream resistance signalling pathways remain to be elucidated.
Experimental procedures
Plant materials and phenotypic evaluation
A total of 299 cotton accessions were collected from major breeding institutes across China and the germplasm gene bank of CRI‐CAAS. The population consisted of 263 cultivars or accessions developed from major cotton regions in China (YR, YZR, NW and LN) and 26 introduced from abroad (Foreign group, or FG).
All 299 accessions were planted in a field screening nursery at Shihezi, Xinjiang, China, in 2015 and 2016. The field screening nursery was prepared by consecutively growing susceptible cultivars to build up the inoculum, and supplemented by the distribution of crop residues from heavily infected cotton plants over many years, ensuring that the susceptible control (JM11) would reach an anticipated severity of infection. The field experiments followed a randomized complete block design with three replicates. Each accession was grown in a plot with 30–40 plants in each of two rows, with a distance of 10 cm between plants within each row and 45 cm between rows. The trial management followed standard breeding field protocols. A scale of 0–4 was used to rate disease severity based on the percentage of diseased leaves, where 0 = no symptoms, 1 = less than 25% symptomatic, 2 = 25%–50% symptomatic, 3 = 50%–75% symptomatic and 4 = more than 75% of leaves showing symptoms. These ratings were then converted to a disease index (DI) to estimate the severity of infection for a certain line. The DI was calculated as follows: , where d c was the disease severity rating, n c the number of plants with the corresponding disease severity rating and n t the total number of plants assessed. The DI was further adjusted to create a relative disease index (RDI) to decrease error by a correction factor K, defined as: ,where 50.00 was regarded as the standard DI of the susceptible control and DIck was the actual DI of the susceptible control. RDI was defined as: RDI = DI × K, where DI was the actual DI of the testing lines. When the DI of the susceptible control reached approximately 50, implying uniform and severe infection, disease severity ratings of each cotton line were recorded and DI and RDI were calculated, serving as an evaluation of disease resistance for the cotton line at adult‐plant stage (Zhao et al., 2014).
Another phenotypic measure of disease severity was obtained in a controlled glasshouse under a 16/8‐h light–dark photoperiod at 25 °C. The 299 accessions were planted in paper pots using a completely randomized block design with three replicates. Cotton seeds were planted in paper pots (7.5 cm in diameter and 8.5 cm in height) with five seeds per pot and six pots per accession in each replication. The highly virulent V. dahliae strain Vd991 was cultured on liquid complete medium at 25 °C for 10 day, after which the concentration of conidia was adjusted to 5 × 10⁶ conidia/mL. Symptom development was recorded from 22 to 25 day and categorized into five grades: 0 = healthy plant, no symptoms on leaves; 1 = one or two cotyledons showing symptoms but no symptoms on true leaves; 2 = both cotyledons and one true leaf showing symptoms; 3 = both cotyledons and two true leaves showing symptoms; and 4 = all leaves showing symptoms, symptomatic leaves dropped, apical meristem necrotic or plant death (Zhao et al., 2014). The DI and RDI were calculated according to the same method used in the field screening nursery.
SNP genotyping and quality control
For each cotton accession, genomic DNA was isolated from fresh leaves of a single plant per accession using CTAB method (Paterson et al., 1993). SNP genotyping of the association panel was performed using a SLAF‐seq approach (Sun et al., 2013). Sequencing libraries of each accession were constructed through restriction enzymes HaeIII and Hpy166II (New England Biolabs, NEB, USA) that digest cotton genomic DNA into DNA fragments of 364–464 bp. These were selected as SLAFs and prepared for pair‐end sequencing on an Illumina High‐seq 2500 sequencing platform (Illumina, Inc.) at Biomarker Technologies Corporation (Beijing, China). The 125‐bp sequence read at both ends of the fragment in each library was generated using an Illumina Genome Analyzer II (Illumina Inc.) with a barcode approach, to identify each sample. The raw reads (125 bp) were filtered and trimmed according to predefined criteria, and then a 100‐bp paired length sequence was retained at each end. The BWA software was used to map raw paired‐end reads onto the reference genome (G. hirsutum v. 1.0) (Zhang et al., 2015b). The SLAF groups were generated by reads mapped to the same position. If an accession is only partly digested by restriction enzymes, some reads mapped to the reference genome should overlap two SLAF tags; such reads were assigned to both SLAF tags in that accession. A total of 649,625 high‐quality SLAF tags were thus obtained from each of the 299 genotypes. The GATK (McKenna et al., 2010) and SAMtools (Li et al., 2009) packages were used to perform SNP calling. All SNPs called by GATK and SAMtools were designated high‐quality; we filtered SNPs with missing rate ≤50% and MAF above 0.05. In total, 85 630 SNPs were identified and used for further analysis.
LD and population structure analysis
LD was calculated as the squared correlation coefficient (r 2) of alleles using Haploview 4.2 (Barrett et al., 2005). Parameters in the program included MAF (≥0.05) and the missing rate of each SNP (≤50%). A total of 85 630 SNPs distributed evenly across the entire genome were selected for genetic relatedness analyses. PCA based on the same SNP set was carried out using the EIGENSOFT software (Price et al., 2006). The phylogenetic tree of the 299 accessions was constructed using MEGA 5.1 program with neighbour‐joining methods (1000 bootstraps) (Tamura et al., 2011). The relative kinship matrix of 299 cotton lines was computed using SPAGeDi software (Hardy and Vekemans, 2002).
Genome‐wide association analysis and haplotype block construction
A total of 85 630 SNPs were used for GWAS with a compressed mixed linear model (CMLM) implemented in the GAPIT software (Lipka et al., 2012). The first three PCA values were used as fixed effects in the model to correct for stratification (Price et al., 2006). The GWAS threshold was set to P < 1.17 × 10⁻⁵ (1/total SNPs used, –log10 P = 4.93). Those with P‐values lower than 1.17 × 10⁻⁵ were defined as significant trait‐associated SNPs; genes that were located within the region 300 kb upstream or downstream of trait‐associated SNPs were identified as candidate associated genes.
Haplotype blocks were constructed using the confidence interval method (Gabriel et al., 2002) with Haploview software (Barrett et al., 2005), where the Hardy–Weinberg P‐value cut‐off was 0.001 and MAF was 0.05.
RNA isolation and qRT‐PCR analysis
Total RNA was extracted from cotton seedling roots using a Plant RNA Purification Kit (Tiangen, Beijing, China). cDNA was prepared using M‐MLV Reverse Transcriptase and qRT‐PCR analyses were conducted using the SYBR Premix Ex Taq kit (Takara) on a QuantStudio 6 Flex Real‐Time PCR System (Applied Biosystems, Foster City, CA). The primers used for PCR amplification are listed in Table S7 and designed to avoid conserved regions. The cotton 18S gene was used as an internal control to normalize the variance among samples. PCR conditions consisted of an initial denaturation step at 95 °C for 10 min, followed by 40 cycles of denaturation at 95 °C for 15 s, annealing at 60 °C for 30 s and extension at 72 °C for 20 s. Relative expression levels were evaluated using the 2−ΔΔCT method (Livak and Schmittgen, 2001).
VIGS analysis and detection of VW resistance
For the VIGS assays, five fragments amplified from R genotype (ZZM2) cDNA were integrated into the vector pTRV2 to construct pTRV2:CG02/CG03/CG12/CG13/CG19 and introduced into Agrobacterium tumefaciens GV3101. The primers used for the construction of the VIGS vectors are listed in Table S7. Agrobacterium strains harbouring pTRV2: CG02/CG03/CG12/CG13/CG19 plasmid combined with strains harbouring pTRV1 vector were mixed in a 1:1 ratio and co‐infiltrated into the cotyledons of 2‐week‐old cotton plants (ZZM2) with JM11 serving as a susceptible control. The control vector pTRV2:CLA1 was used to evaluate the effectiveness of VIGS. Two weeks later, white leaves were observed in plants in which the CLA1 gene had been targeted by VIGS, and all of plantlets were subjected to V. dahliae inoculation with 200 mL of conidial suspension (5 × 10⁶ conidia/mL). VW symptoms were investigated 3 weeks postinoculation. Seedling shoots were cut to investigate vascular wilt under a microscope postinoculation (Chen and Dai, 2010; Liu et al., 2013). For in planta fungal biomass quantification, stems of three inoculated plants were harvested at 20 day postinoculation. qRT‐PCR on genomic DNA isolated from the samples was conducted using the SYBR Premix Ex Taq kit (Takara). Verticillium elongation factor 1‐α was used to quantify fungal colonization (Santhanam et al., 2013).
Supporting information
Figure S1 Overlapping among the SNP loci identified through our genome‐wide association study (GWAS) and quantitative trait loci (QTLs) reported in previous studies.
Figure S2 Resistance gene analogs (RGAs) in the vicinity of the significant SNP loci identified on A10.
Figure S3 VIGS analysis of five candidate genes for V. dahliae resistance.
Figure S4 Plant phenotypes for V. dahliae resistance as determined by VIGS at 21 day post‐inoculation with V. dahliae.
Table S1 Information of 299 upland cotton accessions.
Table S2 Analysis of variance (ANOVA) results of VW resistance.
Table S3 SNP distribution on each chromosome.
Table S4 Five SNPs on A10 identified in all three environments.
Table S5 Relative expression levels of candidate genes in qRT‐PCR.
Table S6 The QTLs of VW resistance from 11 reports of QTL mapping.
Table S7 Primers used in this study.
Acknowledgements
This study was supported by the National Natural Science Foundation of China (31471759), Special Public Welfare Industry Research on Agriculture (201503109) and CAAS (an Agricultural Science and Technology Innovation Program grant to X.F.D). Many thanks to Jianfeng Weng, Changlin Liu, Chenyang Hao and Shirong Zhou for valuable discussion and comments on the manuscript. The authors declare no conflict of interest.
Contributor Information
Jieyin Chen, Email: chenjieyin@caas.cn.
Xiaofeng Dai, Email: daixiaofeng@caas.cn.
References
- Abdurakhmonov, I.Y. , Kohel, R.J. , Yu, J.Z. , Pepper, A.E. , Abdullaev, A.A. , Kushanov, F.N. , Salakhutdinov, I.B. et al. (2008) Molecular diversity and association mapping of fiber quality traits in exotic G. hirsutum L. germplasm. Genomics, 92, 478–487. [DOI] [PubMed] [Google Scholar]
- Barrett, J.C. , Fry, B. , Maller, J. and Daly, M.J. (2005) Haploview: analysis and visualization of LD and haplotype maps. Bioinformatics, 21, 263–265. [DOI] [PubMed] [Google Scholar]
- Bell, A.A. and Hillocks, R.J. (1992) Verticillium Wilt. Wallingford: CAB International, 87–126. [Google Scholar]
- Bhat, R.G. , Smith, R.F. , Koike, S.T. , Wu, B.M. and Subbarao, K.V. (2003) Characterization of Verticillium dahliae isolates and wilt epidemics of pepper. Plant Dis. 87, 789–797. [DOI] [PubMed] [Google Scholar]
- Bolek, Y. , Elzik, K.M. , Pepper, A.E. , Bell, A.A. , Magill, C.W. , Thaxton, P.M. and Ouk, R. (2005) Mapping of Verticillium wilt resistance genes in cotton. Plant Sci. 168, 1581–1590. [Google Scholar]
- Breseghello, F. and Sorrells, M.E. (2006) Association mapping of kernel size and milling quality in wheat (Triticum aestivum L.) cultivars. Genetics, 172, 1165–1177. [DOI] [PMC free article] [PubMed] [Google Scholar]
- Cai, Y.F. , He, X.H. , Mo, J.C. , Sun, Q. , Yang, J.P. and Liu, J.G. (2009) Molecular research and genetic engineering of resistance to Verticillium wilt in cotton. Afr. J. Biotechnol. 8, 7363–7372. [Google Scholar]
- Cai, C.P. , Ye, W.X. , Zhang, T.Z. and Guo, W.Z. (2014) Association analysis of fiber quality traits and exploration of elite alleles in upland cotton cultivars/accessions (Gossypium hirsutum L.). J. Integr. Plant Biol. 56, 51–62. [DOI] [PubMed] [Google Scholar]
- Casa, A.M. , Pressoir, G. , Brown, P.J. , Mitchell, S.E. , Rooney, W.L. , Tuinstra, M.R. , Franks, C.D. et al. (2008) Community resources and strategies for association mapping in sorghum. Crop Sci. 48, 30–40. [Google Scholar]
- Cesari, S. , Thilliez, G. , Ribot, C. , Chalvon, V. , Michel, F. , Jauneau, A. , Rivas, S. et al. (2013) The rice resistance protein pair RGA4/RGA5 recognizes the Magnaporthe oryzae effectors AVR‐Pia and AVR1‐CO39 by direct binding. Plant Cell, 25, 1463–1481. [DOI] [PMC free article] [PubMed] [Google Scholar]
- Chen, J.Y. and Dai, X.F. (2010) Cloning and characterization of the Gossypium hirsutum major latex protein gene and functional analysis in Arabidopsis thaliana . Planta, 231, 861–873. [DOI] [PubMed] [Google Scholar]
- Chen, J.Y. , Huang, J.Q. , Li, N.Y. , Ma, X.F. , Wang, J.L. , Liu, C. , Liu, Y.F. et al. (2015a) Genome‐wide analysis of the gene families of resistance gene analogues in cotton and their response to Verticillium wilt. BMC Plant Biol. 15, 1–15. [DOI] [PMC free article] [PubMed] [Google Scholar]
- Chen, W. , Yao, J.B. , Chu, L. , Yuan, Z.W. , Li, Y. and Zhang, Y.S. (2015b) Genetic mapping of the nulliplex‐branch gene (gb_nb1) in cotton using next‐generation sequencing. Theor. Appl. Genet. 128, 539–547. [DOI] [PubMed] [Google Scholar]
- Collier, S.M. and Moffett, P. (2009) NB‐LRRs work a “bait and switch” on pathogens. Trends Plant Sci. 14, 521–529. [DOI] [PubMed] [Google Scholar]
- Daniela, M. , Maria, A.R. , Giovanni, L. , Anna, M.D.L. and Anna, M.M. (2013) Plant nucleotide binding site‐leucine‐rich repeat (NBS‐LRR) genes: active guardians in host defense responses. Int. J. Mol. Sci. 14, 7302–7326. [DOI] [PMC free article] [PubMed] [Google Scholar]
- Dodds, P.N. and Rathjen, J.P. (2010) Plant immunity towards an integrated view of plant‐pathogen interactions. Nat. Rev. Genet. 11, 539–548. [DOI] [PubMed] [Google Scholar]
- Du, W.S. , Du, X.M. and Ma, Z.Y. (2004) Studies on SSR markers of resistance gene of Verticillium wilt in cotton. Nat. Sci. Ed. 3, 20–23. [Google Scholar]
- Fang, H. , Zhou, H.P. , Sanogo, S. , Flynn, R. , Percy, R.G. , Hughs, S.E. , Ulloa, M. et al. (2013) Quantitative trait locus mapping for Verticillium wilt resistance in a backcross inbred line population of cotton (Gossypium hirsutum × Gossypium barbadense) based on RGA‐AFLP analysis. Euphytica, 194, 79–91. [Google Scholar]
- Fradin, E.F. , Zhang, Z. , Juarez Ayala, J.C. , Castroverde, C.D.M. , Nazar, R.N. , Robb, J. , Liu, C.M. et al. (2009) Genetic dissection of Verticillium wilt resistance mediated by tomato Ve1 . Plant Physiol. 150, 320–332. [DOI] [PMC free article] [PubMed] [Google Scholar]
- Fradin, E.F. , Adb‐El‐Haliem, A. , Masini, L. , Van den Berg, G.C. , Joosten, M.H. and Thomma, B.P. (2011) Interfamily transfer of tomato Ve1 mediates Verticillium resistance in Arabidopsis . Plant Physiol. 156, 2255–2265. [DOI] [PMC free article] [PubMed] [Google Scholar]
- Gabriel, S.B. , Schaffner, S.F. , Nguyen, H. , Moore, J.M. , Roy, J. , Blumenstiel, B. , Higgins, J. et al. (2002) The structure of haplotype blocks in the human genome. Science, 296, 2225–2229. [DOI] [PubMed] [Google Scholar]
- Gao, W. , Long, L. , Zhu, L.F. , Xu, L. , Gao, W.H. , Sun, L.Q. , Liu, L.L. et al. (2013) Proteomic and virus‐induced gene silencing (VIGS) analyses reveal that gossypol, brassinosteroids, and jasmonic acid contribute to the resistance of cotton to Verticillium dahliae . Mol. Cell Proteomics, 12, 3690–3703. [DOI] [PMC free article] [PubMed] [Google Scholar]
- Gaspar, Y.M. , McKenna, J.A. , McGinness, B.S. , Hinch, J. , Poon, S. , Connelly, A.A. , Anderson, M.A. et al. (2014) Field resistance to Fusarium oxysporum and Verticillium dahliae in transgenic cotton expressing the plant defensing NaD1 . J. Exp. Bot. 65, 1541–1550. [DOI] [PMC free article] [PubMed] [Google Scholar]
- Greenberg, J.T. and Yao, N. (2004) The role and regulation of programmed cell death in plant‐pathogen interactions. Cell. Microbiol. 6, 201–211. [DOI] [PubMed] [Google Scholar]
- Hao, D.L. , Cheng, H. , Yin, Z.T. , Cui, S.Y. , Zhang, D. , Wang, H. and Yu, D.Y. (2012) Identification of single nucleotide polymorphisms and haplotypes associated with yield and yield components in soybean (Glycine max) landraces across multiple environments. Theor. Appl. Genet. 124, 447–458. [DOI] [PubMed] [Google Scholar]
- Hardy, O.J. and Vekemans, X. (2002) SPAGeDi: a versatile computer program to analyse spatial genetic structure at the individual or population levels. Mol. Ecol. Notes, 2, 618–620. [Google Scholar]
- He, L.M. , Du, C.G. , Covaleda, L. , Xu, Z.Y. , Robinson, A.F. , Yu, J.Z. , Kohel, R.J. et al. (2004) Cloning, characterization, and evolution of the NBS‐LRR‐encoding resistance gene analogue family in polyploid cotton (Gossypium hirsutum L.). Mol. Plant Microbe Interact. 11, 1234–1241. [DOI] [PubMed] [Google Scholar]
- Holub, E.B. (2001) The arms race is ancient history in Arabidopsis, the wildflower. Nat. Rev. Genet. 2, 516–527. [DOI] [PubMed] [Google Scholar]
- Jiang, F. , Zhao, J. , Zhou, L. , Guo, W.Z. and Zhang, T.Z. (2009) Molecular mapping of Verticillium wilt resistance QTL clustered on chromosomes D7 and D9 in upland cotton. Sci. China C Life Sci. 52, 872–884. [DOI] [PubMed] [Google Scholar]
- Kantartzi, S.K. and Stewart, J.M. (2008) Association analysis of fibre traits in Gossypium arboreum accessions. Plant Breeding, 127, 173–179. [Google Scholar]
- Kawchuk, L.M. , Hachey, J. , Lynch, D.R. , Kulcsar, F. , Rooijen, G.V. , Waterer, D.R. , Robertson, A. et al. (2001) Tomato Ve disease resistance genes encode cell surface‐like receptors. Proc. Natl Acad. Sci. USA, 98, 6511–6515. [DOI] [PMC free article] [PubMed] [Google Scholar]
- Kraakman, A.T.W. , Martínez, F. , Mussiraliev, B. , Eeuwijk, F.A.V. and Niks, R.E. (2006) Linkage disequilibrium mapping of morphological, resistance, and other agronomically relevant traits in modern spring barley cultivars. Mol. Breeding, 17, 41–58. [Google Scholar]
- Krasileva, K.V. , Dahlbeck, D. and Staskawicz, B.J. (2010) Activation of an Arabidopsis resistance protein is specified by the in planta association of its leucine‐rich repeat domain with the cognate oomycete effector. Plant Cell, 22, 2444–2458. [DOI] [PMC free article] [PubMed] [Google Scholar]
- Li, H. , Handsaker, B. , Wysoker, A. , Fennell, T. , Ruan, J. , Homer, N. , Marth, G. et al. (2009) The sequence alignment/map format and SAMtools. Bioinformatics, 25, 2078–2079. [DOI] [PMC free article] [PubMed] [Google Scholar]
- Li, F. , Shen, H. , Wang, M. , Fan, K. , Bibi, N. , Ni, M. , Yuan, S.N. et al. (2016) A synthetic antimicrobial peptide BTD‐S expressed in Arabidopsis thaliana confers enhanced resistance to Verticillium dahliae . Mol. Genet. Genomics, 291, 1647–1661. [DOI] [PubMed] [Google Scholar]
- Lipka, A.E. , Tian, F. , Wang, Q. , Peiffer, J. , Li, M. , Bradbury, P.J. , Gore, M.A. et al. (2012) GAPIT: genome association and prediction integrated tool. Bioinformatics, 28, 2397–2399. [DOI] [PubMed] [Google Scholar]
- Liu, S.Y. , Chen, J.Y. , Wang, J.L. , Li, L. , Xiao, H.L. , Adam, S.M. and Dai, X.F. (2013) Molecular characterization and functional analysis of a specific secreted protein from highly virulent defoliating Verticillium dahliae . Gene, 529, 307–316. [DOI] [PubMed] [Google Scholar]
- Livak, K.J. and Schmittgen, T.D. (2001) Analysis of relative gene expression data using real‐time quantitative PCR and the 2(‐Delta Delta C(T)) Method. Methods, 25, 402–408. [DOI] [PubMed] [Google Scholar]
- Malosetti, M. , van der Linden, C.G. , Vosman, B. and van Eeuwijk, F.A. (2007) A mixed‐model approach to association mapping using pedigree information with an illustration of resistance to Phytophthora infestans in potato. Genetics, 175, 879–889. [DOI] [PMC free article] [PubMed] [Google Scholar]
- McKenna, A. , Hanna, M. , Banks, E. , Sivachenko, A. , Cibulskis, K. , Kernytsky, A. , Garimella, K. et al. (2010) The genome analysis toolkit: a mapreduce framework for analyzing next‐generation DNA sequencing data. Genome Res. 20, 1297–1303. [DOI] [PMC free article] [PubMed] [Google Scholar]
- Mei, H.X. , Zhu, X.F. and Zhang, T.Z. (2013) Favorable QTL alleles for yield and its components identified by association mapping in Chinese upland cotton cultivars. PLoS ONE, 8, e82193. [DOI] [PMC free article] [PubMed] [Google Scholar]
- Miao, W.G. , Wang, X.B. , Song, C.F. , Wang, Y. , Hu, D.W. and Wang, J.S. (2010) Genetic transformation of cotton with a harpin‐encoding gene hpa Xoo confers an enhanced defense response against different pathogens through a priming mechanism. BMC Plant Biol. 10, 1471–1485. [DOI] [PMC free article] [PubMed] [Google Scholar]
- Munis, M.F. , Tu, L.L. , Deng, F.L. , Tan, J.F. , Xu, L. , Xu, S.C. , Long, L. et al. (2010) A thaumatin‐like protein gene involved in cotton fiber secondary cell wall development enhances resistance against Verticillium dahliae and other stresses in transgenic tobacco. Biochem. Biophys. Res. Commun. 393, 38–44. [DOI] [PubMed] [Google Scholar]
- Ning, Z.Y. , Zhao, R. , Chen, H. , Ai, N.J. , Zhang, X. , Zhao, J. , Mei, H.X. et al. (2013) Molecular tagging of a major quantitative trait locus for broad‐spectrum resistance to Verticillium wilt in upland cotton cultivar prema. Crop Sci. 53, 2304–2312. [Google Scholar]
- Nordborg, M. and Weigel, D. (2008) Next‐generation genetics in plants. Nature, 456, 720–723. [DOI] [PubMed] [Google Scholar]
- Parkhi, V. , Kumar, V. , Campbell, L.M. , Bell, A.A. , Shah, J. and Rathore, K.S. (2010) Resistance against various fungal pathogens and reniform nematode in transgenic cotton plants expressing Arabidopsis NPR1 . Transgenic Res. 19, 959–975. [DOI] [PubMed] [Google Scholar]
- Paterson, A.H. , Brubaker, C.L. and Wendel, J.F. (1993) A rapid method for extraction of cotton (Gossypium Spp.) genomic DNA suitable for RFLP or PCR analysis. Plant Mol. Biol. Rep. 11, 122–127. [Google Scholar]
- Price, A.L. , Patterson, N.J. , Plenge, R.M. , Weinblatt, M.E. , Shadick, N.A. and Reich, D. (2006) Principal components analysis corrects for stratification in genome‐wide association studies. Nat. Genet. 38, 904–909. [DOI] [PubMed] [Google Scholar]
- Richly, E. , Kurth, J. and Leister, D. (2002) Mode of amplification and reorganization of resistance genes during recent Arabidopsis thaliana evolution. Mol. Biol. Evol. 19, 76–84. [DOI] [PubMed] [Google Scholar]
- Santhanam, P. , van Esse, H.P. , Albert, I. , Faino, L. , Nürnberger, T. and Thomma, B.P. (2013) Evidence for functional diversification within a fungal NEP1‐like protein family. Mol. Plant Microbe Interact. 26, 278–286. [DOI] [PubMed] [Google Scholar]
- Slootweg, E.J. , Spiridon, L.N. , Roosien, J. , Butterbach, P. , Pomp, R. , Westerhof, L. , Wilbers, R. et al. (2013) Structural determinants at the interface of the ARC2 and leucine‐rich repeat domains control the activation of the plant immune receptors Rx1 and Gpa2. Plant Physiol. 162, 1510–1528. [DOI] [PMC free article] [PubMed] [Google Scholar]
- Su, J.J. , Fan, S.L. , Li, L.B. , Wei, H.L. , Wang, C.X. , Wang, H.T. , Song, M.Z. et al. (2016) Detection of favorable QTL alleles and candidate genes for lint percentage by GWAS in Chinese upland cotton. Front. Plant Sci. 7, 1576. [DOI] [PMC free article] [PubMed] [Google Scholar]
- Sun, X.W. , Liu, D.Y. , Zhang, X.F. , Li, W.B. , Liu, H. , Hong, W.G. , Jiang, C.B. et al. (2013) SLAF‐seq: an efficient method of large‐scale De Novo SNP discovery and genotyping using high‐throughput sequencing. PLoS ONE, 8, e58700. [DOI] [PMC free article] [PubMed] [Google Scholar]
- Tamura, K. , Peterson, D. , Peterson, N. , Stecher, G. , Nei, M. and Kumar, S. (2011) MEGA5: molecular evolutionary genetics analysis using maximum likelihood, evolutionary distance, and maximum parsimony methods. Mol. Biol. Evol. 28, 2731–2739. [DOI] [PMC free article] [PubMed] [Google Scholar]
- Thornsberry, J.M. , Goodman, M.M. , Doebley, J. , Kresovich, S. , Nielsen, D. and Buckler, E.S. (2001) Dwarf8 polymorphisms associate with variation in flowering time. Nat. Genet. 28, 286–289. [DOI] [PubMed] [Google Scholar]
- Wang, F.R. , Liu, R.Z. , Wang, L.M. , Zhang, C.Y. , Liu, G.D. , Liu, Q.H. , Ma, X.B. et al. (2007) Molecular markers of Verticillium wilt resistance in upland cotton (Gossypium hirsutum L.) cultivar and their effects on assisted phenotypic selection. Cotton Sci. 19, 424–430. [Google Scholar]
- Wang, H.M. , Lin, Z.X. , Zhang, X.L. , Chen, W. , Guo, X.P. , Nie, Y.C. and Li, Y.H. (2008) Mapping and quantitative trait loci analysis of Verticillium wilt resistance genes in cotton. J. Integr. Plant Biol. 50, 174–182. [DOI] [PubMed] [Google Scholar]
- Wang, G.F. , Ji, J.B. , EI‐Kasmi, F. , Dangl, J.L. , Johal, G. and Balint‐Kurti, P.J. (2015) Molecular and functional analyses of a maize autoactive NB‐LRR protein identify precise structural requirements for activity. PLoS Pathog. 11, e1004674. [DOI] [PMC free article] [PubMed] [Google Scholar]
- Wei, L.J. , Jian, H.J. , Lu, K. , Filardo, F. , Yin, N.W. , Liu, L.Z. , Qu, C.M. et al. (2015) Genome‐wide association analysis and differential expression analysis of resistance to Sclerotinia stem rot in Brassica napus . Plant Biotechnol. J. 14, 1368–1380. [DOI] [PMC free article] [PubMed] [Google Scholar]
- Weng, J.F. , Xie, C.X. , Hao, Z.F. , Wang, J.J. , Liu, C.L. , Li, M.S. , Zhang, D.G. et al. (2011) Genome‐wide association study identifies candidate genes that affect plant height in Chinese elite maize (Zea mays L.) inbred lines. PLoS ONE, 6, e29229. [DOI] [PMC free article] [PubMed] [Google Scholar]
- Wu, D.P. , Fang, W.P. , Ji, D.F. and Zhu, S.J. (2009) Studies on the inheritance of Verticillium wilt resistance in CCRI 12 and its utilization in cotton breeding. Cotton Sci. 21, 399–404. [Google Scholar]
- Wu, C.C. , Jian, G.L. , Wang, L.A. , Liu, F. , Zhang, X.L. , Song, G.L. , Li, S.H. et al. (2010) Primary detection of QTL for Verticillium wilt resistance in cotton. Mol. Plant Breeding, 08, 680–686. [Google Scholar]
- Xu, L. , Zhu, L.F. , Tu, L.L. , Liu, L.L. , Yuan, D.J. , Jin, L. , Long, L. et al. (2011) Lignin metabolism has a central role in the resistance of cotton to the wilt fungus Verticillium dahliae as revealed by RNA‐Seq‐dependent transcriptional analysis and histochemistry. J. Exp. Bot. 62, 5607–5621. [DOI] [PMC free article] [PubMed] [Google Scholar]
- Yang, C. , Guo, W.Z. and Zhang, T.Z. (2007) QTL mapping for resistance to Verticillium wilt, fiber quality and yield traits in upland cotton (Gossypium hirsutum L.). Mol. Plant Breeding, 6, 797–805. [Google Scholar]
- Yang, C. , Guo, W.Z. , Li, G.Y. , Feng, G. , Lin, S.S. and Zhang, T.Z. (2008) QTLs mapping for Verticillium wilt resistance at seedling and maturity stages in Gossypium barbadense L. Plant Sci. 174, 290–298. [Google Scholar]
- Zeng, L.H. , Meredith, W.R. Jr , Gutiérrez, O.A. and Boykin, D.L. (2009) Identification of associations between SSR markers and fiber traits in an exotic germplasm derived from multiple crosses among Gossypium tetraploid species. Theor. Appl. Genet. 119, 93–103. [DOI] [PubMed] [Google Scholar]
- Zhang, B.L. , Yang, Y.W. , Chen, T.Z. , Yu, W.G. , Liu, T.L. , Li, H.J. et al. (2012) Island cotton GbVe1 gene encoding a receptor‐like protein confers resistance to both defoliating and non‐defoliating isolates of Verticillium dahliae . PLoS ONE, 7, e51091. [DOI] [PMC free article] [PubMed] [Google Scholar]
- Zhang, T.Z. , Qian, N. , Zhu, X.F. , Chen, H. , Wang, S. , Mei, H.X. and Zhang, Y.M. (2013) Variations and transmission of QTL alleles for yield and fiber qualities in upland cotton cultivars developed in China. PLoS ONE, 8, e57220. [DOI] [PMC free article] [PubMed] [Google Scholar]
- Zhang, J.F. , Fang, H. , Zhou, H.P. , Sanogo, S. and Ma, Z.Y. (2014a) Genetics, breeding, and marker‐assisted selection for Verticillium wilt resistance in cotton. Crop Sci. 54, 1289–1303. [Google Scholar]
- Zhang, X.J. , Yuan, Y.C. , Wei, Z. , Guo, X. , Guo, Y.P. , Zhang, S.Q. , Zhao, J.S. et al. (2014b) Molecular mapping and validation of a major QTL conferring resistance to a defoliating isolate of Verticillium wilt in cotton (Gossypium hirsutum L.). PLoS ONE, 9, e96226. [DOI] [PMC free article] [PubMed] [Google Scholar]
- Zhang, J.F. , Yu, J.W. , Pei, W.F. , Li, X.L. , Said, J. , Song, M.Z. and Sanogo, S. (2015a) Genetic analysis of Verticillium wilt resistance in a backcross inbred line population and a meta‐analysis of quantitative trait loci for disease resistance in cotton. BMC Genom. 16, 577. [DOI] [PMC free article] [PubMed] [Google Scholar]
- Zhang, T.Z. , Hu, Y. , Jiang, W.K. , Fang, L. , Guan, X.Y. , Chen, J.D. , Zhang, J.B. et al. (2015b) Sequencing of allotetraploid cotton (Gossypium hirsutum L. acc. TM‐1) provides a resource for fiber improvement. Nat. Biotechnol. 33, 531–537. [DOI] [PubMed] [Google Scholar]
- Zhang, T. , Jin, Y. , Zhao, J.H. , Gao, F. , Zhou, B.J. , Fang, Y.Y. and Guo, H.S. (2016a) Host‐induced gene silencing of the target gene in fungal cells confers effective resistance to the cotton wilt disease pathogen Verticillium dahliae . Mol. Plant, 9, 939–942. [DOI] [PubMed] [Google Scholar]
- Zhang, Z.Y. , Zhao, J. , Ding, L.Y. , Zou, L.F. , Li, Y.R. , Chen, G.Y. and Zhang, T.Z. (2016b) Constitutive expression of a novel antimicrobial protein, Hcm1, confers resistance to both Verticillium and Fusarium wilts in cotton. Sci. Rep. 6, 20773. [DOI] [PMC free article] [PubMed] [Google Scholar]
- Zhao, Y.L. , Wang, H.M. , Chen, W. and Li, Y.H. (2014) Genetic structure, linkage disequilibrium and association mapping of Verticillium wilt resistance in elite cotton (Gossypium hirsutum L.) germplasm population. PLoS ONE, 9, e86308. [DOI] [PMC free article] [PubMed] [Google Scholar]
- Zhao, J. , Zhang, Z.Y. , Gao, Y.L. , Zhou, L. , Fang, L. , Chen, X.D. , Ning, Z.Y. et al. (2015a) Overexpression of GbRLK, a putative receptor‐like kinase gene, improved cotton tolerance to Verticillium wilt. Sci. Rep. 5, 15048. [DOI] [PMC free article] [PubMed] [Google Scholar]
- Zhao, X. , Han, Y.P. , Li, Y.H. , Liu, D.Y. , Sun, M.M. , Zhao, Y. , Lv, C.M. et al. (2015b) Loci and candidate gene identification for resistance to Sclerotinia sclerotiorum in soybean (Glycine max L. Merr.) via association and linkage maps. Plant J. 82, 245–255. [DOI] [PubMed] [Google Scholar]
- Zhen, R. , Wang, X.F. , Ma, Z.Y. , Zhang, G.Y. and Wang, X. (2006) A SSR marker linked with the gene of Verticillium wilt resistance in Gossypium barbadense . Cotton Sci. 18, 269–272. [Google Scholar]
- Zhou, H.P. , Hui, F. , Sanogo, S. , Hughs, S.E. , Jones, D.C. and Zhang, J.F. (2014) Evaluation of Verticillium wilt resistance in commercial cultivars and advanced breeding lines of cotton. Euphytica, 196, 437–448. [Google Scholar]
- Zhu, C.S. , Gore, M. , Buckler, E.S. and Yu, J. (2008) Status and prospects of association mapping in plants. Plant Genome, 1, 5–20. [Google Scholar]
Associated Data
This section collects any data citations, data availability statements, or supplementary materials included in this article.
Supplementary Materials
Figure S1 Overlapping among the SNP loci identified through our genome‐wide association study (GWAS) and quantitative trait loci (QTLs) reported in previous studies.
Figure S2 Resistance gene analogs (RGAs) in the vicinity of the significant SNP loci identified on A10.
Figure S3 VIGS analysis of five candidate genes for V. dahliae resistance.
Figure S4 Plant phenotypes for V. dahliae resistance as determined by VIGS at 21 day post‐inoculation with V. dahliae.
Table S1 Information of 299 upland cotton accessions.
Table S2 Analysis of variance (ANOVA) results of VW resistance.
Table S3 SNP distribution on each chromosome.
Table S4 Five SNPs on A10 identified in all three environments.
Table S5 Relative expression levels of candidate genes in qRT‐PCR.
Table S6 The QTLs of VW resistance from 11 reports of QTL mapping.
Table S7 Primers used in this study.