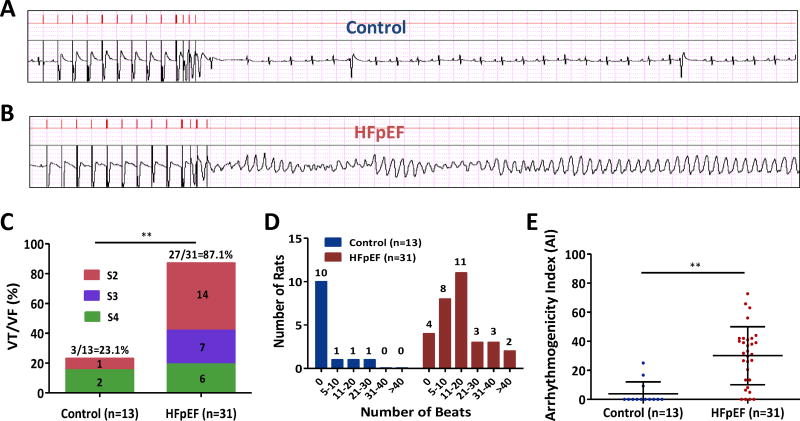
Figure 2. Programmed electrical stimulation (PES) in control and HFpEF rats.
A. Representative surface electrograms (upper panel: stimuli, lower panel: ECG) show no inducible arrhythmia in a control rat with S1, S2, S3 and S4 stimuli. B. Polymorphic ventricular tachycardia in a HFpEF rat induced by S1, S2, S3 and S4 stimuli. C. PES in 13 control and 31 HFpEF rats showed increased susceptibility to VA in HFpEF rats. D. HFpEF rats exhibited more prolonged VA compared to control rats. E. Arrhythmogenicity index (AI) was increased in HFpEF rats compared to control rats. Control rats n=13 and HFpEF rats n=31. Pooled data lines show mean and standard deviation. ** denotes p < 0.001. Fisher’s exact test was used in 2C and Wilcoxon rank sum test was used in 2E.

