Abstract
Signal suppression by sample matrix in direct electrospray ionization -mass spectrometric (ESI-MS) analysis hampers its clinical and biomedical applications. We report herein the development of a microfluidic voltage-assisted liquid desorption electrospray ionization (VAL-DESI) source to overcome this limitation. Liquid DESI is achieved for the first time in a microfluidic format. Direct analysis of urine, serum, and cell lysate samples by using the proposed microfluidic VAL-DESI-MS/MS method to detect chemical compounds of biomedical interest, including nucleosides, monoamines, amino acids, and peptides is demonstrated. Analyzing a set of urine samples spiked with dihydroxyphenylalanine (DOPA) showed that the assay had a linear calibration curve with r2 value of 0.997 and a limit of detection of 0.055 μM DOPA. The method was applied to simultaneous quantification of nucleosides, i.e. cytidine, adenosine, uridine, thymidine, and guanosine in cell lysates using 8-bromoadenosine as internal standard. Adenosine was found most abundant at 26.5 ± 0.57nmole/106 cells while thymidine was least at 3.1 ± 0.31nmole/106 cells. Interestingly, the ratio of adenosine to deoxyadenosine varied significantly from human red blood cells (1.07 ± 0.06) to cancerous cells, including lymphoblast TK6 (0.52 ± 0.02), skin melanoma C32 (0.82 ± 0.04), and promyelocytic leukemia NB4 cells (0.38 ± 0.06). These results suggest that the VAL-DESI-MS/MS technique has a good potential in direct analysis of biofluids. Further, due to the simplicity in its design and operation, the proposed microfluidic liquid DESI source can be fabricated as a disposable device for point-of-care measurements.
Keywords: Direct mass spectrometric analysis, biofluid samples, microfluidics, liquid desorption electrospray ionization, nucleosides, cell lysates
Graphical abstract
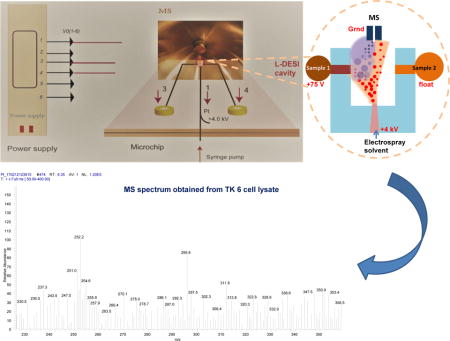
Mass spectrometry with electrospray ionization (ESI-MS) is one of the most powerful analytical techniques for bioanalysis due to its applicability to a broad range of molecular classes and sizes with sensitivity and specificity. However, signal suppression by sample matrix prohibits direct ESI-MS analysis of many types of biological samples such as physiological fluids. Extraction of the analytes and/or a chromatographic separation is normally deployed prior to ESI-MS analysis for elimination of sample matrix effects. Several ambient electrospray ionization schemes specially devised for direct ESI-MS analysis were reported over the past years. These included desorption ESI (DESI),1–4 extractive ESI,5–8 laser ablation ESI,9 slug-flow micro-extraction nanoESI,10 and membrane ESI.11,12 Since introduced, DESI received a lot of interest and has become a popular ionization technique in mass spectrometry. DESI allows analysis of both solid and liquid samples with little or no sample preparation. In DESI charged electrospray solvent droplets are directed onto the surface of the sample to be analyzed. The impact of the charged droplets produces gaseous ions of analytes from the sample surface. In the cases of analyzing liquid samples, DESI is also called liquid DESI (L-DESI). In recent years various experimental procedures were reported to achieve L-DESI. These included evaporating liquid sample by a gas jet prior to DESI,13 absorbing liquid sample onto a piece of filter paper,14 aerosolizing liquid sample using nebulizing gas,15 and forming a thin film of liquid sample flowing out from a capillary16 or an HPLC column.17
Microfluidic devices offer unique advantages of lab-on-a-chip such as minimum reagent consumption and multiple function integration.18–20 Coupled with a selective and sensitive mass spectrometric detection these devices have great potentials in bioanalytical applications. In majority of microfluidic mass spectrometric works, ESI was often employed as the ionization source by the virtue of the simplicity of the interface. Microfluidic ESI-MS has been receiving a lot of research interest and becomes very useful in clinical and biomedical studies.21–28
The aim of this study was to develop a microfluidic chip-based L-DESI source for direct ESI-MS analysis of biological fluids. Since microfluidic chips can be fabricated with precision, a microfluidic L-DESI source is expected to be easily reproduced. In this study, a novel concept of voltage-assisted liquid DESI (VAL-DESI) was introduced. Experimental conditions were studied to obtain optimal analytical figures of merit. The proposed microfluidic VAL-DESI-MS method was evaluated for direct analysis of serum, urine, and cell lysate samples to detect chemical compounds of biomedical interest, e.g. peptides and biogenic amines. To demonstrate its applicability in quantitative analysis the method was used to quantify simultaneously intracellular nucleosides, including cytidine, adenosine, uridine, thymidine, and guanosine. 8-Bromoadenosine that was readily available and characteristic in MS spectrum was evaluated as the internal standard for the quantification. Analysis of several cell lines, including lymphoblast TK6 cells, skin melanoma C32 cells, promyelocytic leukemia NB4 cells, and red blood cells was performed. Nucleoside contents and the content ratio of adenosine over deoxyadenosine were determined.
EXPERIMENTAL SECTION
Cell Culture
Lymphoblast TK6 cells, skin melanoma C32 cells, and promyelocytic leukemia NB4 cells were cultured in complete RPMI-1640 media supplemented with 10% fetal bovine serum (FBS) and 1% penicillin streptomycin in 5% CO2 and 100% humidity atmosphere at 37°C. The cells were routinely sub-cultured every 4–5 days. The medium was replaced every 2 days throughout the lifetime for all cultures. Human red blood cells were isolated from one drop of whole blood collected from a healthy subject.
Microchip Fabrication and Channel Pretreatment
The microchip was composed of two glass slides (24 ×40 ×1 mm). A laser engraving machine was used for making channels onto the glass substrate. The glass slides were treated in an air plasma cleaner (PDC-32G, Harrick Plasma, Ithaca, NY) for 5 min (10.5 W and 500mTorr) before being bond together.
To avoid physical adsorption, channels in the microchip were treated with a mixture solution of H2O/HCl/H2O2 (5:1:1) for 5min. They were then washed with deionized water and dried with N2 gas. Prior to use, channels were flushed sequentially with 0.5% hydrogen peroxide, 0.1M NaOH, and then electrospray solvent for 1min each.
MS Measurements
The system consisted of an ion trap mass spectrometer (LCQ Deca, ThermoFinnigan, San Jose, CA), a multi-channel power supply, and a syringe pump. Xcalibur software (ThermoFinnigan) was used to acquire and to process MS data. The MS detection conditions were optimized in positive mode as follows: capillary temperature, 250°C; ion source voltage, 0V; relative collision energy, 20–30%; isolation width, 1.0 u; and activation time, 30ms.
Quantification of Intracellular Nucleosides
Cells were collected by centrifugation (1000 rpm for 10 min) from 2.00 mL cell suspension (1×10⁶ cells/mL). They were washed twice with phosphate buffer solution (PBS, 10mM phosphate at pH 7.4), and then lysed with 0.40mL methanol/water (1:1 v/v). The lysate was extracted with 0.40mL chloroform. The mixture was let stand at −20°C for 1 hour. Aliquots of the supernatant (25 μL each) was transferred to the sample reservoir in the VAL-DESI platform for analysis.
RESULTS AND DISCUSSION
Liquid Desorption Electrospray Ionization (L-DESI) in a Microfluidic Format
Direct analysis by L-DESI-MS was previously reported.13–17 In these studies, L-DESI was achieved by using either a supporting solid surface for the liquid sample or a dual-capillary system. We made effort in this work to perform L-DESI-MS in a miniaturized and robust microfluidic platform. Based on the L-DESI working principle, a microchip was designed and fabricated. It is illustrated by Fig 1a. The microchip has an L-DESI cavity, integrating the electrospray emitter and two independent sample delivery channels. Electrospray droplets are generated from the ESI emitter at the center and may interact equally with the sample solution flowing out from either of the two sample reservoirs. In this chip design, the dimension of the L-DESI cavity determines the distance between the exit of electrospray solvent and that of a sample solution. We evaluated two chip designs with a 1 × 1.5 or 2 × 1.5mm cavity. Comparable results were obtained after minor modifications of experimental conditions such as sampling voltage and flow rate of electrospray solvent. It’s worth mentioning that by the virtue of microfabrication a microfluidic L-DESI source can be easily reproduced with good precision, which is a significant advantage over the experimental set-ups previously reported to achieve L-DESI. The chip was made of two pieces of glass measuring 24 × 40 mm. To minimize the surface area of the ESI emitter, thin glass plates (1 mm in thickness) were used. Microfluidic channels made by using a laser engraving machine were about 20 μm deep and 80 μm wide. Width of the electrospray solvent delivery channel was reduced to 50 μm at the ESI emitter to obtain more stable electrospray.28–29 A picture of the microfluidic chip is shown in Fig 1b. A syringe pump was used to deliver the solvent. An electrode was embedded in the solvent channel to deliver an electrospray voltage of +4kV. Samples were placed in the sample reservoirs and flowed towards the outlet at the L-DESI cavity through the respective sample delivery channels by gravity.
Figure 1.
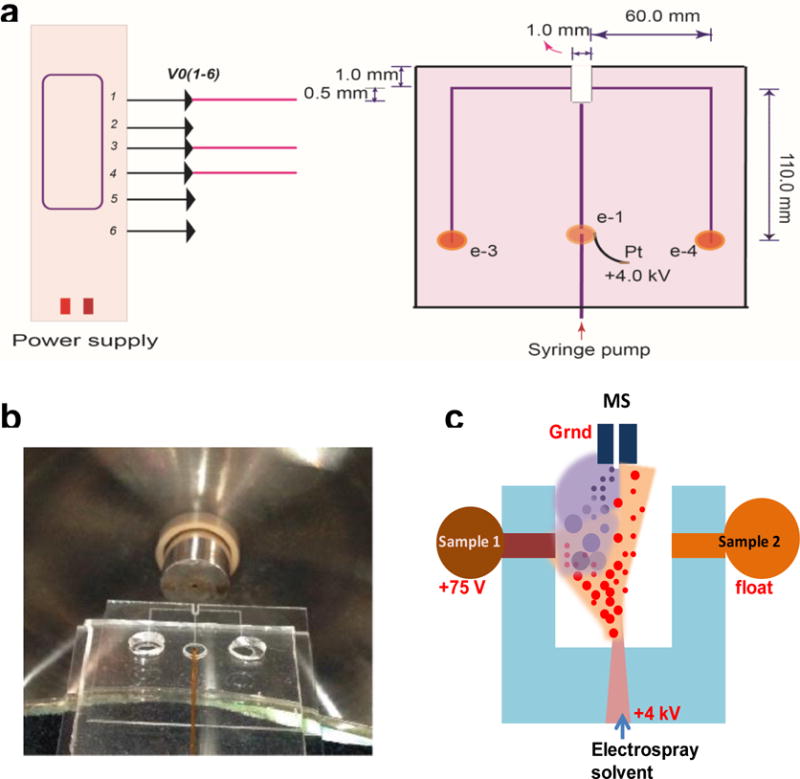
The proposed microfluidic voltage-assisted liquid desorption electrospray ionization (VAL-DESI) source: (a) chip design, (b) a picture of the microfluidic chip prepared, and (c) a schematic illustrating the working principle of the source: the electrospray plume expends towards the “turned on” left sample channel (versus the “turned off” right sample channel) due to a potential difference of 3925V between the electrospray emitter and the sample channel outlet, hitting the sample solution and causing the analytes to desorb.
Unfortunately, our efforts to perform L-DESI-MS analysis with this experimental set-up failed. No MS signal was observed from the sample solution although electrospray was stable and ionization was effective (i.e. a stable electrospray current and a constant MS background signal were obtained). Tests with an increased sample flow rate by raising liquid level in the sample reservoir were also found unsuccessful. This was likely because desorption of analytes caused by the impact of charged electrospray solvent droplets was not efficient enough to be detected. Theoretically, L-DESI can be well achieved on this microfluidic platform if the sample delivery channel is converted into a pneumatic nebulizer to produce sample aerosols. Nevertheless, this approach was not adopted because several disadvantages were foreseen, including: 1) a more complicated and difficult-to-make microfluidic chip would be needed, and 2) blockage of the delicate pneumatic nebulizer by “dirty” samples would be frequent.
Microfluidic Voltage-assisted Liquid Desorption Electrospray Ionization
Interestingly, it was found that effective L-DESI could be achieved with the proposed microfluidic set-up when a low voltage (e.g. +75V) was applied at the sample reservoir. The concept of voltage-assisted liquid desorption electrospray ionization (VAL-DESI) was, therefore, introduced. The working principle is illustrated by Fig. 1c. By applying a low voltage at the sample reservoir an electrical circuit is formed between the ESI emitter and the exit of sample solution. In this case, the charged electrospray solvent droplets are driven towards the sample solution flowing out the sample delivery channel by a potential difference of 3975V. The reinforced interaction enhances desorption of analytes from the sample solution and allows subsequent MS detection.
To demonstrate the microfluidic VAL-DESI technique, urine (diluted with PBS at 1+1) and bovine serum (diluted with PBS at 1+9) spiked with caffeine at low concentrations were analyzed. The results indicate that from both types of biofluid sample matrices caffeine desorbed and was ionized effectively, producing detectable MS signals with good sensitivity and repeatability. Fig 2a shows a typical MS spectrum from analysis of a bovine serum sample containing 6.0×10⁻⁹ M caffeine. Many ions, including [caffeine + H]+ m/z 195, were detected. The MS/MS spectrum (Fig 2b) of ion m/z 195 confirms caffeine identity. Ion transition m/z 195 →138 was monitored for MS/MS quantification of caffeine present in samples. For comparison, an MS spectrum obtained from a PBS solution spiked with caffeine at the same concentration was obtained (Fig S1). The abundance of ion m/z 195 is about 15% higher than that from the serum sample solution. Effects of sampling voltage on peak height were investigated in a range from 0 to 250V. As shown in Fig 2c, the optimal voltage range was from 50 to 100V. These results indicate that a low voltage applied at the sample reservoir is needed to achieve an effective liquid desorption electrospray ionization in this case. It should be pointed out that the optimal value of the sampling voltage may change if the geometry and dimension of the L-DESI cavity are changed. Long term stability of the proposed VAL-DESI source was investigated by monitoring ion transition m/z 195 →138 continuously over a 10min run. Signal intensity showed a horizontal trend with a fluctuation range of < ±8.1% of the average. In these experiments, diluted urine and serum samples were analyzed. Dilution of urine samples may not be needed for the assay. However, dilution of biofluid samples, particularly the ones of high viscosity (e.g. serum) always helps the sample to flow smoothly from the reservoir to the L-DESI cavity. From these results, the repeatability of the proposed VAL-DESI source is comparable to that of a conventional ESI source, and it’s well suited for direct MS analysis of physiological fluid samples of high salt or protein content.
Figure 2.
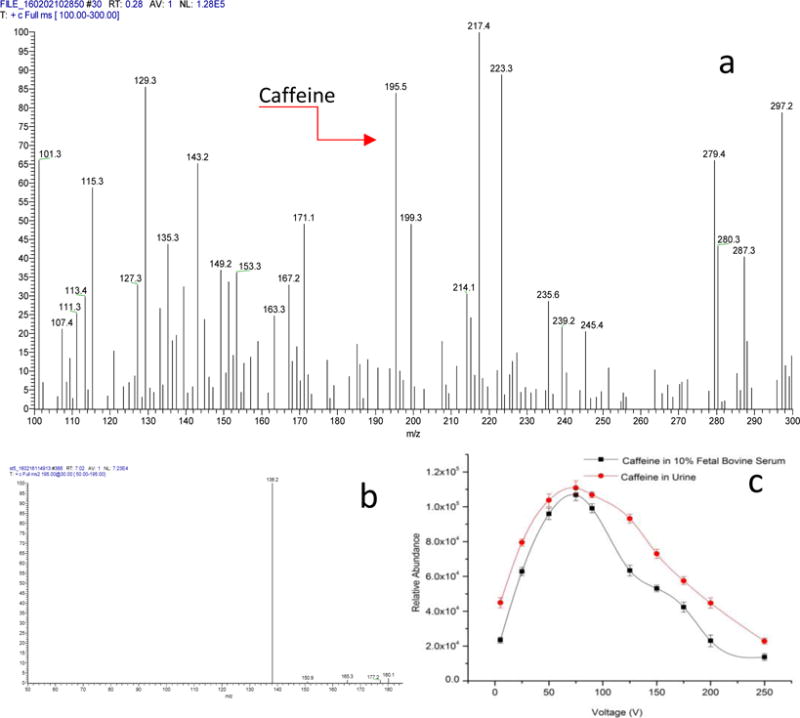
VAL-DESI-MS detection of caffeine in urine and serum samples: (a) a typical MS spectrum obtained from analysis of a serum sample spiked with caffeine at 6.0×10⁻⁹ M, showing detection of [caffeine + H]+ m/z 195; (b) MS/MS spectrum of ion m/z 195, confirming caffeine identity; and (c) effects of sampling voltage on m/z 195 →138 abundance. Experimental conditions: ESI voltage, +4kV; sampling voltage, +75V for (a) and (b); electrospray solvent flow rate, 250nL/min; serum sample, bovine serum diluted with PBS (1+9); and urine sample, urine from a healthy subject diluted with PBS (1+1).
Direct Analysis by Microfluidic VAL-DESI-MS/MS
To achieve an optimal analytical performance, effects of experimental conditions were investigated. A standard solution of dihydroxyphenylalanine (DOPA, 0.60μM) prepared in urine (diluted with PBS at 1+1) was analyzed as the test sample in these experiments. Content of methanol in electrospray solvent was studied in a range from 20% to 100%. Best results were obtained with a solvent containing methanol in a range from 60% to 80% (v/v) as shown in Fig 3A. Formic acid was also added to the electrospray solvent as an electrolyte. Its concentration affected significantly the MS signal. Results obtained from electrospray solvents containing 0, 0.05, 0.1, 0.2, 0.5, 1.0, 1.5, and 2.0% formic acid are shown in Fig 3B. A concentration range from 0.2 to 1.0% was found useful, and a less acidic spray solvent with 0.25% formic acid was chosen for further tests. Effects of the flow rate of electrospray solvent were studied over a range from 0.1 to 2 μL/min. Data is shown in Fig 3C. An optimal range from 0.2 to 0.5 μL/min was established. After these tests, the selected conditions for VAL-DESI-MS analysis were as follows: 80% methanol with 0.25% formic acid as electrospray solvent at a flow rate of 250nL/min, electrospray voltage of +4kV, and sampling voltage of +75V. A set of 5 urine samples containing DOPA at various concentrations from 0.20 to 10.0 μM was analyzed with monitoring the characteristic ion transition m/z 181→152. Triplicate analyses were performed for each sample. Abundance of ion m/z 152 was used for establishing the calibration curve. Regression analysis of the abundance-concentration (μM) data yielded a linear calibration equation of Y=482430 X + 269720 with r2 value of 0.997 (Fig 3D). Assay repeatability was assessed by analyzing a urine sample containing 0.50 μM DOPA five times. The relative standard deviation (RSD) was found to be 6.2% (n=5), which is comparable with that of typical ESI-MS analyses. As well known, the assay repeatability can be significantly improved by using the isotope dilution technique. The limit of detection was estimated to be 55 nM DOPA (signal/noise = 3, where noise was the standard deviation in MS signal at the same m/z for five measurements from a blank sample).
Figure 3.
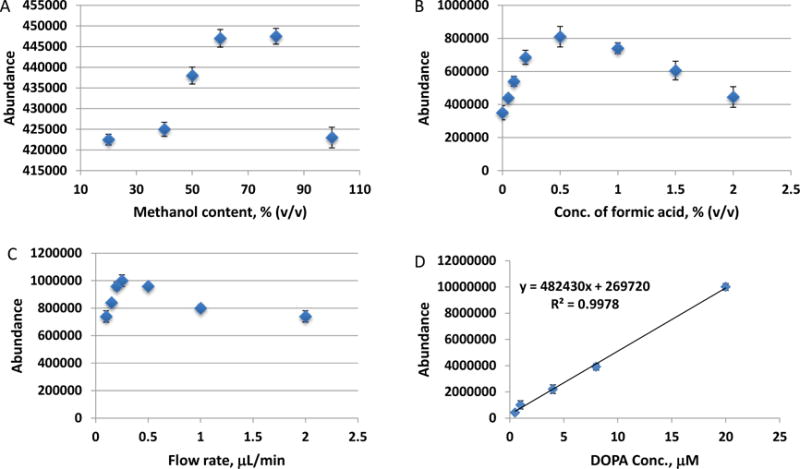
Effects of experimental conditions on VAL-DESI-MS analysis of DOPA in urine samples: (A) methanol content in electrospray solvent; (B) concentration of formic acid in electrospray solvent; (C) flow rate of electrospray solvent; and (D) calibration curve for quantification of DOPA in urine. Data are shown as mean ± SD.
To investigate the applicability of the present direct MS analysis to other classes of molecules, angiotensin II and GSH were spiked into urine samples at 5.0 μM and quantified. Both peptides could be detected and firmly identified by their MS/MS spectra. Fig S2 shows the MS spectra obtained from the analyses. In the case of angiotensin II, both [M+2H]2+ (m/z 502) and [M+H]+ (m/z 1002) were seen in the spectrum. Usefulness of the proposed ionization source for negative ion detection was also investigated. Adenosine monophosphate (AMP) was spiked into a PBS (pH 7.4) solution at 5.0 × 10⁻⁶M, and the solution was analyzed by negative ion detection mode. As shown in Fig S3, AMP was detected as ion [AMP-H]− of m/z 346, and the MS2 spectrum firmly verified the identity of AMP. The above results indicate that the proposed microfluidic VAL-DESI source is useful for analyzing a wide spectrum of molecule classes in both positive and negative ion detection modes. Showing a remarkable tolerance to matrix effects and good analytical figures of merit, the VAL-DESI-MS/MS method holds an enormous potential in direct analysis of biofluids with minimum sample preparation.
Simultaneous Analysis of two Samples with the VAL-DESI Source
In this proof –of-concept ionization source, two independent sample delivery channels/reservoirs are included although the number of samples can be increased to multiples. A set of experiments were performed to evaluate the potential of this source in simultaneous analysis of multiple samples. In these experiments, two samples are respectively placed in the two sample reservoirs in the chip and alternatively analyzed for as many times as choose to in an automated manner. Urine samples (1+1 diluted with PBS) containing tryptophan (Trp, at 2.0×10⁻⁶ M) or serotonin (5-HT, at 5.0×10⁻⁷ M) were used as model samples. A sampling voltage of +75V was applied to only one of the two sample reservoirs, and automatically switched between them every 60s during a 15min alternating analysis. An electrospray voltage of 4kV was maintained through the whole run. The MS detector was set in MRM mode, monitoring continuously ion transitions m/z 205→188 (for Trp) and 177→160 (for 5-HT). Fig 4 shows the typical results obtained. From the two extracted mass abundance traces Trp and 5-HT were alternatively detected with good repeatability. Importantly, no memory effects were observable between switches of samples even though the analytical signals from the two samples differed more than 10 times in intensity. Although only two samples were analyzed in this proof-of-concept work, simultaneous analysis of multiple samples can be achieved by increasing the number of sample delivery channels/reservoirs in the microfluidic chip. The present method has, thus, a potential in high through-put ESI-MS analysis with good repeatability and accuracy, particularly when isotope dilution is used. Methods deploying microfluidic chips with dual or multiple emitters for high through-put ESI-MS analysis or for improved accuracy in MS calibration were reported previously.30–35 Compared with those microchips, a significant advantage of the present chip lies in that only a single ESI emitter is needed to achieve multiple sample analysis. Due to the simplicity in its design, the microchip is possible to make with cheap materials such as paper and glass, which is highly desirable for preparing disposable point-of-care microfluidic chips.
Figure 4.
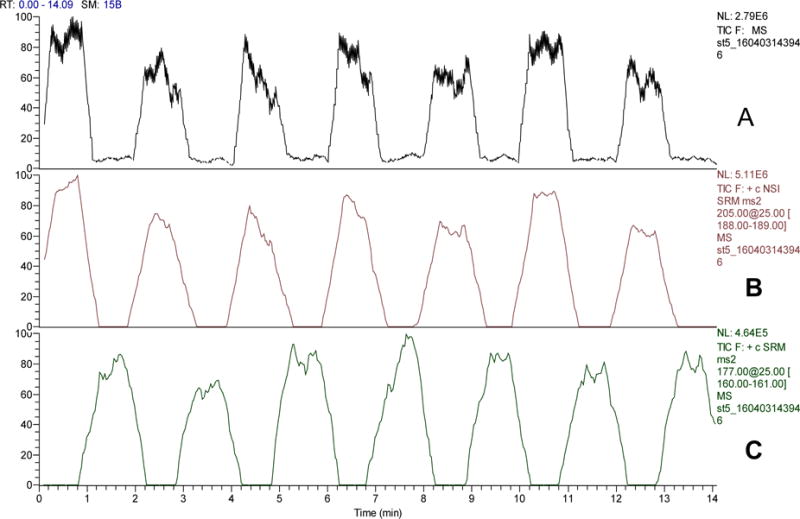
Automated dual sample analysis by VAL-DESI-MS/MS: (A) TIC mass abundance trace obtained from the analysis; (B) m/z 205➔ 188 extracted mass abundance trace for detection of Trp from the Trp-containing urine sample (2.0 μM Trp); and (C) m/z 177➔ 160 extracted mass abundance trace for detection of 5-HT from 5-HT-containing urine sample (0.50 μM 5-HT). Experimental conditions were as in Fig 2.
Quantification of intracellular nucleosides by VAL-DESI-MS/MS
Nucleosides and their metabolites play important roles in various biochemical processes. Measurement of their levels in biofluids or tissue specimen has been proposed for diagnosis of diseases such as cancers and AIDS.36–38 Intracellular levels of nucleosides in red blood cells are used to evaluate the energy status of erythrocytes, inhibition of DNA synthesis, and degradation of phosphorylated compounds and nucleic acids.39–40 Therefore, a lot of research effort has been made to develop analytical methods for quantification of nucleosides, their analogs, and their metabolites. Most of the current analytical methods involve HPLC separations, which limits sample throughput. The analytical results of nucleosides found in literature have a very broad range from pmol/106 cells,39, 41 nmol/106 cells,40, 42 to μmol/106 cells.43–44 In this work, direct analysis of cell lysates by the proposed microfluidic VAL-DESI-MS/MS method was carried out for simultaneous quantification of cytidine, adenosine, uridine, thymidine, and guanosine in lymphoblast TK6 cells. The cells were collected from cell cultures, lysed, and the lysates were loaded into the sample reservoir for direct analysis without any further pretreatment. 8-Bromoadenosine was added to the cell lysates as internal standard (IS). 8-Bromoadenosine that possesses a chemical structure similar to the targeted analytes is commercially available and inexpensive. It does not occur naturally in mammalian cells. In addition, the two isotopes of bromine in its structure allow for unequivocal identification of the internal standard added in the cell lysate samples. Figure 5 shows the chemical structures of the compounds involved and their MS/MS spectra obtained. For each nucleoside tested a characteristic product ion was obtained. For simultaneous quantification, ion transitions, i.e. m/z 244 → 112 for cytidine, m/z 268 → 136 for adenosine, m/z 245 → 113 for uridine, m/z 243 → 127 for thymidine, m/z 284 → 152 for guanosine, and m/z 348 → 216 for 8-bromoadenosine (internal standard) were monitored by using MRM detection mode. Five-point calibration curves were prepared with authentic nucleoside solutions at concentrations ranging from 0.10 to 10.00 μM prepared in the cell lysing solution. As shown in Fig S4, linear calibrations were obtained for all the five analytes with r2 values of >0.991. Detection limits (signal/noise = 3, where noise was the standard deviation in MS signal at the same m/z for five measurements from a blank sample) ranged from 0.42μM for guanosine to 0.86 μM for thymidine. Analysis of three TK 6 cell lysates found cytidine at 2.9 ± 0.21nmole/106 cells, adenosine at 26.5 ± 0.57nmole/106 cells, uridine at 4.1 ± 0.39nmole/106 cells, thymidine at 3.1 ± 0.31nmole/106 cells, and guanosine at 3.5 ± 0.21nmole/106 cells. These results are in consistent with those reported previously,39–44 suggesting that the proposed assay offers a convenient and effective means to simultaneously quantify multiple nucleosides in biofluids. Compared with HPLC-MS/MS analyses, the present assay has the advantage of high sample throughput, requiring <1 min per sample.
Figure 5.
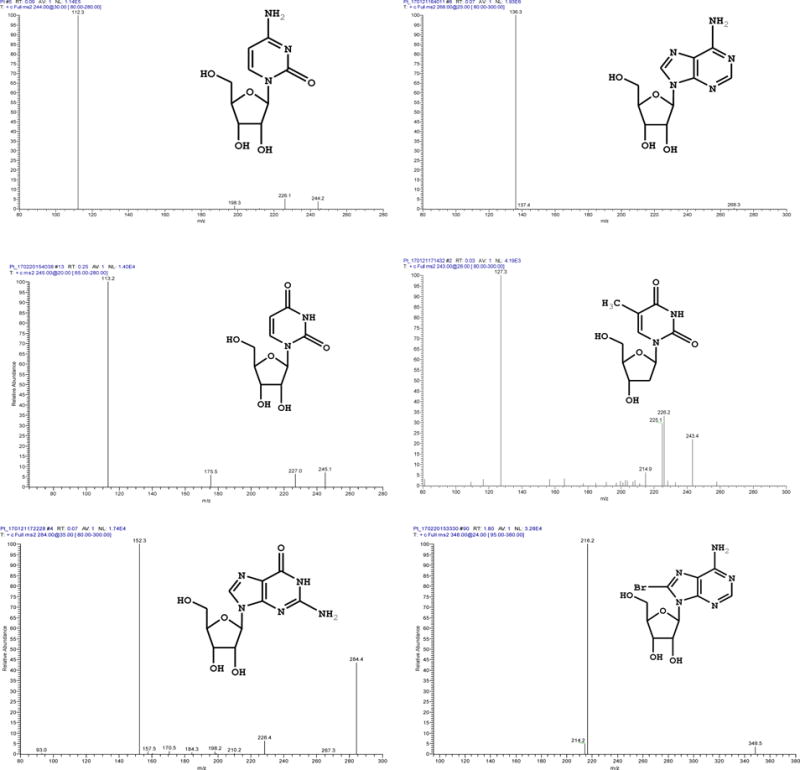
Chemical structures and MS2 spectra of nucleosides and internal standard involved in the quantitative analysis. VAL-DESI-MS conditions were as in Fig 2.
Deoxyadenosine, a derivative of adenosine, is one of the four nucleoside components of DNA. It’s well known that adenosine deaminase deficiency and the resultant accumulation of deoxyadenosine are associated with profound T cell dysfunction and variable B cell dysfunction.45 In this work, deoxyadenosine and adenosine levels in red blood cells and three cancerous cell lines were determined by using the proposed microfluidic VAL-DESI-MS/MS method. For the quantification, ion transitions, i.e. m/z 252 → 136 for deoxyadenosine (see Fig S5 for the MS2 spectrum) and m/z 268 → 136 for adenosine were monitored. Fig 6 shows the typical data obtained from analysis of red blood cells and promyelocytic leukemia NB4 cells. From the two extracted mass abundance traces, deoxyadenosine and adenosine were both detected at the nmol/106 cells level in these cell lines. However, the content ratio of adenosine/deoxyadenosine was found varying: red blood cells (1.07 ± 0.06, n=3), lymphoblast TK6 (0.52 ± 0.02, n=3), skin melanoma C32 (0.82 ± 0.04, n=3), and promyelocytic leukemia NB4 cells (0.38 ± 0.06, n=3). It’s worth noting that the content ratios of adenosine/deoxyadenosine in cancerous cells are significantly lower than that in red blood cells. To our knowledge this is the first report on the variation in intracellular adenosine/deoxyadenosine ratio.
Figure 6.
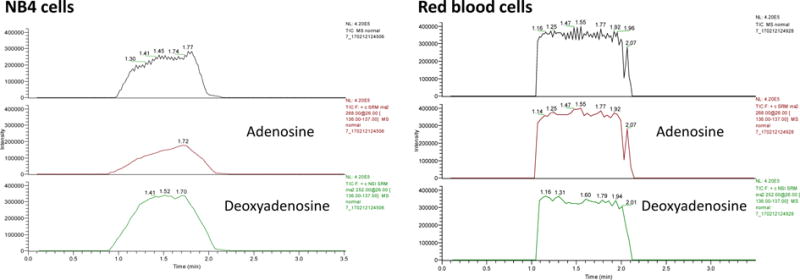
TIC and extracted mass intensity traces from simultaneous determination of adenosine and deoxyadenosine in cell lysates, indicating the content ratio of adenosine/deoxyadenosine in red blood cells is significantly higher than that in promyelocytic leukemia NB4 cells. VAL-DESI-MS conditions were as in Fig 2.
CONCLUSIONS
An innovative microfluidic voltage-assisted liquid desorption electrospray ionization (VAL-DESI) source has been developed for direct mass spectrometric analysis. Results from direct analysis of urine, serum, and cell lysate samples indicate that the proposed microfluidic VAL-DESI-MS/MS method is sensitive, reproducible, and easy to carry out. Compared with the liquid DESI works previously reported, the present microfluidic VAL-DESI source is easy to set-up and operate, and more robust as well. Further, due to the simplicity in its design and operation, the source can be easily fabricated as a disposable device from cheap materials such as glass and paper. It, therefore, holds a good potential in point-of-care chemical measurements for diagnosis and treatment evaluation purposes.
Supplementary Material
Acknowledgments
Financial support from US National Institutes of Health (GM089557 and partially G12MD007581) is gratefully acknowledged.
Footnotes
Supporting Information
The Supporting Information is available free of charge on the ACS Publications website at DOI:
Materials; Detection of caffeine at 6.0 × 10⁻⁹M in PBS solution; Detection of angiotensin and GSH in urine by VAL-DESI-MS; Detection of adenosine monophosphate by VAL-DESI-MS in negative ion detection mode; Calibration curves for nucleoside quantification; MS2 spectrum of deoxyadenosine. (PDF)
Notes
The authors declare no competing financial interest.
References
- 1.Takats Z, Wiseman JM, Gologan B, Cooks RG. Science. 2004;306:471–473. doi: 10.1126/science.1104404. [DOI] [PubMed] [Google Scholar]
- 2.Wiseman JM, Ifa DR, Song Q, Cooks RG. Angew Chem Int Ed. 2006;45:7188–7192. doi: 10.1002/anie.200602449. [DOI] [PubMed] [Google Scholar]
- 3.Laskin J, Heath BS, Roach PJ, Cazares L, Semmes OJ. Anal Chem. 2011;84:141–148. doi: 10.1021/ac2021322. [DOI] [PMC free article] [PubMed] [Google Scholar]
- 4.Venter AR, Douglass KA, Shelley JT, Hasman G, Jr, Honarvar E. Anal Chem. 2013;86:233–249. doi: 10.1021/ac4038569. [DOI] [PubMed] [Google Scholar]
- 5.Chang D-Y, Lee C-C, Shiea J. Anal Chem. 2002;74:2465–2469. doi: 10.1021/ac010788j. [DOI] [PubMed] [Google Scholar]
- 6.Chen H, Venter A, Cooks RG. Chem Commun. 2006:2042–2044. doi: 10.1039/b602614a. [DOI] [PubMed] [Google Scholar]
- 7.Chen H, Zenobi R. Nat Protoc. 2008;3:1467–1475. doi: 10.1038/nprot.2008.109. [DOI] [PubMed] [Google Scholar]
- 8.Chen H, Yang S, Li M, Hu B, Li J, Wang J. Angew Chem Int Ed. 2010;49:3053–3056. doi: 10.1002/anie.200906886. [DOI] [PubMed] [Google Scholar]
- 9.Nemes P, Vertes A. Anal Chem. 2007;79:8098–8106. doi: 10.1021/ac071181r. [DOI] [PubMed] [Google Scholar]
- 10.Ren Y, McLuckey MN, Liu J, Ouyang Z. Angew Chem Int Ed. 2014;53:14124–14127. doi: 10.1002/anie.201408338. [DOI] [PMC free article] [PubMed] [Google Scholar]
- 11.Sun X, Kelly RT, Tang K, Smith RD. Anal Chem. 2011;83:5797–5803. doi: 10.1021/ac200960h. [DOI] [PMC free article] [PubMed] [Google Scholar]
- 12.Zhang M, Lin F, Xu J, Xu W. Anal Chem. 2015;87:3123–3128. doi: 10.1021/acs.analchem.5b00467. [DOI] [PubMed] [Google Scholar]
- 13.Dénes J, Katona M, Hosszú A, Czuczy N, Takáts Z. Anal Chem. 2009;81:1669–1675. doi: 10.1021/ac8024812. [DOI] [PubMed] [Google Scholar]
- 14.Mulligan CC, MacMillan DK, Noll RJ, Cooks RG. Rapid Comm Mass Spectrom. 2007;21:3729–3736. doi: 10.1002/rcm.3270. [DOI] [PubMed] [Google Scholar]
- 15.Ma X, Zhao M, Lin Z, Zhang S, Yang C, Zhang X. Anal Chem. 2008;80:6131–6136. doi: 10.1021/ac800803x. [DOI] [PubMed] [Google Scholar]
- 16.Miao Z, Chen H. J Am Soc Mass Spectrom. 2009;20:10–19. doi: 10.1016/j.jasms.2008.09.023. [DOI] [PubMed] [Google Scholar]
- 17.Zhang Y, Yuan Z, Dewald HD, Chen H. Chem Commun. 2011;47:4171–4173. doi: 10.1039/c0cc05736c. [DOI] [PubMed] [Google Scholar]
- 18.Thorsen T, Maerkl SJ, Quake SR. Science. 2002;298:580–584. doi: 10.1126/science.1076996. [DOI] [PubMed] [Google Scholar]
- 19.Nge PN, Rogers CI, Woolley AT. Chem Rev. 2013;113:2550–2583. doi: 10.1021/cr300337x. [DOI] [PMC free article] [PubMed] [Google Scholar]
- 20.Sun M, Vanapalli SA. Anal Chem. 2013;85:2044–2048. doi: 10.1021/ac303526y. [DOI] [PubMed] [Google Scholar]
- 21.Hoffmann P, Häusig U, Schulze P, Belder D. Angew Chem Int Ed. 2007;46:4913–4916. doi: 10.1002/anie.200605152. [DOI] [PubMed] [Google Scholar]
- 22.Sikanen T, Tuomikoski S, Ketola RA, Kostiainen R, Franssila S, Kotiaho T. Anal Chem. 2007;79:9135–9144. doi: 10.1021/ac071531+. [DOI] [PubMed] [Google Scholar]
- 23.Koster S, Verpoorte E. Lab Chip. 2007;7:1394–1412. doi: 10.1039/b709706a. [DOI] [PubMed] [Google Scholar]
- 24.Zamfir AD. J Chromatogr A. 2007;1159:2–13. doi: 10.1016/j.chroma.2007.03.115. [DOI] [PubMed] [Google Scholar]
- 25.Lee J, Soper SA, Murray KK. J Mass Spectrom. 2009;44:579–593. doi: 10.1002/jms.1585. [DOI] [PubMed] [Google Scholar]
- 26.Mellors JS, Jorabchi K, Smith LM, Ramsey JM. Anal Chem. 2010;82:967–973. doi: 10.1021/ac902218y. [DOI] [PMC free article] [PubMed] [Google Scholar]
- 27.Neuži P, Giselbrecht S, Länge K, Huang TJ, Manz A. Nat Rev Drug Discov. 2012;11:620–632. doi: 10.1038/nrd3799. [DOI] [PMC free article] [PubMed] [Google Scholar]
- 28.Li X, Xiao D, Ou XM, McCullm C, Liu YM. J Chromatogr A. 2013;1318:251–256. doi: 10.1016/j.chroma.2013.10.020. [DOI] [PMC free article] [PubMed] [Google Scholar]
- 29.Li X, Hu H, Zhao S, Liu Y-M. Anal Chem. 2016;88:5338–5344. doi: 10.1021/acs.analchem.6b00638. [DOI] [PMC free article] [PubMed] [Google Scholar]
- 30.Kelly RT, Page JS, Tang K, Smith RD. Anal Chem. 2007;79:4192–4198. doi: 10.1021/ac062417e. [DOI] [PubMed] [Google Scholar]
- 31.Kim W, Guo M, Yang P, Wang D. Anal Chem. 2007;79:3703–3707. doi: 10.1021/ac070010j. [DOI] [PubMed] [Google Scholar]
- 32.Mao P, Wang H-T, Yang P, Wang D. Anal Chem. 2011;83:6082–6089. doi: 10.1021/ac2011813. [DOI] [PMC free article] [PubMed] [Google Scholar]
- 33.Chambers AG, Ramsey JM. Anal Chem. 2012;84:1446–1451. doi: 10.1021/ac202603s. [DOI] [PubMed] [Google Scholar]
- 34.Mao P, Gomez-Sjoberg R, Wang D. Anal Chem. 2012;85:816–819. doi: 10.1021/ac3032965. [DOI] [PMC free article] [PubMed] [Google Scholar]
- 35.Li Y, Zhang N, Zhou Y, Wang J, Zhang Y, Wang J, Xiong C, Chen S, Nie Z. J Am Soc Mass Spectrom. 2013;24:1446–1449. doi: 10.1007/s13361-013-0670-5. [DOI] [PubMed] [Google Scholar]
- 36.Stagg J, Smyth MJ. Oncogene. 2010;29:5346–5358. doi: 10.1038/onc.2010.292. [DOI] [PubMed] [Google Scholar]
- 37.Clayton A, Al-Taei S, Webber J, Mason MD, Tabi Z. J Immunol. 2011;187:676–683. doi: 10.4049/jimmunol.1003884. [DOI] [PubMed] [Google Scholar]
- 38.Antonioli L, Blandizzi C, Pacher P, Haskó G. Nature Rev Cancer. 2013;13:842–857. doi: 10.1038/nrc3613. [DOI] [PubMed] [Google Scholar]
- 39.Traut TW. Molecular and Cellular Biochem. 1997;140:1–22. doi: 10.1007/BF00928361. [DOI] [PubMed] [Google Scholar]
- 40.Fredholm BB. Cell Death and Differentiation. 2007;14:1315–1323. doi: 10.1038/sj.cdd.4402132. [DOI] [PubMed] [Google Scholar]
- 41.Sampol J, Dussol B, Fenouillet E, Capo C, Mege J, Halimi G, Bechis G, Brunet P, Rochat H, Berland Y, Guieuj R. J Am Soc Nephrol. 2001;12:1721–1728. doi: 10.1681/ASN.V1281721. [DOI] [PubMed] [Google Scholar]
- 42.Marquardt DL, Gruber HE, Wasserman SI. Proc Nati Acad Sci USA. 1984;81:6192–6196. doi: 10.1073/pnas.81.19.6192. [DOI] [PMC free article] [PubMed] [Google Scholar]
- 43.Jie G, Yuan J, Zhang J. Biosensors Bioelectronics. 2012;31:69–76. doi: 10.1016/j.bios.2011.09.047. [DOI] [PubMed] [Google Scholar]
- 44.Tian CY, Xu JJ, Chen HY. Chem Commun. 2012;48:8234–8236. doi: 10.1039/c2cc34229d. [DOI] [PubMed] [Google Scholar]
- 45.Sampol J, Dussol B, Fenouillet E, Capo C, Mege J-L, Halimi G, Bechis G, Brunet P, Rochat H, Berland Y. J Amer Soc Nephrol. 2001;12:1721–1728. doi: 10.1681/ASN.V1281721. [DOI] [PubMed] [Google Scholar]
Associated Data
This section collects any data citations, data availability statements, or supplementary materials included in this article.


