Abstract
Next generation sequencing (NGS) is widely applied in immunological research, but has yet to become common in antibody epitope mapping. A method utilizing a 12-mer random peptide library expressed in bacteria coupled with magnetic-based cell sorting and NGS correctly identified more than 75% of epitope residues on the antigens of two monoclonal antibodies (trastuzumab and bevacizumab). PepSurf, a web-based computational method designed for structural epitope mapping was utilized to compare peptides in libraries enriched for monoclonal antibody (mAb) binders to antigen surfaces (HER2 and VEGF-A). Compared to mimotopes recovered from Sanger sequencing of plated colonies from the same sorting protocol, motifs derived from sets of the NGS data improved epitope prediction as defined by sensitivity and precision, from 18% to 82% and 0.27 to 0.51 for trastuzumab and 47% to 76% and 0.19 to 0.27 for bevacizumab. Specificity was similar for Sanger and NGS, 99% and 97% for trastuzumab and 66% and 67% for bevacizumab. These results indicate that combining peptide library screening with NGS yields epitope motifs that can improve prediction of structural epitopes.
Keywords: Structural epitope, next generation sequencing, PepSurf, epitope mapping, random peptide display libraries
1. Introduction
Many antibodies bind structurally-defined epitopes within their antigens. The amino acid residues in these epitopes are discontinuous (i.e., not sequentially continuous) and rely on secondary and higher structures to create the binding surface. This discontinuity and conformational dependence significantly increases the difficulty of identifying discontinuous, as compared to continuous epitopes where sequence similarity can be used. Only a few studies have attempted to estimate how many epitopes might have a structural component; an early estimate by Barlow still widely cited suggested that less than 10% of epitope surfaces are composed of completely sequentially continuous residues [Barlow et al., 1986]. A more recent study of 47 proteins with discontinuous epitopes (i.e. comprised of several segments) found that more than 45% of the epitope segments were comprised of single residues, and the longest segments averaged 4 to 7 residues [Haste Anderson et al., 2006].
Experimental and computational methods have been developed to predict antibody interaction with epitopes [Ahmed et al., 2016], though definitive interface determination is generally reliant upon crystallography or NMR. Computational, or in silico, docking algorithms have proven useful when the structures of both antibody and antigen are known [Meng et al., 2011; Kuroda et al., 2012; Rapburger et al., 2007; Chakrabarti & Janin, 2002]. Binding assays based upon ELISA and protein or peptide microarrays can identify potential epitope sections by assessing antibody binding to antigen fragments. Similarly, peptide display technologies have proven useful to identify peptide sequences, in random [Daugherty, 2007; Wentzel et al., 2001] and antigen- or organism-derived libraries [Angelini et al., 2015] that interact with an antibody of interest. Mimotopes, library-derived peptides that mimic the antigen epitope, can help identify epitope residues for targeted studies such as mutagenesis, wherein reduced binding indicates the importance of a residue within the epitope [Hudson et al., 2012; Reimer et al., 2005].
Epitope mapping via peptide display is dependent primarily upon library design, enrichment methods, determination of peptide sequences, and epitope prediction from sequence data. While libraries derived from protein sequences are common, large random peptide libraries (e.g., >109 members) can provide advantages in terms of their ability to yield peptides that mimic diverse structural epitopes. Typically, several rounds of selection or screening are performed to enrich binders to the antibody of interest. The enriched library typically consists of a few highly-represented sequences that can be identified via sequencing the encoding DNA. When mapping suspected structural epitopes, algorithms that seek to match these mimotopes with residue paths along the antigen’s surface are typically employed. Examples include PepSurf, EpiSearch and Pep-3D-Search [Mayrose et al., 2006; Negi & Braun, 2009; Huang et al., 2008]. Applied against a benchmark set of known epitopes, the algorithms typically report less than 50% average sensitivity (defined as the percentage of true positive residues in a predicted set) and precision (defined as the ratio of true to false interface residues in a predicted set) [Negi & Braun, 2009; Huang et al., 2008; Sun et al., 2011; Chen et al., 2012].
The wide availability of massively parallel or next generation sequencing (NGS) provides a potential means to improve mapping algorithm performance. Sanger sequencing provides high quality, low error reads of small DNA sequences, aspects which have traditionally been considered necessary for epitope mapping. Recently, NGS has been coupled with random peptide libraries in studies aimed at identifying immunogenic peptides [Heyduk & Heyduk, 2014; Christiansen et al., 2015]. Another utilized NGS with antigenic fragment libraries to map epitopes [Domina et al., 2014]. Each group developed a unique computational method for manipulation of the NGS datasets. Based on these studies, we hypothesized that large NGS datasets could provide a more complete set of mimotopes that would improve the ability of current computational mapping methods to identify epitope residues. To investigate this idea, a large random peptide library displayed on E. coli was enriched for antibody binding via magnetic-activated cell sorting (MACS), and antibody-binding sequences were determined using NGS to develop a method and assess the benefit of using large datasets in structural epitope mapping. The method identifies antibody-binding residues of a known antigen using currently available epitope mapping algorithms.
2. Materials and Methods
2.1 Identification of antibody-binding peptides via bacterial display peptide libraries
Antibody selection
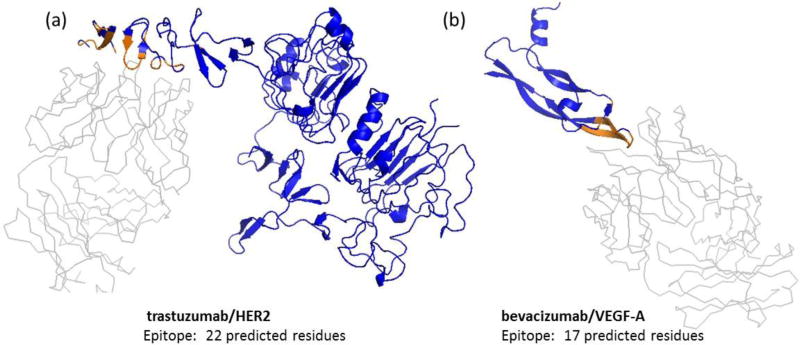
Two monoclonal antibodies, trastuzumab (Herceptin®) and bevacizumab (Avastin®), were selected to benchmark the protocol because their structures complexed with antigen have been previously determined (trastuzumab/HER2 PDB ID 1n8z, bevacizumab/VEGF-A PDB ID 1bj1). The interface for each antibody-antigen complex was determined using PyMOL v1.3 with the Interface Residues python script, which employs a cutoff value for the difference in the solvent-accessible areas of each protein to determine interface residues. Using a cutoff value of 0.75, PyMOL predicted the HER2 portion of the trastuzumab/HER2 interface contains 22 residues and VEGF-A portion contains 17 residues. In both antigens, the interface region contains non-contiguous sequences (Figure 1). These regions, considered the binding epitopes for this study, agree with reported interface regions for trastuzumab/HER2 [Cho et al., 2003] and bevacizumab/VEGF-A [Muller et al., 1998] (Table S1).
Figure 1. NGS-based epitope prediction was utilized to predict the epitopes of therapeutic monoclonal antibodies (trastuzumab and bevacizumab).
(a) trastuzumab binds to human epidermal growth factor receptor HER2 (PDB 1n8z), and (b) bevacizumab binds to vascular endothelial growth factor VEGF-A (PDB 1bj1). Antigen in blue, antibody in grey, and antigen interface residues predicted by PyMOL in brown. Interface residues compared well with reported epitope residues.
2.1.1 Bacterial display library
A large, random (8 × 10⁹ independent transformants) 12-mer peptide library displayed on the N-terminus of a transmembrane protein scaffold of E. coli (eCPX) [Pantazes et al., 2016; Rice & Daugherty, 2008] was used in this study. The screening protocol described here was based on previously reported methods [Kenrick et al., 2007] and is detailed in Figure S1. E. coli strain MC1061 [FaraΔ 139 D(ara-leu)7696 GalE15 GalK16 Δ (lac)X74 rpsL (StrR) hsdR2 (rK−mK +) mcrA mcrB1] was used with surface display vector pB33eCPX.
2.1.2 Confirm selected antibodies do not bind to cells expressing only the scaffold
To confirm that the selected antibodies did not bind to E. coli, an induced cell culture expressing only the library scaffold was incubated with each antibody, diluted to 25 nM (Figure S1b). Cultures were grown overnight at 37 °C with shaking (250 rpm) in LB (10 g tryptone, 5 g yeast extract, 10 g/L NaCl) supplemented with 34 µg/mL chloramphenicol (CM). Cells were inoculated at 1:50 into 5 mL LB/CM and grown to an OD600 between 0.4 – 0.6 at 37 °C with 250 rpm shaking, and then induced with 0.04% wt/vol L(+)-arabinose and allowed to grow for another hour. A 5 µL aliquot of cells was centrifuged at 3000 relative centrifugal force (rcf) at 4°C for 5 minutes and decanted. Cells were incubated with antibody diluted to 25 nM in 40 µL PBST (PBS + 0.05% Tween 20) at 4°C for 45 minutes on an orbital shaker (20 rpm). Following antibody incubation, the cells were washed to remove unbound antibodies by centrifuging, decanting and resuspending the cells in 40 µL cold PBST 3 times. To the final resuspension, α-IgG-PE (anti- human goat IgG conjugated to phycoerythrin) was added at 1:100, and the cells were incubated at the same conditions. Following a single wash step, the cells were resuspended in 500 µL cold PBS and analyzed for fluorescence using flow cytometry (BD Biosciences FACSARIA I with a FACSARIA II flow cell). As expected, neither antibody bound to the E. coli cells expressing only the eCPX scaffold.
2.1.3 Magnetic-activated cell selection (MACS)
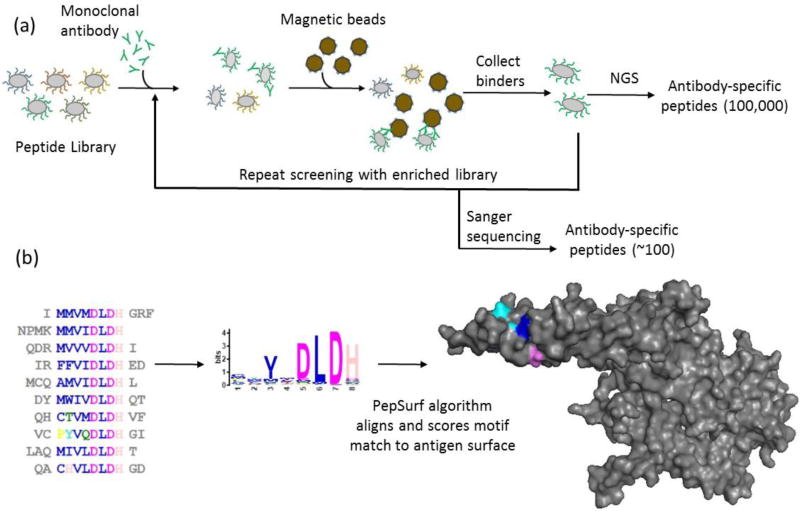
Magnetic selection enriches the library for antibody-binding peptides using magnetic beads functionalized with a blend of proteins A and G (Pierce), which bind to the constant region of an antibody. Figure 2a summarizes the experimental protocol; additional detail is provided in Figure S1a. Prior to use, the beads were decanted via magnetic separation and washed two times in a 3× volume of PBST. A library frozen stock (1.3 mL) in 15% glycerol containing 1011 cells was added to 500 mL LB/CM and allowed to grow at 37 °C until OD600 reached 0.4 – 0.6. The culture was induced with 0.04% arabinose and allowed to grow another hour. The OD600 was measured to calculate the required volume for aliquots to contain 6–7 times the starting library diversity (usually about 40 ml). The aliquots were centrifuged for 15 minutes at 3000 rcf and 4°C. To clear any cells that bind to protein A/G, the supernatant was removed and cells were resuspended in 1000 µL PBST containing 50 µL washed beads at a ratio of 1:100 bead-to-cells. The bead-to-cell ratio is based on the size and enrichment of the library; for the first round of MACS, the naïve library will contain many non-binding peptides, so a high ratio of beads to cells can be used. For subsequent rounds, there will be more binders, so a lower ratio (1:1) is used. The cells were incubated in 2 mL microcentrifuge tubes for 45 min at 4 °C on an orbital shaker at 20 rpm. Following incubation, the tubes placed in a magnetic rack on ice for 5 minutes and the supernatant was collected in a fresh tube, and again magnetized. The supernatant collected from this second separation contained cells that do not bind to protein A/G. These cells were centrifuged for 5 minutes at 3500 rcf and 4°C and decanted. Both antibodies were used at a concentration of 25 nM and added to the cells for a final volume of 500 µL. Both antibodies have kD values in the low nM range, and were used at a final concentration of 25 nM because it provided effective library enrichment after the first round of MACS. Following incubation at the same conditions noted above, the cells were centrifuged, decanted and washed with 500 µL cold PBST. This was repeated 2 more times to remove any unbound antibodies. The final wash liquor was removed from centrifuged cells and magnetic beads were added at 1:10 for a 500 µL final volume. Following another incubation, the cells were placed on a magnetic rack on ice for 5 minutes and the supernatant was removed and discarded. The cells were washed four times with 500 µL PBST to remove any cells not attached to beads. The final cell library was incubated overnight in 20 ml LB/CM with 0.4% glucose added. A 10 µL sample of the library was removed, diluted and plated on LB/CM agar to estimate the diversity of the enriched library.
Figure 2. NGS-based methodology for mapping structural epitopes using bacterial display.
(a) Enrichment of random peptide bacterial display libraries for antibody-binding peptides using magnetic activated cell sorting followed by identification via NGS or Sanger sequencing. (b) NGS datasets are too large for currently available prediction algorithms, so to manage the large datasets from NGS, motif discovery via MEME was used to reduce a set of 5,000 of the most observed sequences to motifs (pattern groups) to allow input into PepSurf, which is built for small sets of mimotopes. The example shown is PepSurf mapping peptides from a MEME motif onto HER2.
Subsequent MACS rounds were performed to increase library enrichment to antibody-binding peptides. Cells from the overnight growth were added at 1:50 to 15 mL LB/CM and grown to an OD600 of 0.4 – 0.6. Following a one-hour induction with arabinose, an aliquot of cells containing >10× the library diversity (calculated from the overnight plates) was centrifuged and resuspended in 250 µL PBST containing 5 µL beads for at least a 1:1 bead-to-cell ratio to clear any protein A/G binding peptides. Magnetic separation on ice (5 min) followed by washing with cold PBST was performed two time to recover unbound cells, which were incubated with each antibody diluted to 25 nM in PBST for a final volume of 250 µL. Following incubation, the cells were centrifuged, and washed three times with 250 µL PBST. The final wash liquor was removed from centrifuged cells and 5 µL magnetic beads in PBST were added for a 250 µL final volume. Following incubation, cells were placed on a magnetic rack on ice for 5 minutes and the supernatant was removed and discarded. The cells were magnetized and washed four times with 250 µL cold PBST to remove any cells not bound to beads. The final cell library was sampled for plating and incubated overnight in the same manner as above.
2.1.4 Analysis of enrichment via flow cytometry
The enriched library pools from MACS were analyzed for antibody binding via flow cytometry using a BD FACSARIA I/II to determine library enrichment (Figure S1b). After overnight growth, the cells were subcultured at 1:50 into 15 mL LB/CM and grown to OD600 = 0.6. Following a one-hour induction with arabinose, a volume of cells >20× the estimated diversity was centrifuged and resuspended in 40 µL of 25 nM antibody. The cells were incubated for 45 minutes and washed as described in the MACS section above using 40 µL PBST. Then, cells were resuspended in α-IgG-PE diluted 1:100 in PBST. Following a 45 minute, 4 °C incubation, the cells were washed with cold PBST to remove unbound PE, and resuspended in 500 µL cold PBS for flow cytometry analysis. A sample containing E. coli cells expressing the eCPX scaffold (but without a peptide) was used to determine the background signal by drawing a gate that excluded 99.5% of these cells in a plot of fluorescence vs. side scatter. This same gate was then applied to the antibody-screened library and cells within the gate (exhibiting a fluorescence greater than background) were considered enriched in antibody binders. Screening rounds were conducted until the library pool exhibited >50% enrichment (Figure S2). The libraries from the final round of screening were plated for Sanger sequencing. Enriched libraries pools from all rounds were processed for NGS analysis.
2.2 Library preparation and sequencing
2.2.1 Sanger (dideoxy) sequencing
76 colonies were picked from LB/CM plates grown overnight from the final MACS round for each antibody. Individual colonies were transferred to a labeled, fresh LB/CM plate and incubated overnight at 37 °C, and peptide sequences were determined using Sanger DNA sequencing followed by translation using Geneious Pro v5.3.6.
2.2.2 Next Generation Sequencing
Libraries from all rounds of MACS were prepared for NGS as previously described [Pantazes et al., 2016]. Briefly, plasmids were extracted from cells grown overnight using a plasmid miniprep kit (Qiagen). The random peptide region was amplified via two PCR steps. In the first PCR (a gradient starting at 72 °C annealing temperature and decreasing 0.5 °C per cycle for 14 cycles followed by 15 rounds at 65 °C annealing temperature), primers include adapters specific to the sequencing platform (Illumina) and annealing regions flanking the region of the eCPX scaffold. To identify each library, a second PCR (8 rounds, 70 °C annealing temperature) adds a unique nucleotide barcode to each amplicon using Illumina Nextera XT indexing primers. Clean-up using Agencourt AMPure XP beads (Beckman Coulter) followed each of the PCR steps. The purity of each amplicon was confirmed via gel electrophoresis and concentration was quantified using a fluorophore-based DNA high-sensitivity reagent (Qubit). Finally, amplicon libraries were normalized to a single concentration and pooled for sequencing on an Illumina NextSeq 500. The pooled amplicon library purity was analyzed via a Bioanalyzer 2100 (Agilent) and the concentration measured using Qubit. A 75-cycle high-output flow cell with a single end read was used with dual indexing. After sequencing, the samples were de-multiplexed using provided sample identities linked to the Nextera XT indices.
2.2.3 Generation of a non-redundant sequence list
Using the IMUNE processor developed in the Daugherty lab [Pantazes et al., 2016], the generated DNA sequences were translated into a set of unique peptide sequences for each antibody. First, the processor searches for the constant upstream and downstream annealing regions of the DNA and translates the intervening sequence to generate a peptide sequence. Then, identically matching sequences are combined. Finally, peptide sequences with three or fewer differences, which are considered mutations from sequencing errors, are combined. The value of 3 is based on a statistical analysis, described in Pantazes et al., that shows the probability of finding 2 or more sequences with 10 or more identical positions is extremely low; therefore, sequences with 9 or more identical positions (3 or fewer mutations) are combined. Mutations outside the 12-mer peptide window are not counted.
2.3 Motif discovery and mapping
Four available web-based computational methods to map mimotopes to conformational epitopes were evaluated; PepSurf, Mapitope [Mayrose et al., 2006], Pep-3D-Search and MimoPro [Negi & Braun, 2009; Huang et al., 2008]. PepSurf was selected for this study because it 1) allows users to describe the library type which alters the similarity matrix accordingly and 2) accepts input sets of several hundred peptides. Both PepSurf and Mapitope met these criteria; PepSurf was selected because it provided improved values for the prediction metrics used in this study compared to Mapitope [Huang et al., 2008; Sun et al., 2011].
To enable use of PepSurf, sets of 5000 sequences rank-ordered by observation from NGS datasets were evaluated using MEME [Bailey & Elkan, 1994] to create motifs representing the sequence sets (Figure 2b). MEME runtime scales cubically with the number of input sequences; 5000 sequences results in a manageable runtime of several hours. MEME outputs consensus motifs, logo plots, lists of sequences containing each motif, and several characteristic values including expected value (E-value) which represents the likelihood of a motif being found in a random mix of the given amino acids in a dataset. Motifs with an E-value less than 0.05 were evaluated further. The consensus motif is created using the most probable residues at each position based on a position-specific letter probability matrix (PSPM). In the consensus motif, MEME lists amino acids with probabilities greater than or equal to 0.2, and records an X for positions where the amino acids have probabilities less than 0.2. Motif logo plots are constructed to show all residues in a position, scaling the size of the one-letter amino acid abbreviation with probability and listing amino acids top to bottom in a column (position in the motif) by their score for those with probabilities ≥0.2, and alphabetically for those with probabilities < 0.2. The PSPM was used to select amino acids for ambiguous (denoted as X) residue positions in-between defined positions by lowering the threshold to 0.15 or 0.10 and using residues with probabilities above this new threshold. The sequences obtained from Sanger sequencing were similarly clustered with MEME to obtain representative motifs for comparison with NGS-derived motifs. Table S2 contains details of the MEME results used to construct full motifs. Finally, a list of all possible motif variants was generated for each motif for input to PepSurf.
PepSurf minimally requires an input set of peptides (or motif variants used here) from experimental screening, the PDB ID or file and chain identifier(s) for the antigen. The peptides can be weighted if desired. Additionally, the library type (NNK, NNS, etc.) can be selected to best represent the library used to generate the peptide list. We chose the library type “RANDOM_AA” since the random peptide library construction used synthetic trinucleotide codons to ensure equivalent usage of each amino acid. Briefly, PepSurf compares each peptide provided to the solvent accessible surface of the antigen, determining the best path (Figure 2b). The user can reduce the value of the “best path probability threshold” to reduce the run time; we used the default (0.95). The algorithm then creates and scores up to three clusters of antigen residues on the surface that best fit a grouping of peptides.
The highest-scoring cluster from PepSurf was compared to the interface residues determined from PyMOL modeling, employing commonly used performance indicators of coverage/sensitivity, precision and specificity [Negi & Braun, 2009; Huang et al., 2008; Sun et al., 2011; Chen et al., 2012]:
Where true positives (TP) are correctly predicted interface residues, true negatives (TN) are correctly predicted non-interface residues, false positives (FP) are residues incorrectly predicted by PepSurf to be in the interface, and false negatives (FN) are interface residues not predicted by PepSurf.
The metric of precision is similar to a signal-to-noise ratio and indicates the likelihood of the prediction set containing more correct than incorrect information about possible binding regions; perfect prediction, equal to one, implies that no noise (i.e. no false positives) exists in the predicted residue set. Various input types were evaluated for interface prediction in PepSurf including the motif variant lists, combinations of motif variant lists, sequence lists from MEME that contain the motif, and entire Sanger sequence sets. The top NGS sequences, each with at least 50000 observations were also used as whole sequences (unweighted or weighted with number of observations) and also fragmented into 4- to 8-mer sets. Since the number of unique sequences after Sanger was higher than in reported peptide library studies (usually less than 100), we included sets of mimotopes from reported studies (Table S3) for trastuzumab/HER2 [Reimer et al., 2004] and bevacizumab/VEGF-A [Li et al., 2013] to allow comparison.
3. Results & Discussion
3.1 Discovery of mimotope motifs using bacterial display peptide libraries
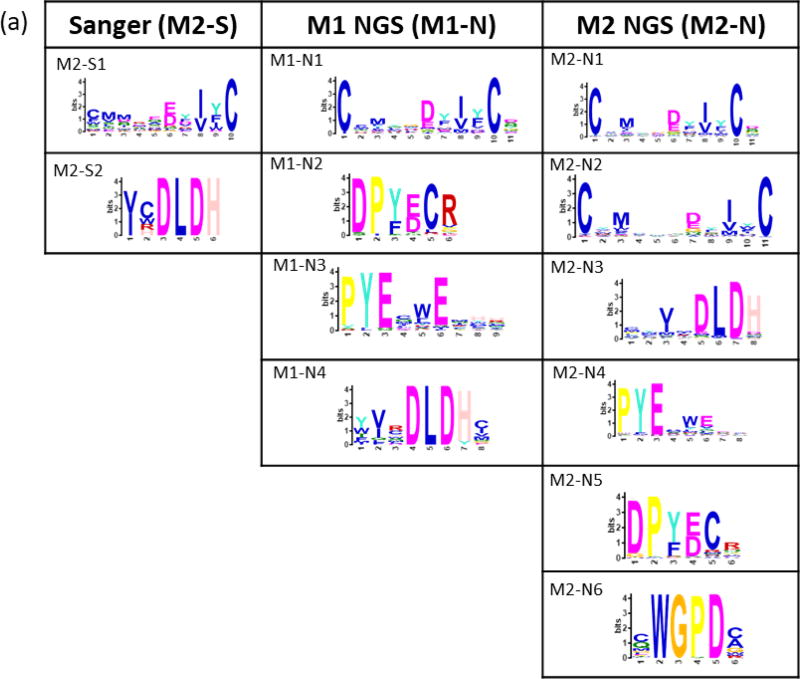
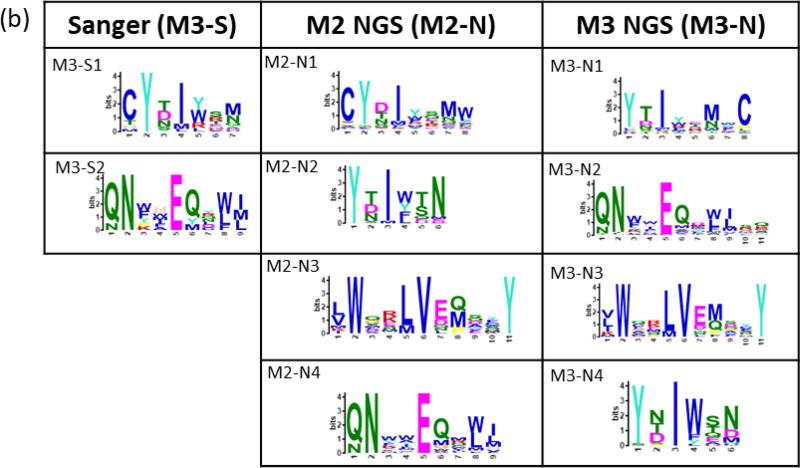
Peptides binding to trastuzumab and bevacizumab were selected from a bacterial display 12-mer peptide library (8×10⁹ members) using 2–3 cycles of MACS, yielding enriched libraries containing 55% and 45% binding members, respectively. Enriched libraries from the final MACS rounds resulted in 67 and 58 unique sequences obtained by Sanger sequencing for trastuzumab and bevacizumab, respectively. The NextSeq runs for each antibody-screened library from the final (n) and penultimate (n-1) MACS round resulted in 5–11 × 106 total reads representing 0.3 – 2 × 10⁵ unique peptides. MEME clustering of Sanger sequence sets revealed two significant (E-value <0.05) motifs. Motifs sets obtained from NGS data for both monoclonals included two motifs similar to the Sanger motifs along with additional unique motifs Figure 3).
Figure 3. Motifs from trastuzumab and bevacizumab-screened libraries.
Motifs from Sanger (S) sequencing of select colonies and from the 5,000 most-observed NGS (N) sequences for (a) trastuzumab and (b) bevacizumab. Bacterial colonies for Sanger sequencing were selected after the final round of MACS (M) for each monoclonal antibody. NGS sequencing was performed on libraries from the final (n) and (n-1) screening rounds. Residues for ambiguous positions were selected by setting a threshold value (p) lower than 0.2 (the default) in the MEME position-specific probability matrix.
3.2 Computational mapping
3.2.1 Computational mapping of motifs
Systematically defining and applying rules for motif usage based on knowledge about the respective antigen and the strength of residues in the motif resulted in improved prediction. For example, combining and running similar motifs (e.g. trastuzumab NGS motifs 1 and 2) in PepSurf resulted in higher sensitivity and precision than running each motif individually. The most represented motifs (those with the highest number of sequences contributing to them) were M2-N1 for trastuzumab and M3-N1 for bevacizumab; these motifs resulted in the best PepSurf prediction, suggesting that an elevated frequency of a given motif in a sequence set is associated with increased antibody binding affinity. Omitting leading/trailing cysteines in the bevacizumab motifs resulted in improved coverage; while for trastuzumab motifs including the flanking cysteines (trastuzumab Sanger and NGS motifs 1) resulted in significantly better coverage. This could be due to the large number of cysteines in and near the interface regions in HER2 compared to VEGF-A. For one bevacizumab motif, M2-N3 and M3-N3, truncating a slightly ambiguous residue position at the front end of the motif and limiting ambiguous resides to no more than two resulted in better interface prediction than using the entire motif. We also tested combinations of motifs as inputs to PepSurf. The highest coverage and precision for each antibody-antigen pair resulted from mapping each motif through PepSurf separately, then combining the motif results into a panel. This was accomplished by creating a cumulative list of true and false positive residues from the clusters and using these values along with the numbers of true and false negative residues to calculate the performance indicators sensitivity, specificity and precision in similar fashion to the individual motifs. Collectively, these observations suggest that independent PepSurf runs using motifs followed by combining the outputs results in the best coverage and precision.
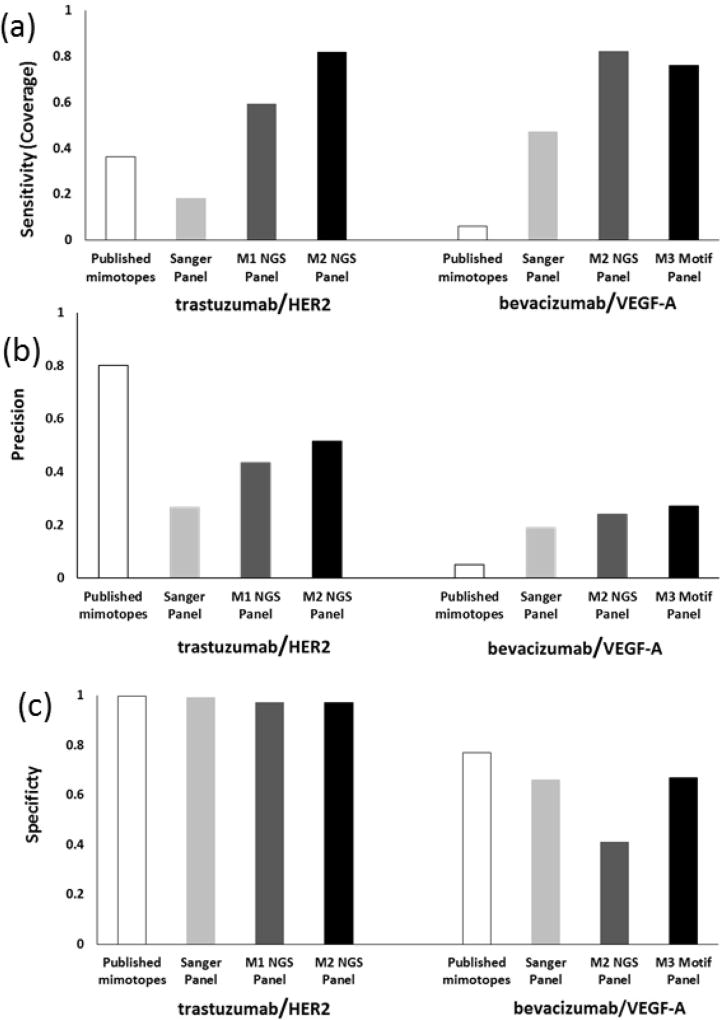
To compare the effectiveness of NGS-enhanced mapping with conventional mapping following Sanger sequencing, sensitivity [Negi & Braun, 2009; Huang et al., 2008; Sun et al., 2011; Chen et al., 2012] and precision [Negi & Braun, 2009; Huang et al., 2008; Sun et al., 2011; Chen et al., 2012] were calculated (Figure 4, Table 1). Sensitivity, or epitope coverage, was 18% or 82% for trastuzumab and 47% or 76% for bevacizumab using Sanger or NGS-based mapping on the enriched library pools, respectively. PepSurf is a deterministic algorithm; each time it runs with the same input, it yields the same result, so there is no deviation to report (i.e. no error bars).
Figure 4. Epitope prediction results.
Three commonly used indicators for measuring epitope prediction. (a) Sensitivity (coverage) is the measure of how completely the predicted cluster correlates to the known epitope. NGS motif panels provided the best prediction of coverage. (b) Prediction precision, the ratio of correct to total residues predicted, provides a “signal-to-noise” ratio. NGS showed improvement in precision compared to Sanger sequencing for both mAbs but less so for bevacizumab. For trastuzumab, published mimotopes [Reimer et al., 2004] provided the best precision. (c) Specificity is the measure of the method’s ability to predict true negatives, minimizing false negatives. For trastuzumab, all methods provided better specificity than bevacizumab. PepSurf is a deterministic algorithm, so no deviation is reported for multiple runs on identical input data.
Table 1.
Performance metrics for motif sets from libraries from the final MACS round, sequenced via Sanger or NGS, and published mimotopes.
| trastuzumab-screened libraries | bevacizumab-screened libraries | |||||
|---|---|---|---|---|---|---|
|
| ||||||
| Sanger | NGS | Published mimotopes [Reimer et al., 2004] |
Sanger | NGS | Published mimotopes [Li et al., 2013] |
|
| Sensitivity | 18 | 82 | 36 | 47 | 76 | 6 |
| Specificity | 99 | 97 | 99 | 66 | 67 | 77 |
| Precision | 0.27 | 0.51 | 0.80 | 0.19 | 0.27 | 0.05 |
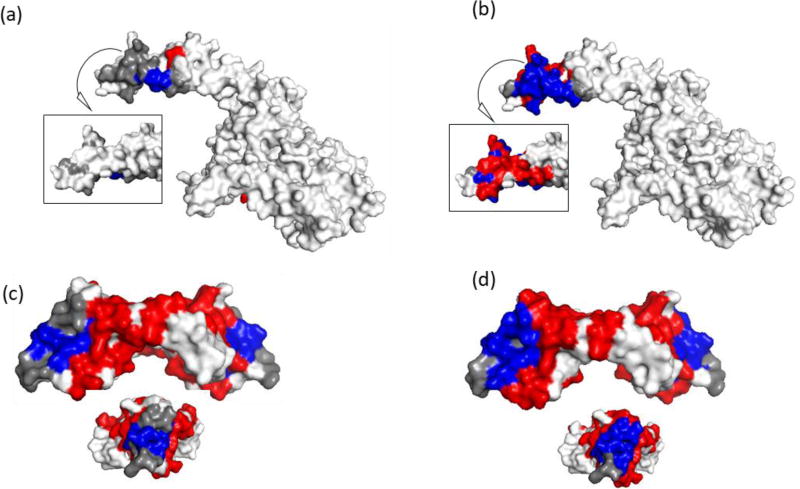
Published mimotopes from biopanning experiments for trastuzumab and bevacizumab resulted in sensitivity values of 36% and 6%. Specificity was >95% for both Sanger and NGS trastuzumab motif sets as well as the published mimotopes; lower specificity (<90%) was observed for bevacizumab motifs. The predicted residues were mapped to the respective antigen models (Figure 5). In general, all bevacizumab input sets (Sanger, NGS and reported mimotopes) resulted in more false positives than trastuzumab motifs. It is interesting to note that the specificity of bevacizumab is lower than that of trastuzumab; potential contributions are homogeneity of the VEGF-A structure or the fact that the epitope is a larger percentage of the whole antigen molecule for bevacizumab (16%) than for trastuzumab (4%). Others have attempted to correlate antigen size with prediction accuracy, but were unable to definitively identify a relationship [Sun et al., 2011]. The highly-looped structure of the epitope region of HER2 compared to the flatter VEGF-A surface may affect prediction results. Precision for the trastuzumab and bevacizumab Sanger motifs was 0.27 and 0.19, while NGS motifs resulted in higher ratios of 0.51 and 0.27. Published mimotopes for trastuzumab resulted in a precision of 0.80 and for bevacizumab, a precision of 0.05 Performance indicators for the individual motifs are summarized in the SI (Table S4, Figure S3).
Figure 5. Structural epitope prediction using NGS and prior methods.
Epitope prediction results of final round screening (a, c) Sanger and (b, d) NGS motif panels. Trastuzumab (HER2) – shown are 2 sides of the HER2 region of interest. Inset is the backside of the region. Bevacizumab (VEGF-A) – shown are the side and end view (inset) of VEGF-A shown. The compilation of NGS motifs into a panel provided superior sensitivity (coverage) but poor specificity (high false positives). Epitope residues colored grey were not predicted (false negatives), red residues were incorrectly identified as part of the epitope (false positives), and blue residues were correctly identified (true positives). White residues, the rest of the of antigen, are true negatives.
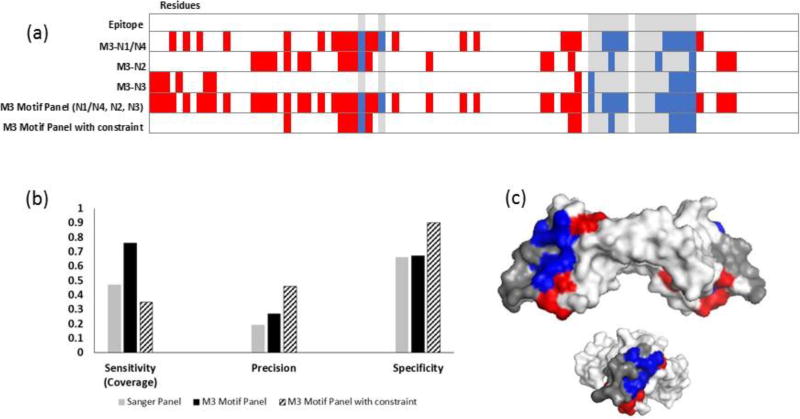
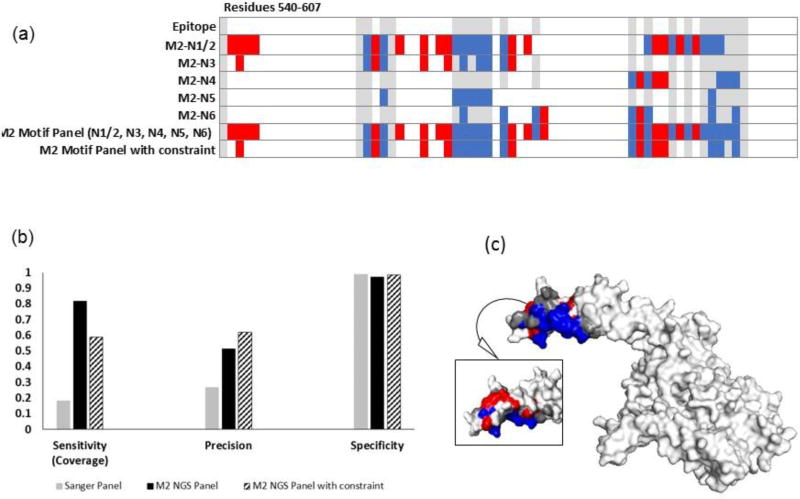
To reduce the high number of false positives found on the VEGF-A antigen (Figure 5c, d), the motif panel from the final bevacizumab library was subjected to an additional constraint. Namely, only residues that were predicted by at least two of the four motifs in the panel were considered (Figure 6a). This increased the precision and specificity, but reduced the epitope coverage compared to using the entire NGS motif panel (Figures 6b, 6c). Notably, residues from each epitope region were still identified. A similar result was found for HER2 (Figure 7). To assess whether motif matching to interface residues was significant, i.e. more than random chance, two bevacizumab-screened motifs were tested against the HER2 structure, and two trastuzumab-screened motifs were tested against the VEGF-A structure. All non-related motifs resulted in zero sensitivity; that is no interface residues were correctly identified (Figure S3).
Figure 6. Increasing panel threshold improves specificity and precision, but reduces epitope coverage for bevacizumab.
(a) Heat map showing the predicted residues for each NGS motif (N1/4, N2, N3) from the final MACS round (M3), combined motif panel, and added constrain panel. (b) Adding a constraint to use only residues that were predicted by more than one motif in the panel provided improved precision and specificity but lowered epitope coverage. (c) Residues predicted with the constraint mapped onto VEGF-A (side and end views). Epitope residues colored grey were not predicted (false negatives), red residues were incorrectly identified as part of the epitope (false positives), and blue residues were correctly identified (true positives). White residues, the rest of the of antigen, are true negatives.
Figure 7. Increasing panel threshold improves specificity and precision, but reduces epitope coverage for trastuzumab.
(a) Heat map showing the predicted residues for each motif, combined motif panel, and added constraint panel (residues 1-540 are true negatives). (b) The compilation of NGS motifs into a panel including residues that appeared in more than one motif in the panel provided improved precision and slightly improved specificity, but lowered epitope coverage. (c) Residues predicted with the constraint mapped onto HER2 (2 sides). Epitope residues colored grey were not predicted (false negatives), red residues were incorrectly identified as part of the epitope (false positives), and blue residues were correctly identified (true positives). White residues, the rest of the of antigen, are true negatives.
Motifs from the penultimate MACS round (first round for trastuzumab, second round for bevacizumab) were similar to those from the final rounds. When run through PepSurf in a similar fashion to final round motifs, we found that the cumulative indicators (Table 2) were 59% sensitivity, 97% specificity and 0.43 precision for the trastuzumab-screened library. It is notable that the MACS1 trastuzumab-screened library resulted in fewer motifs than MACS2. For the bevacizumab-screened library, metrics were 82% sensitivity, 62% specificity and a precision of 0.24. Performance indicators for the individual motifs can be found in the SI (Table S4, Figure S3).
Table 2.
Performance metrics for motif sets from MACS rounds using NGS sequencing.
| trastuzumab-screened libraries | bevacizumab-screened libraries | |||
|---|---|---|---|---|
| MACS 1 | MACS 2 | MACS 2 | MACS 3 | |
| Sensitivity | 59 | 82 | 82 | 76 |
| Specificity | 97 | 97 | 62 | 67 |
| Precision | 0.43 | 0.51 | 0.24 | 0.27 |
3.2.2 Computational mapping of sequence sets
Inputting the entire Sanger sequence sets into PepSurf did not identify interface residues in the best cluster for either trastuzumab or bevacizumab. The most abundant NGS sequences had a sensitivity of 0.0 and 0.12 for the trastuzumab and bevacizumab-screened libraries, respectively. It is well established that display library methods can result in the selection of target unrelated peptides (TUPs), even when depletion against the reagents is performed, and TUPs can become enriched and dominate the library when several screening rounds are performed. Use of NGS reduces the number of rounds required, helping to avoid TUP enrichment. Additionally, using NGS allows one to computationally remove undesired sequences, e.g. peptides that bind to IgG-constant regions. Finally, using the sequence sets identified for each motif in MEME resulted in reduced predictive power; only two of the six trastuzumab and one of four bevacizumab NGS motifs had a sensitivity greater than 0 when the representative sequence set was used as input to PepSurf.
4. Conclusions
In the present study using two monoclonal antibodies directed towards structural epitopes, sequences from NGS datasets improved the quality and accuracy of structural epitope prediction when compared to prior approaches. While individual peptides from Sanger and NGS were unable to correctly predict interface residues, motifs discovered from the most observed set of 5000 sequences in NGS datasets resulted in prediction clusters with improved sensitivity and precision when compared to Sanger sequences picked from library colonies screened with the same experimental protocol. Compared to mimotopes reported in literature, NGS data contained motifs that exhibited substantially improved sensitivity. Motifs from the penultimate MACS round also exhibited improved sensitivity and similar precision compared to the reported mimotopes, suggesting that in some instances, the use of NGS can reduce the number of required selection or screening rounds.
Methods for epitope mapping include X-ray crystallography, NMR spectroscopy, and a variety of antigen manipulation/antibody binding analysis techniques [Gershoni et al., 2007]. The method described here provides a means to use NGS datasets with currently available prediction software to identify candidate epitope sites, reducing the number of target regions for fine mapping via costly and time-consuming mutagenesis methods such as alanine substitution [Kronqvist et al., 2010]. The protocol offers additional advantages. It uses web-based motif generation (MEME) and epitope prediction algorithms. For structural epitopes, the use of a random peptide library yields superior performance relative to peptide scanning (overlapping peptides based on the antigen’s linear sequence). Finally, the technique of MACS is less expensive and easier to perform than FACS.
Use of NGS with prediction methods can help reduce development time for diagnostics, therapeutics and vaccines that require detailed knowledge of antigenic epitopes [Gershoni et al., 2007; Rojas et al., 2014]. For the described protocol, the most time-consuming activity is library generation. Once made, a random peptide library can be used over and over for different antibodies, compared to a specific antigen-fragment library. The time to complete the workflow, including screening, sequencing, motif generation and mapping requires as little as 3–5 working days. Building informatics tools specifically suited to process NGS data from epitope mapping experiments is an important goal to enable improved identification. PepSurf is limited by the linear scaling of run time to the number and length of peptides [Mayrose et al., 2006]; a run of 1500 6-mer peptides took over a week to complete. New algorithms should be purposefully designed to run the large input sequence lists generated by NGS, ideally in a matter of hours. Motif generation may remain the best way to cluster sequence data prior to mapping to an antigen surface, but a motif generator built within the framework of an epitope prediction tool would streamline the workflow.
Supplementary Material
Acknowledgments
The antibodies used in this study were generously provided by Dr. Daniel Greenwald of the Cancer Center of Santa Barbara. This work was funded in part by grant AI092204 to PSD and an NSF graduate research fellowship to KNI.
Footnotes
Publisher's Disclaimer: This is a PDF file of an unedited manuscript that has been accepted for publication. As a service to our customers we are providing this early version of the manuscript. The manuscript will undergo copyediting, typesetting, and review of the resulting proof before it is published in its final citable form. Please note that during the production process errors may be discovered which could affect the content, and all legal disclaimers that apply to the journal pertain.
Declaration of Interest
Patrick Daugherty is a stockholder, and officer of Serimmune Inc, which has licensed issued patents related this research.
References
- 1.Barlow DJ, Edwards MS, Thornton JM. Continuous and discontinuous protein antigenic determinants. Nature. 1986;322(21):747. doi: 10.1038/322747a0. [DOI] [PubMed] [Google Scholar]
- 2.Haste Anderson P, Nielsen M, Lund O. Prediction of residues in discontinuous B-cell epitopes using protein 3D structures. Protein Science. 2006;15:2558. doi: 10.1110/ps.062405906. [DOI] [PMC free article] [PubMed] [Google Scholar]
- 3.Ahmed TA, Eweida AE, Sheweita SA. B-cell epitope mapping for the design of vaccines and effective diagnostics. Trials in Vaccinology. 2016;5:71–83. [Google Scholar]
- 4.Meng X, Zhang H, Mezei M, Cui M. Molecular docking: A powerful approach for structure-based drug discovery. Cur Comput Aided Drug Des. 2011;7(2):146–157. doi: 10.2174/157340911795677602. [DOI] [PMC free article] [PubMed] [Google Scholar]
- 5.Kuroda D, Shirai H, Jacobson MP, Nakamura H. Computer-aided antibody design. Protein Eng Des & Selection. 2012;25(10):507–521. doi: 10.1093/protein/gzs024. [DOI] [PMC free article] [PubMed] [Google Scholar]
- 6.Rapburger R, Lukas A, Mayer B. Identification of discontinuous antigenic determinants on proteins based on shape complementarities. J Mol Recognit. 2007;20:113–121. doi: 10.1002/jmr.819. [DOI] [PubMed] [Google Scholar]
- 7.Chakrabarti P, Janin J. Dissecting protein-protein recognition sites. Proteins: Structure, function and Genetics. 2002;47:334–343. doi: 10.1002/prot.10085. [DOI] [PubMed] [Google Scholar]
- 8.Daugherty PS. Protein engineering with bacterial display. ScienceDirect. 2007;17:474–480. doi: 10.1016/j.sbi.2007.07.004. [DOI] [PubMed] [Google Scholar]
- 9.Wentzel A, Christmann A, Adams T, Kolmar H. Display of passenger proteins on the surface of Escherichia coli K-12 by the Enterohemorrhagic E. coli Intimin EaeA. J Bacteriology. 2001;283:24. doi: 10.1128/JB.183.24.7273-7284.2001. [DOI] [PMC free article] [PubMed] [Google Scholar]
- 10.Angelini A, Chen TF, de Picciotto S, Yang NJ, Tzen A, Santos MS, Van Deventer JA, Traxlmayr MW, Wittrup KD. Protein engineering and selection using yeast surface display. In: Liu Bin., editor. Methods in Molecular Biology. Vol. 1319. 2015. [DOI] [PubMed] [Google Scholar]
- 11.Hudson EP, Uhlen M, Rockberg J. Multiplex epitope mapping using bacterial surface display reveals both linear and conformational epitopes. Scientific Reports. 2012;2(706):1. doi: 10.1038/srep00706. [DOI] [PMC free article] [PubMed] [Google Scholar]
- 12.Reimer AB, Kraml G, Scheiner O, Zielinski C, Jensen-Jarolim E. Matching of trastuzumab (Herceptin®) epitope mimics onto the surface of Her-2/neu – a new method of epitope definition. Molecular Immunology. 2005;42:1121. doi: 10.1016/j.molimm.2004.11.003. [DOI] [PubMed] [Google Scholar]
- 13.Mayrose I, Shlomi T, Rubinstein ND, Gershoni JM, Ruppin E, Sharan R, Pupko T. Epitope mapping using combinatorial phage-display libraries: a graph-based algorithm. Nuclei Acids Res. 2006;35(1):69–78. doi: 10.1093/nar/gkl975. [DOI] [PMC free article] [PubMed] [Google Scholar]
- 14.Negi SS, Braun W. Automated detection of conformational epitopes using phage display peptide sequences. Bioinformatics & Biology Insights. 2009;3:71–81. doi: 10.4137/bbi.s2745. [DOI] [PMC free article] [PubMed] [Google Scholar]
- 15.Huang YX, Bao YL, Guo SY, Wang Y, Zhou CG, Li YX. Pep-3D-Search: a method for B-cell epitope prediction based on mimotope analysis. BMC Bioinformatics. 2008;9:538. doi: 10.1186/1471-2105-9-538. [DOI] [PMC free article] [PubMed] [Google Scholar]
- 16.Sun P, Chen W, Huang Y, Wang H, Ma Z, Lv Y. Epitope prediction based on random peptide library screening: Benchmark dataset and prediction tools evaluation. Molecules. 2011;16:4971–4993. doi: 10.3390/molecules16064971. [DOI] [PMC free article] [PubMed] [Google Scholar]
- 17.Chen W, Guo WW, Huang Y, Ma Z. PepMapper: A collaborative web tool for mapping epitopes from affinity-selected peptides. PLOS ONE. 2012;7(5) doi: 10.1371/journal.pone.0037869. [DOI] [PMC free article] [PubMed] [Google Scholar]
- 18.Heyduk E, Heyduk T. Ribosome display enhanced by next generation sequencing: A tool to identify antibody-specific peptide ligands. Analytical Biochemistry. 2014;464:73. doi: 10.1016/j.ab.2014.07.014. [DOI] [PubMed] [Google Scholar]
- 19.Domina M, et al. Rapid profiling of the antigen regions recognized by serum antibodies using massively parallel sequencing of antigen specific libraries. PLOS ONE. 2014;9(12) doi: 10.1371/journal.pone.0114159. [DOI] [PMC free article] [PubMed] [Google Scholar]
- 20.Christiansen A, et al. High-throughput sequencing enhanced phage display enables the identification of patient-specific epitope motifs in serum. Scientific Reports. 2015;5:12913. doi: 10.1038/srep12913. [DOI] [PMC free article] [PubMed] [Google Scholar]
- 21.Cho HS, Mason K, Ramyar KX, Stanley AM, Gabelli SB, Denney DW, Leahy DJ. Structure of the extracellular region of HER2 alone and in complex with the Herceptin Fab. Letters to Nature. 2003;421:756–759. doi: 10.1038/nature01392. [DOI] [PubMed] [Google Scholar]
- 22.Muller YA, Chen Y, Christinger HW, Li B, Cunningham BC, Lowman HB, de Vos AM. VEGF and the Fab fragment of a humanized neutralizing antibody: crystal structure of the complex at 2.4 A resolution and mutational analysis of the interface. Structure. 1998;6(9):1153–1167. doi: 10.1016/s0969-2126(98)00116-6. [DOI] [PubMed] [Google Scholar]
- 23.Pantazes RJ, Reifert J, Bozekowski J, Ibsen KN, Murray JA, Daugherty PS. Identification of disease-specific motifs in the antibody specificity repertoire via next-generation sequencing. Scientific Reports. 2016;6:30312. doi: 10.1038/srep30312. [DOI] [PMC free article] [PubMed] [Google Scholar]
- 24.Rice JJ, Daugherty PS. Directed evolution of a biterminal bacterial display scaffold enhances the display of diverse peptides. Protein Engineering, Design & Selection. 2008;21(7):435–442. doi: 10.1093/protein/gzn020. [DOI] [PMC free article] [PubMed] [Google Scholar]
- 25.Kenrick S, Rice J, Daugherty P. Flow cytometric sorting of bacterial surface-displayed libraries. Curr Protoc Cytom. 2007;42:4.6.1–4.6.27. doi: 10.1002/0471142956.cy0406s42. [DOI] [PubMed] [Google Scholar]
- 26.Bailey TL, Elkan C. Fitting a mixture model by expectation maximization to discover motifs in biopolymers; Proc of the Second Intl Conf on Intelligent Systems for Mol Bio; 1994. pp. 28–36. [PubMed] [Google Scholar]
- 27.Reimer AB, Klinger M, Wagner S, Bernhaus A, Mazzuccelli L, Pehamberger H, Scheiner O, Zielinski CC, Jensen-Jarolim E. Generation of peptide mimics of the epitope recognized by trastuzumab on the oncogenic protein Her-2/neu. J of Immunol. 2004;173:394–401. doi: 10.4049/jimmunol.173.1.394. [DOI] [PubMed] [Google Scholar]
- 28.Li W, Ran Y, Li M, Zhang K, Qin X, Xue X, Zhang C, Hao Q, Zhang W, Zhang Y. Mimotope vaccination for epitope-specific induction of anti-VEGF antibodies. BMC Biotechnology. 2013;13:77. doi: 10.1186/1472-6750-13-77. [DOI] [PMC free article] [PubMed] [Google Scholar]
- 29.Gershoni JM, Roitburd-Berman A, Siman-Tov DD, Tarovitski Freund N, Weiss Y. Epitope mapping: the first step in developing epitope-based vaccines. BioDrugs. 2007;21(3):145–56. doi: 10.2165/00063030-200721030-00002. [DOI] [PMC free article] [PubMed] [Google Scholar]
- 30.Kronqvist N, Magdalena M, Rockberg J, Hjelm B, Uhlén M, Ståhl S, Löfblom J. Staphylococcal surface display in combinatorial protein engineering and epitope mapping of antibodies. Recent Pat Biotechnol. 2010;4:171–182. doi: 10.2174/187220810793611536. [DOI] [PubMed] [Google Scholar]
- 31.Rojas G, Tundidor Y, Infante YC. High throughput functional epitope mapping: Revisiting phage display platform to scan target antigen surface. mAbs. 2014;6(6):1368–1376. doi: 10.4161/mabs.36144. [DOI] [PMC free article] [PubMed] [Google Scholar]
Associated Data
This section collects any data citations, data availability statements, or supplementary materials included in this article.


