

Summary
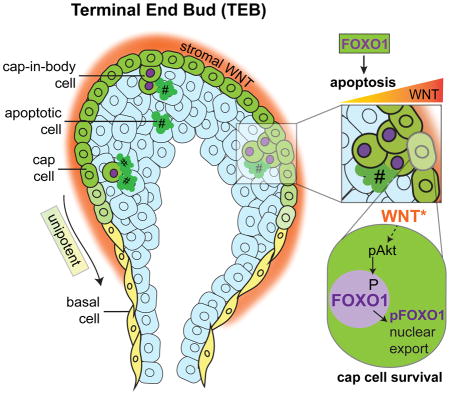
Puberty is characterized by dynamic tissue remodeling in the mammary gland involving ductal elongation, resolution into the mature epithelial bilayer, and lumen formation. To decipher the cellular mechanisms underlying these processes, we studied the fate of putative stem cells, termed cap cells, present in terminal end buds of pubertal mice. Employing a p63CreERT2-based lineage-tracing strategy, we identified a unipotent fate for proliferative cap cells that only generated cells with basal features. Furthermore, we observed that dislocated ‘cap-in-body’ cells underwent apoptosis, which aided lumen formation during ductal development. Basal lineage-specific profiling and genetic loss-of-function experiments revealed a critical role for FOXO transcription factors in mediating these proliferative versus apoptotic fates. Importantly, these studies revealed a mode of WNT signaling-mediated FOXO1 inhibition, potentially mediated through AKT. Together, these data suggest that the WNT pathway confers proliferative and survival advantages on cap cells via regulation of FOXO1 localization.
Keywords: cap cells, mammary stem cells, p63 lineage-tracing, WNT pathway, FOXO transcription factors, apoptosis
eTOC Blurb
Sreekumar et al. demonstrate that WNT pathway-mediated regulation of FOXO cellular localization dictates proliferative versus apoptotic fates in pubertal mammary stem cells, termed cap cells. Their data attribute one mechanism of stem cell survival to WNT signaling, which has potential implications for resident stem cell populations in other organs.
Introduction
Mammary gland morphogenesis is accompanied by cellular turnover through multiple rounds of pregnancy, lactation, and involution, suggesting the presence of a sustainable pool of mammary stem cells (MaSCs). However, the precise identity of the stem cell(s) in the mammary gland remains ambiguous. Previous efforts to isolate MaSCs relied on their pattern of cell surface marker expression (e.g., CD24 and CD29 or CD49f). These cells were characterized as MaSCs based on their ability to give rise to a fully functional mammary gland in limiting dilution transplantation assays (Shackleton et al., 2006; Stingl et al., 2006). Studies have since attempted to refine the identity of MaSCs. Accordingly, these studies leverage previously identified stem cell properties, such as expression of transcriptional regulators of ‘stemness’ (Chakrabarti et al., 2014; Junankar et al., 2015), stem cell-maintaining WNT pathway activity (de Visser et al., 2012; Plaks et al., 2013; van Amerongen et al., 2012; Wang et al., 2015), mesenchymal cell properties (Dravis et al., 2015; Guo et al., 2012), or markers of quiescence (Cai et al., 2016; dos Santos et al., 2013; Fu et al., 2017). However, no single, robust, pan-MaSC marker has emerged, suggestive of heterogeneity within the MaSC pool.
One transient population of MaSCs exists in pubertal terminal end bud (TEB) structures (Bai and Rohrschneider, 2010). TEBs drive ductal extension at an incredible rate of ~0.5mm/day (Hinck and Silberstein, 2005; Paine et al., 2016). While cell division and differentiation in the TEBs result in arborization of the mammary ducts, apoptosis enables lumen formation through cell clearance (Humphreys et al., 1996; Mailleux et al., 2007). TEBs comprise body cells surrounded by a single layer of cap cells. The latter has been suggested to house putative precursors for both the luminal and basal compartments (Srinivasan et al., 2003; Williams and Daniel, 1983). Indeed, cap cells have long been proposed to represent a population enriched for MaSCs because they are morphologically undifferentiated, self-renewing, and progressively acquire differentiated basal/myoepithelial cell characteristics in the neck of the TEB (Williams and Daniel, 1983). Furthermore, cap cells reside in a WNT-enriched niche and respond to WNT signaling, a hallmark of multiple organ-specific stem cell populations (Kouros-Mehr and Werb, 2006; Roarty et al., 2015). Recent studies have discovered that s-ship, a truncated isoform of the Inositol Phosphatase Ship1, is highly expressed in several stem cell populations, including TEB cap cells (Bai and Rohrschneider, 2010). The expression of s-ship promoter-driven GFP (s-ship-eGFP) facilitates the isolation of cap cells, which display an enrichment for stem cell function as measured by limiting dilution transplantation assays (Bai and Rohrschneider, 2010). Moreover, the cap cell state is recapitulated in the aggressive, stem cell-enriched, basal-like subtype of breast cancer (Bai and Rohrschneider, 2010; Junankar et al., 2015), further highlighting the importance of studying stem cell biology during normal development to bridge the gap in our understanding of its dysregulation in cancer.
Here, we sought to address how stem/progenitor cell homeostasis is maintained. The geographically distinct pool of cap cells serves as an accessible population to study the inherent regulation of these putative MaSCs in their native environment. Although the stem cell properties of cap cells are well-validated in transplantation assays (Bai and Rohrschneider, 2010), their in situ homeostasis and underlying regulation are understudied. Using a new lineage-tracing approach to resolve the fate of cap cells, we identified a surprising role for a subset of cap cells that underwent apoptosis and contributed to lumen formation. In addition, we identified the forkhead Box O (FOXO) transcription factors as critical regulators of cap cell proliferation and survival. Furthermore, we discovered a role for the ‘canonical’ WNT pathway in regulating FOXO1 cellular localization, potentially mediated by protein kinase B (PKB)/AKT. Thus, WNT pathway-mediated regulation of FOXO1 constitutes a central node maintaining MaSC homeostasis.
Results
Basal lineage-specific fate mapping identifies cap cells as unipotent
To map the fate of cap cells in the pubertal mammary gland, we utilized basal lineage-specific p63CreERT2/+ knock-in mice (Lee et al., 2014). Knock-in of the CreERT2 cassette into exon 4 of p63 in this lineage-tracing model identifies all isoforms of Tp63. We crossed these mice to RosamTmG/mTmG Cre reporter mice that express membrane localized GFP in recombined cells (Muzumdar et al., 2007). Pubertal female p63CreERT2/+;RosamTmG/+ mice were randomized into tamoxifen (Tam)- and vehicle (Veh)-treated arms at postnatal day 32 (P32). Mice were injected with a single low-dose of Tam (2mg/25g) or Veh, and euthanized after 48 h (t1), one week (t2), or eight weeks (t3) as depicted in Fig. 1A. These time points were chosen to represent the initial labeling efficiency (t1), the short-term contribution (t2), and the long-term contribution (t3) of cells respectively. Immunofluorescence (IF) analysis for total TP63 protein expression at these time points confirmed its localization in keratin 5 (K5)-labeled basal cells, whereas no TP63 was discernible in keratin 8 (K8)-labeled luminal cells (Fig. 1B). The basal lineage-specific labeling efficiency (CD24+CD29hi;GFP+) achieved at t1 in +Tam, Cre+ mice was 42.8 ± 5.3%, whereas almost no luminal cells were initially marked (CD24+CD29lo;GFP+) compared to the +Tam, Cre− controls. (Fig. 1C, Fig. S1A). Although GFP was detected throughout the mammary epithelium at the wholemount level at t1 (Fig. S1B), IF in ducts and TEBs identified basal-specificity of initial labeling (t1) assessed by co-localization with the basal marker α-smooth muscle actin (α-SMA) (Fig. 1D, Fig. S1E). Almost no K8+ luminal cells were GFP+ at t1 (Fig. 1D, Fig. S1E). Veh-treated Cre+ mice did not display GFP+ cells at early (t1) (Fig. 1C, light grey histogram) or late (t3) (Fig. S1H) time points, suggesting that the p63CreERT2 model is under exquisite control of tamoxifen.
Fig. 1. Basal lineage-specific fate mapping identifies cap cells as unipotent.

(A) Timeline used for basal lineage fate mapping using p63CreERT2/+;RosamTmG/+ mice. (B) Representative IF images depicting total TP63 localization (red) relative to K5+ cap/basal cells (green) and K8+ body/luminal cells (cyan) at time points of interest for lineage-tracing. N.B. See Fig. S1B–D for proximal and distal notations. Scale bar=50μm. (C) Representative histograms (3 independent sorts, n=3 mice each) depict distribution of recombined, GFP+, and unrecombined, GFP− basal (left) and luminal (right) cells upon initial labeling +Tam in p63CreERT2/+;RosamTmG/+ mice (+Tam, Cre+; cyan histogram), +Tam in RosamTmG/+ mice (+Tam, Cre−; dark grey histogram), or +Veh in p63CreERT2/+;RosamTmG/+ mice (+Veh, Cre+; light grey histogram) at t1. (D) Representative IF images characterizing GFP+ cells relative to α-SMA+ cap/basal cells (grey) and K8+ body/luminal cells (red) at t1. Scale bar=50μm. n=3 mice. (E) Representative IF images characterizing GFP+ cells relative to α-SMA+ cells (grey) and K8+ (red) at t2. Scale bar=50μm. n=3 mice. (F) Representative IF images characterizing GFP+ cells relative to α-SMA+ cells (grey) and K8+ (red) at t3. Scale bar=50μm. n=3 mice. See also Fig. S1.
One week after Tam treatment (t2), basal cell labeling was distinct throughout the ductal tree (Fig. S1C). To roughly distinguish between the fate of GFP-labeled cells in older mammary epithelium that pre-exists at puberty and newer ductal outgrowth driven by TEBs, we divided the mammary sections into regions that were proximal (older) and distal (newer) relative to the nipple as indicated in Fig. S1C. Spatial localization and identity of GFP+ cells was assessed by IF in 15μm thick sections by confocal microscopy. In the proximal region, 35.2 ± 15.6% GFP-labeled cells were marked by luminal marker K8, whereas the remaining GFP-labeled cells expressed the basal marker α-SMA (Fig. S1F), suggesting that basal GFP+ cells in the proximal region may give rise to luminal cells. Strikingly, in the distal TEBs and subtending ducts, GFP-labeled cells always expressed the basal marker α-SMA, but never the luminal marker K8 (Fig. 1E, Fig. S1F). This basal cell specificity was also true of the dislocated, GFP+ cap cells found throughout the TEB body (Fig. S1F). At t3, GFP+ cells appeared to be less prevalent relative to t2, but were observed throughout the mammary epithelium (Fig. S1D). While a few luminal cells were retained proximal to the nipple (Fig. S1G), most GFP+ cells throughout the ducts displayed basal characteristics (Fig. 1F). These data are consistent with a recent report (Scheele et al., 2017), and together, they suggest that in situ cap cells in the TEB are unipotent, and that the ductal front driven by TEB outgrowth preferentially generates basal cells.
Dislocated cap cells exhibit altered cell cycle progression and are apoptotic
The aforementioned lineage-tracing analysis of the TEBs identified dislocated, GFP+ cap cells within the body of the TEBs (Fig. 1E). These cells are also labeled by the cap-specific marker s-ship-eGFP (Bai and Rohrschneider, 2010) and often occur in multicellular clusters that express known markers of the basal lineage such as TP63 and α-SMA (Fig. 2A, Fig. S2A, Fig. S2B). Several such clusters were found attached to the outer cap cell layer and we refer to these cells as cap-in-body cells. Cap-in-body cells constitute 7.5 ± 2.6% of the total cellular composition in the TEB (Fig. 2A). Cap cells display expeditious cell cycling, with durations in the range of 16 h (Paine et al., 2016). To test whether cap-in-body cell clusters are a product of cell division, we assessed p63CreERT2/+ lineage-traced TEBs at early time points, where GFP+ cells are labeled more sparsely to ask if labeled clusters were clonal. Analysis of p63CreERT2/+ lineage-traced TEBs at t1 (48 h; ~3 cell cycles) identified several singly labeled GFP+ cells within cap-in-body clusters (arrowheads) relative to the outer cap layer, where predominantly multicellular GFP+ clones were observed (Fig. 2B). This suggested that cap-in-body cell clusters were not clonal and exhibited altered cell cycle kinetics when compared to the cap cells. To test whether the cap-in-body cells are less replicative than the outer cap cells, we analyzed the level of bromodeoxyuridine (BrdU) uptake by the different TEB populations. We observed that a variable, but low percentage (4.8 ± 3.5%) of cap-in-body cells were replicative compared to other TEB cell populations (Fig. 2C). This population of BrdU+ cap-in-body cells was often found closer to the outer cap cell layer when compared to the BrdU− cells (Fig. 2C, inset arrowhead) suggesting that BrdU uptake may have occurred while they were still contiguous with the outer cap cell layer. Moreover, a negligible number of cap-in-body cells were mitotic as indicated by phospho-histone H3 (pH3) staining (Fig. 2D). Indeed, as recently reported (Paine et al., 2016), we confirmed that a vast majority of the cap-in-body cell population (69.1 ± 13.1%) was apoptotic, measured by cleaved caspase 3 (cc3) expression and terminal deoxynucleotidyl transferase dUTP nick end labeling (TUNEL) assays (Fig. 2E, Fig. S2C). Additionally, three daily treatments of pubertal mice with z-VAD-FMK (pan-caspase inhibitor, 2μg/g) resulted in an expected decrease in cap-in-body cell apoptosis, accompanied by luminal filling and an accumulation of cap-in-body cells, while no changes in BrdU uptake were observed in this population compared to the Veh controls (Fig. 2F). These results suggest that the cap-in-body cell population displays impaired proliferation and survival compared to the outer cap cells.
Fig. 2. Dislocated cap cells exhibit altered cell cycle progression and are apoptotic.

(A) s-ship-eGFP marks cap cells. Phalloidin (F-actin marker, red) was used as a contrast stain. Inset depicts a dislocated cap-in-body cell cluster still attached to the outer cap cell layer. DAPI (blue)=nuclei. Quantification shows TEB composition. Scale bar=50μm. n=5 mice, 25 TEBs. (B) Lineage-traced TEBs at t1 used to assess cap-in-body cell clonality. Arrowheads=α-SMA+, GFP+ single cap-in-body cells. Scale bar=50μm. (C) BrdU+ cells (green) indicate replicative cells. Basal/cap and cap-in-body cells are marked with α-SMA (red). DAPI (blue)=nuclei. Arrowhead=BrdU+ cap-in-body cell still attached to the outer cap cell layer. Scale bar=50μm. The right panel shows quantification. n=5 mice, 12 TEBs. (D) pH3+ cells (green) indicate mitotic cells. Basal/cap and cap-in-body cells are marked with α-SMA (red). Almost no cap-in-body cells were mitotic (inset, arrowhead). DAPI (blue)=nuclei. Scale bar=50μm. The right panel shows quantification. n=5 mice, 18 TEBs. (E) cc3+ cells (red) are apoptotic. Cap and cap-in-body cells are marked with s-ship-eGFP. Inset, arrowhead=magnified view of apoptotic cap-in-body cell clusters. DAPI (blue)=nuclei. Scale bar=50μm. The right panel shows quantification. n=5 mice, 25 TEBs. (F) TEBs from mice treated with z-VAD-FMK. cc3+ cells (red) indicate apoptotic cells. Cap and cap-in-body cells are marked with s-ship-eGFP. DAPI (blue)=nuclei. Scale bar=50μm. The right panel shows quantification. n=3 mice, 10 TEBs each (vehicle, treated).
Error bars=mean ± SD. See also Fig. S2.
Cap-in-body cell apoptosis and altered cell cycle dynamics are consequences of FOXO1-dependent transcription of target genes
To identify potential cell cycle and cell death regulators in cap cells, we performed RNA-seq analysis on cap cells (CD24+CD29hi;s-ship-eGFPhi) versus basal cells (CD24+CD29hi;s-ship-eGFPneg), and derived a cap cell gene expression signature (Fig. S3A, RNA-seq data GEO:GSE81385). Transcription factor (TF) motif analysis in promoter regions of genes differentially expressed between cap cells and basal cells identified an overrepresentation of the FOXO TFs among others (Table S1). Four FOXO family members exist (FOXO1, FOXO3 being the most prevalent), and bind the same consensus DNA sequence (Eijkelenboom and Burgering, 2013). Comparing our RNA-seq dataset to a FOXO gene signature derived from Foxo1/3fl/fl neural progenitor cells (Paik et al., 2009), we found an inverse correlation between the FOXO signature and cap cell gene expression (Fig. 3A), suggesting a potential transcriptional function for the evolutionarily conserved FOXO TFs in the mammary epithelium. The FOXO family of TFs confers a pro-apoptotic, cell cycle-arrested phenotype on cells (Eijkelenboom and Burgering, 2013). Therefore, we hypothesized that FOXOs may regulate the two dichotomous cap cell states, i.e., rapidly proliferating and surviving cells in the outer layer versus non-proliferative and apoptotic cells within the body layers.
Fig. 3. Cap-in-body cell apoptosis and altered cell cycle dynamics are consequences of FOXO1-dependent transcription of target genes.

(A) GSEA of a FOXO1/3 signature in cap cells versus basal cells. (B) FOXO1 (red) localization in cap and cap-in-body cells (s-ship-eGFP+) in the TEB. The inset shows nuclear localization of FOXO1 in cap-in-body cell clusters whereas cap cells display cytoplasmic localization of FOXO1. DAPI (blue)=nuclei. Scale bar=50μm. The right panel shows quantification. n=3 mice, 18 TEBs. (C) Experimental design to study the short-term effects of basal lineage-specific loss of Foxo. Unrecombined (red) basal cells and recombined (green) basal cells were sorted. (D) qRT-PCR analysis of direct FOXO target genes. The fold change of target genes in the recombined basal (green) cells was compared to its normalized expression in unrecombined cells (dotted line). n=3 technical replicates, p-value=*<0.05, **<0.01, ***<0.001. (E) Representative multiphoton wholemount imaging through carmine alum stained mammary glands depicts aberrant lumen formation (red dotted lines) in +Tam p63CreERT2/+;RosamTmG/+;Foxo1fl/−;Foxo3fl/fl TEBs (+Tam, Cre+; bottom montage) compared to +Tam RosamTmG/+;Foxo1fl/−;Foxo3fl/fl TEBs (+Tam, Cre−; top montage). Scale bar=100μm. (F) TEBs from +Tam Cre+ mice. N.B. accumulation of recombined, GFP+ cap-in-body cells, luminal filling, increased BrdU uptake (red), and decreased cc3 (grey). Dotted line=lumen. DAPI (blue)=nuclei. Scale bar=50μm. The bottom panel shows quantification compared to +Tam Cre− RosamTmG/+;Foxo1fl/−;Foxo3fl/fl TEBs. n=2 mice, 8 TEBs each (+Tam, Cre+, +Tam, Cre−).
To determine whether FOXOs play a functional role in the mammary gland, we first assessed their protein expression pattern by IF. While FOXO3 was not detectable at the protein level (Fig. S3B, ovarian sections=positive controls), FOXO1 was abundantly expressed, highlighting potential context-dependent roles of these two FOXO family members. Nuclear FOXO1 localization was observed in estrogen receptor negative (ER−) body/luminal cells and basal cells in the ducts (Fig. S3C). Consistent with our hypothesis, FOXO1 showed distinct patterns of localization in the cap cells compared to cap-in-body cells in the TEB. Cap cells displayed predominantly cytoplasmic localization of the FOXO1, whereas 78.5 ± 14.3% of the cap-in-body cells showed nuclear localization (Fig. 3B), suggesting that FOXO1 may be shuttled into the nucleus to regulate transcription in the cap-in-body cells.
Next, we asked if FOXO1 is required to elicit the pro-apoptotic, non-proliferative cap-in-body cell phenotype in TEBs. To address this question, we utilized a loss-of-function Foxo model. Heterozygous loss of Foxo1 alone resulted in a compensatory increase in the second most abundant family member Foxo3 (Fig. S3D), in agreement with reported observations of functional redundancy and compensation (Paik et al., 2009; Tothova et al., 2007). Therefore, we generated conditional p63CreERT2/+;RosamTmG/+;Foxo1fl/−;Foxo3fl/fl mice. Female mice were treated with Tam at P35 and euthanized 72 h later. The 72-h time point was chosen to visualize maximal GFP expression upon initial recombination while identifying early and presumably direct consequences of Foxo loss. At this end point, recombined (GFP+) and unrecombined (tdTomato+) basal cells were isolated for further analysis (Fig. 3C, Fig. S3E). The reduction in Foxo1 and Foxo3 expression was confirmed by qRT-PCR and IF (Fig. 3D, Fig. S3G). Concomitant reduction in gene expression of several pro-apoptotic (Bim, Trail, Bcl6b, Puma), pro-cell cycle arrest (Gadd45, p21), and metabolic (Sod3, Nos2, Nos3, Prdx3, Mxi1) direct targets of FOXO was also observed (Fig. 3D, Fig. S3F). The TEBs of the Foxo1- and Foxo3-depleted mice displayed smaller, filled-in lumens (Fig. 3E) and closely mirrored the defective apoptosis phenotype observed upon pan-caspase inhibition, wherein decreased apoptosis and increased cap-in-body cell accumulation were observed (Fig. 3F, compare to Fig. 2F). Importantly, these results suggest that cap-in-body cell apoptosis significantly contributes to lumen formation in the TEBs. Furthermore, an increased percentage of cap-in-body cells were BrdU+, suggesting a reversal of cell cycle dynamics to cap cell-like levels upon loss of Foxo (Fig. 3F). Together, these data suggest that FOXO may shuttle from the cytoplasm to the nucleus in cap-in-body cells, and that FOXO-mediated transcription is essential for inducing cap-in-body cell non-proliferation and apoptosis.
WNT signaling regulates nuclear-cytoplasmic shuttling of FOXO1
We next asked what pathways regulate the cytoplasmic to nuclear shuttling of FOXO in the cap-in-body cells. Given the dramatic difference in FOXO localization occurring even at a one-cell distance from the stroma (Fig. 3B, inset), we reasoned that the relevant signaling pathway should act as a short-range signal, rather than as a long-range diffusible morphogen, and should be specifically active in cap cells. The WNT pathway fulfills these criteria. Several recent studies suggest that WNT acts as a paracrine signal at a single cell range (Farin et al., 2016; Habib et al., 2013). Additionally, TEBs exist in a WNT-enriched environment (Kouros-Mehr and Werb, 2006) and cap cells specifically are WNT responsive (Fig. S4A) (Roarty et al., 2015). We confirmed this result by applying a WNT signature GSEA derived from hyperplastic MMTVWnt1/+ mice (Huang et al., 2005) on our RNA-seq dataset from cap cells versus basal cells (Fig. 4A). TF motif analysis in promoter regions of genes differentially expressed between cap cells and basal cells also identified binding sites for LEF1, a TF that acts downstream of WNT signaling (Table S1).
Fig. 4. WNT signaling regulates nuclear-cytoplasmic shuttling of FOXO1.

(A) GSEA of a WNT signature in cap versus basal cells. (B) Serum-starved 293T cells transfected with FOXO1-GFP were treated with Vehicle (PBS) or recombinant WNT3A (100ng/ml; WNT3A hi) and imaged 15 min later. Western blot analysis of indicated proteins in lysates derived from similarly treated 293T cells (Veh, WNT3A lo, WNT3A hi;15 min). GAPDH=loading control. The pink asterisk indicates the specific band. N.B. See Fig. S4D for the full blot with intervening insulin and H2O2 controls. (C) IF analysis of sections derived from s-SHIP;CA-MMTV-Wnt1 mice (middle) and s-SHIP only littermates (left) for s-ship-eGFP (green) and FOXO1 (red) in the hyperplastic TEBs. DAPI (blue)=nuclei. Scale bar=50μm. The right panel shows quantification. Arrowheads=cap-in-body cells. Dotted lines=lumens. n=3 mice, 8 TEBs each (WT littermate, CA-MMTV-Wnt1). (D) Experimental schedule for doxycycline (Dox) or sucrose (Suc) treatment of MTB/TWNT mice. (E) IF of stained tissue sections at endpoints from Fig. 4D were analyzed for localization of FOXO1 (red) in TP63+ cells (green). DAPI (blue)=nuclei. The insets show higher magnification snapshots comparing FOXO1 localization in cap and cap-in-body cells. N.B. Yellow cells=nuclear co-localization of FOXO1 and TP63. Arrowheads=cap-in-body cells. Dotted lines=lumens. Scale bar=50μm. Right panel shows quantification. n=2 mice, 9 TEBs each (S1, S2) and n=3 mice, 9 TEBs each (D1, D2, DS).
Error bars=mean ± SD. See also Fig. S4.
To assess if WNT activity is a direct determinant of FOXO localization, we introduced a localization-competent FOXO1-GFP fusion reporter plasmid (Frescas et al., 2005) into WNT-responsive 293T cells, and treated these cells with a ‘canonical’ WNT ligand, WNT3A. Upon exogenous addition of WNT3A (lo=50ng/ml, hi=100ng/ml) to serum-starved cells, we observed a shift from predominantly nuclear to predominantly cytoplasmic localization of FOXO1 within 15 min (Fig. 4B, Fig. S4B, C). As previously reported (Frescas et al., 2005), exogenous addition of insulin (100 nM) and H2O2 (50 μM) were used as positive controls for cytoplasmic and nuclear localization of FOXO1-GFP, respectively (Fig. S4B, C). We confirmed activation of the WNT pathway by identifying increased levels of phosphorylated LRP6 (pLRP6) by Western blot analysis (Fig. 4B). Because cytoplasmic localization of FOXO1 is commonly associated with its phosphorylation (Calnan and Brunet, 2008), we assessed the presence of phosphorylated FOXO1 (pFOXO1), and indeed, detected an increase in pFOXO1 upon WNT treatment (Fig. 4B, Fig. S4D). These results were confirmed in an independent mammary epithelial cell line MCF10a (Fig. S4E).
To determine whether perturbation of WNT signaling affects FOXO1 localization and cap-in-body cell apoptosis in TEBs, we crossed s-shipeGFP/+ mice to constitutively active MMTVWnt1/+ mice (CA-MMTV-Wnt1). As expected, pubertal TEBs were hyperplastic and displayed abnormal lumen formation (Fig. S4F, G). Although the percentage of cap-in-body cells was not significantly different, abnormal lumen formation was associated with a reduction in cap-in-body cell apoptosis (Fig. S4G). Strikingly, constitutive activation of WNT1 was associated with decreased nuclear localization of FOXO1 in all cell types of the TEB, including cap-in-body cells (Fig. 4C).
To confirm that cytoplasmic localization of FOXO1 is acutely regulated by WNT signaling in vivo, we next utilized a conditional MMTV-Wnt1 model, in which the Wnt1 transgene and subsequent WNT signaling is induced using doxycycline, i.e., the MTB/TWNT mice (Gunther et al., 2003). This model allowed us to test the effect of acute WNT activation in a direct and reversible manner, while ruling out any potential secondary effects from constitutive, pre-existing hyperplasias in the CA-MMTV-Wnt1 mice. Mice were treated continuously with doxycycline (Dox, treatment) or sucrose (Suc, control) at P32, and euthanized 1 week (D1 Dox, S1 Suc) or two weeks later (D2 Dox, S2 Suc). Another cohort of mice was continuously treated +Dox for one week followed by +Suc for one week to assess the reversibility of the WNT effect (DS Dox;Suc, reversibility) (Fig. 4D). As observed with the CA-MMTV-Wnt1 mice, Dox induction in the MTB/TWNT mice resulted in cytoplasmic localization of FOXO1 (Fig. 4E, compare insets). Intriguingly, short-term overexpression of WNT1 (D1) resulted in cytoplasmic localization of FOXO1 selectively in cap-in-body cells, whereas long-term overexpression of WNT1 (D2) was comparable in phenotype to the CA-MMTV-Wnt1 mice with respect to cytoplasmic localization of FOXO1 in almost all cell types in the TEB (Fig. 4E). Moreover, this effect was reversible upon removal of Dox (DS) (Fig. 4E). Therefore, using an inducible genetic model of WNT1 overexpression, we demonstrate in vivo that FOXO1 in cap-in-body cells can be reversibly localized to the cytoplasm in response to WNT signaling.
WNT signaling-induced FOXO1 cytoplasmic localization is regulated by AKT
Post-translational modifications such as phosphorylation, ubiquitination, and acetylation regulate the localization and activity of FOXO (Calnan and Brunet, 2008). To determine how WNT regulates FOXO localization, we transfected 293T cells with a FOXO1-ADA-GFP fusion plasmid, which contains point mutations at three phosphorylation sites (T24A, S253D, S316A) (Qiang et al., 2010). As expected, exogenous WNT3A addition did not cause nuclear exclusion of the phosphorylation incompetent FOXO1 (Fig. 5A, compare with Fig. 4B where cytoplasmic localization is observed upon treatment with WNT3A), suggesting that WNT primarily acts through a kinase to regulate FOXO1 localization. Serum and glucocorticoid-regulated kinase (SGK) and AKT are enzymes known to phosphorylate FOXO1 at the phosphorylation sites mutated in the FOXO1-ADA-GFP construct. Upon WNT3A treatment, we observed no differences in active SGK (Fig. S5A). However, we detected an increase in the active, phosphorylated form of AKT (pAKT) in both 293T and MCF-10a cells (Fig. 5A, Fig. S5B, C). To determine if AKT-mediated FOXO1 phosphorylation is required for WNT-induced nuclear exclusion of FOXO1, we pre-treated serum-starved 293T cells with the AKT-specific allosteric inhibitor MK2206 (AKTi, 10μM) for 30 min prior to treatment with WNT3A. AKT inhibitor pre-treated 293T cells containing the FOXO1-GFP plasmid were imaged before and after treatment with WNT3A. AKTi prevented WNT-mediated cytoplasmic localization of FOXO1 (Fig. 5B). Concomitantly, Western blot analysis showed that AKT inhibition abrogated pFOXO1, and this could not be rescued even upon WNT treatment (Fig. 5B). We confirmed these pharmacological results independently in WNT3A-treated 293T cells transfected with siRNAs against Akt1/2, where we observed reduced pFOXO1 in response to decreased levels of total AKT and pAKT (Fig. S5D). pLRP6 levels confirmed similar levels of WNT pathway induction in all groups (Fig. S5D). These data suggest that AKT is a critical kinase regulating FOXO localization downstream of WNT signaling in vitro.
Fig. 5. WNT signaling-induced FOXO1 cytoplasmic localization is regulated by AKT.

(A) Serum-starved 293T cells transfected with phosphorylation incompetent FOXO1-ADA-GFP were treated with Vehicle (PBS), WNT3A lo, or WNT3A hi for 15 min. The nuclear localization of FOXO1-ADA-GFP was retained 15 min after WNT hi treatment (left panels). Western blot analysis of indicated proteins in lysates derived from similarly treated 293T cells (Veh, WNT3A lo, WNT3A hi;15 min). GAPDH=loading control. The pink asterisk indicates the specific band (right panel). Scale bar=50μm. N.B. See Fig. S5B for the full (uncut) blot with intervening insulin and H2O2 controls. (B) Serum-starved 293T cells transfected with FOXO1-GFP were pre-treated with MK2206 (AKTi) and imaged before (left upper panel) and after WNT3A hi treatment (left lower panel). The nuclear localization of FOXO1-GFP was determined 15 min after WNT3A treatment (left panels). (Right) Western blot analysis of indicated proteins in lysates derived from similarly treated 293T cells (30 min AKTi pre-treatment followed by Veh, WNT3A lo, WNT3A hi;15 min) The pink asterisks indicate the specific band (right panel). GAPDH=loading control. Scale bar=50μm. (C) Representative histograms (left panel) depict GFP positivity in serum-starved 7TGC-transduced 2508Wnt1-YL cells treated +Veh (orange histogram), +WNTi (LGK974, red histogram), or +WNT3A (green histogram) for 24 h. Right panel indicates quantification of %GFP+ cells in these groups. Flow cytometry analysis performed on triplicate independent samples/treatment. (D) IF for endogenous FOXO1 protein (green) (left) and Western blot analysis of indicated proteins (right) in lysates derived from similarly treated 2508Wnt1-YL cells. The pink asterisk indicates the specific band (right panel). GAPDH=loading control. DAPI(red)=nuclei. Scale bar=50μm. (E) IHC for pAKT in TEBs from Veh-(upper) and WNTi-treated mice (lower). Arrowheads=cap cells. Scale bar=50μm. (F) IF for FOXO1 (green) in TEBs from mice treated +Veh (left upper panel) and +WNTi (left middle panel) for 24 h. DAPI(red)=nuclei. Arrowheads=localization of FOXO1 in cap cells. IF for BrdU (red) and cc3 (green) in α-SMA+ cap cells (grey) in mice treated +Veh (right upper panel) and +WNTi (right middle panel) for 24 h. Arrowheads=cc3+ cap cells. Scale bar=50μm. Quantification for cc3+ (left lower panel) and BrdU+ cells (right lower panel) in mice treated +Veh and +WNTi for 24 h and 72 h. DAPI(blue)=nuclei. n=3 mice, 8 TEBs each (Veh, LGK974 at 24 h, 72 h). (G) IF for α-SMA+ cap and cap-in-body cells (grey) in TEBs from mice treated +Veh (upper panel) and +WNTi (middle panel) for 24 h. Scale bar=50μm. Quantification for %cap-in-body cells (lower panel) in mice treated +Veh and +WNTi for 24 h and 72 h. DAPI(blue)=nuclei. Arrowheads=cap-in-body cells.
Error bars=mean ± SD. See also Fig. S5.
To confirm that this kinase cascade downstream of WNT signaling indeed regulates FOXO1 localization, we performed the reverse experiment in a cell line overexpressing WNT. We utilized the MMTV-Wnt1 tumor-derived cell line 2508Wnt1-YL (Batts et al., 2011). To confirm that these cells are responsive to WNT signaling, we transduced these cells with the lentiviral WNT reporter 7TGC and observed that 40.3 ± 2.3% of the cells were GFP+, and therefore WNT responsive (Fig. S5E - orange histogram). Treatment of these cells with WNT3A for 24 h further induced GFP positivity (57.3 ± 1.1%, Fig. 5C - green histogram and quantified bar) in 2508Wnt1-YL cells. Conversely, 24 h treatment of these cells with WNT inhibitor LGK974 (WNTi, 1μM), which inhibits WNT secretion by targeting the WNT-specific acyl transferase PORCN, resulted in a dramatic decrease in WNT positivity (21.2 ± 2.9%, Fig. 5C - red histogram and quantified bar). IF analysis of endogenous FOXO1 in this cell line showed that FOXO1 was predominantly cytoplasmic in 24 h Veh- (and DMSO-, data not shown) treated as well as WNT3A-treated cells (Fig. 5D). However, 24 h treatment of these cells with either the WNTi or AKTi resulted in nuclear localization of FOXO1 (Fig. 5D). Western blot analysis of lysates from similarly treated 2508Wnt1-YL cells further confirmed that treatment with WNTi or AKTi resulted in a marked decrease in pAKT and pFOXO1 (Fig. 5D). These results demonstrate that both upstream inhibition of WNT secretion as well as downstream inhibition of AKT activation in WNT-overexpressing cells result in decreased levels of pFOXO1 that is associated with nuclear localization of FOXO1.
To investigate whether AKT regulates FOXO localization downstream of physiological WNT signaling in vivo, we treated 5–6 week old mice acutely with Veh or WNTi (6μg/g). Mice were treated daily and euthanized 24 h or 72 h later (Liu et al., 2013a). Immunohistochemistry (IHC) for pAKT shows an overall decrease in pAKT staining intensity in cap cells at 24 h in response to WNTi (Fig. 5E). If WNT signaling regulates in situ cap cell survival and proliferation; we would expect that WNT inhibition would cause cap cells to display cap-in-body cell-like properties. Indeed, all WNTi-treated TEBs tested displayed predominantly nuclear FOXO1 localization in cap cells at both time points (Fig. 5F, Fig. S5F), suggesting that acute inhibition of WNT secretion and subsequent signaling in the cap cell niche influences FOXO1 localization. While significantly fewer BrdU+ cap cells were observed, only a trend towards increased %cc3+ cap cells was noted upon acute treatment with WNTi for 24 and 72 h (Fig. 5F, Fig. S5F). This suggests that cap cells in contact with the basement membrane may still be partially protected from apoptosis at these early time points. Importantly, WNTi-induced changes in cap cell turnover were accompanied by a reduction in the percentage of cap-in-body cells (Fig. 5G, Fig. S5F). These data further suggest that the WNT pathway regulates cap cell homeostasis by regulating the localization of FOXO1, potentially in an AKT-dependent manner.
Discussion
In the current study, we utilized a new approach for fate mapping epithelial cells during pubertal mammary gland development. In this model, Cre recombinase expression is driven by the Tp63 promoter: a TF regulator of basal lineage identity (Chakrabarti et al., 2014), which enabled us to label both basal cells and cap cells using a low dose of Tam. Although low levels of the TAp63γ isoform are reportedly detected in rare luminal cells (Li et al., 2008), recent studies have found that the ΔNp63 isoforms of Tp63 present in the basal lineage constitute the predominant subset in the mammary gland (Chakrabarti et al., 2014). Consistently, we detected GFP+ basal cells, but almost no GFP+ luminal cells at t1. At later time points (t2 and t3), most GFP+ cells in our model displayed basal characteristics, but a minority GFP+ luminal cell population was observed proximal to the nipple. This may suggest the presence of basal cells proximal to the nipple that can generate luminal cells during early puberty. One caveat is that we cannot conclusively exclude that there is expression of Tp63 in some luminal cells resulting in the low level of recombination detected at t1 (Fig. 1C). In either scenario, there appears to be a distinct preference for GFP+ luminal cells in regions proximal to the nipple that is suggestive of either bipotency or differential Tp63 expression in these embryonically-derived regions that pre-exist at the onset of puberty. This is in contrast to GFP+ cells observed in TEBs and distal ducts that are generated during puberty and exclusively maintain their basal identity.
Cap cells in the TEB are precursors to the basal layer (Williams and Daniel, 1983), but whether they give rise to pre-luminal body cells has remained an open question. Dislocated cap cells are dispersed throughout the body cell layers and have been considered putative bipotent cells (Srinivasan et al., 2003; Williams and Daniel, 1983). In addition, based on studies of the planes of cell division in the cap cell layer, cap cells that divide perpendicularly to the basement membrane were proposed to give rise to differentiated body cells (Regan et al., 2013). Furthermore, cap cell divisions are occasionally associated with unequal distribution of asymmetric cell division markers, though the fate of these daughter cells is unknown (Ballard et al., 2015). On the other hand, stochastic and lineage-unbiased labeling of the mammary epithelium suggested that all cells in the TEB can act as lineage-restricted progenitors based on clonal analysis (Scheele et al., 2017). Our study utilized a system with penetrant and specific labeling of cap cells in the TEB to confirm that cap cells are unipotent, supporting the findings of Scheele et al. (Scheele et al., 2017). However, given that our lineage-tracing model is not specific for cap cells, but rather labels the entire basal epithelium, a cap cell-specific fate mapping approach exploiting markers such as s-ship, as has been recently suggested (Lloyd-Lewis et al., 2017), is required to definitively confirm our observations of cap cell unipotency.
Of note, our current lineage-tracing studies suggested that cap-in-body cells display impaired proliferation. Strikingly, we found that cap-in-body cells underwent apoptosis and are important contributors to lumen formation in the mammary gland. In addition to dampened WNT signaling, cap-in-body cell apoptosis may also be a consequence of anoikis, as has been proposed (Mailleux et al., 2007). Based on our previous study mathematically modeling ductal elongation (Paine et al., 2016), we speculate that surplus cap cells may slough off from the outer cap cell layer and undergo apoptosis in an attempt to maintain a steady state number of cap cells. This idea is reminiscent of crowding-induced cell extrusion that has been proposed in the intestine as a mechanism to eliminate cells resulting from excessive cell division, thus maintaining a fixed range of intestinal cell numbers (Eisenhoffer et al., 2012). Interestingly, the WNTi-mediated decrease in cap cell proliferation resulted in reduced cap-in-body cell numbers, further supporting that the WNT pathway underlies this homeostatic mechanism of balancing cap cell numbers.
The FOXO family of TFs regulates stem cells, including hematopoietic and neural stem cells, where loss of Foxo results in depletion of the stem cell pool (Eijkelenboom and Burgering, 2013; Paik et al., 2009; Tothova et al., 2007). FOXOs carry out this role by integrating diverse physiological cues to elicit apoptosis, cell cycle arrest, and/or stress resistance (Eijkelenboom and Burgering, 2013). The role of FOXOs in mammary homeostasis is not well defined. Cap cells displayed cytoplasmic localization of FOXO1, while we observed nuclear FOXO1 in cap-in-body cells, suggesting that FOXO1 mediated their cell cycle arrest and apoptosis. Acute loss of Foxo1/3 resulted in an accumulation of cap-in-body cells, highlighting the critical role of FOXOs in regulating cap cell proliferation and survival. The function of nuclear FOXO1 in other mammary epithelial cell types such as ER− body/luminal cells and mature ductal basal cells remains to be understood. Indeed, FOXO TFs are suggested to repress the cell cycle downstream of BCL11B, a critical regulator of basal cell quiescence in the mammary gland (Cai et al., 2016).
Our findings here strongly suggest that WNT signaling regulates FOXO localization. ‘Canonical’ WNT signaling mediates stem cell renewal and proliferation by promoting β-catenin (CTNNB1) translocation to the nucleus where it acts as a co-activator of the TCF/LEF family of TFs. Provocatively, FOXOs can compete with TCF by directly binding CTNNB1 and inhibit WNT/β-catenin signaling (Hoogeboom et al., 2008). Our data suggest that ‘canonical’ WNT ligands may promote a WNT-permissive nuclear environment through FOXO1 nuclear exclusion. We observed that AKT acted as a critical kinase downstream of the WNT pathway regulating FOXO localization in vitro, and that its expression correlates with FOXO cytoplasmic localization in vivo. The precise mechanism by which WNT signaling activates AKT remains an open question.
Although previous studies have suggested that the WNT pathway is a pro-survival pathway (Tepera et al., 2003; Zeng and Nusse, 2010), the mechanism by which it mediates survival remains unclear. Here, we propose a mechanism for survival wherein WNT activates a kinase cascade to inhibit FOXO-mediated transcription of pro-apoptotic target genes. These observations have several implications. First, FOXO can fine-tune WNT-mediated self-renewal and proliferation, and subsequently impact the maintenance of stem cells/progenitors. Indeed, antagonism at the transcriptional level between FOXO and TCF/LEF is evolutionarily conserved and may consequently impact stem cell regulation across developmental stages (Hoogeboom et al., 2008). Secondly, the interaction of these pathways is critical for maintaining homeostasis, and it follows that their perturbation could result in tumorigenesis. FOXO is a tumor suppressor (Calnan and Brunet, 2008), and hyperactive WNT signaling, along with other growth factor signals, may inhibit FOXO’s tumor suppressive functions. Finally, WNT pathway active cancer stem cells are resistant to chemo- and radiotherapy (Holland et al., 2013). Based on our data in normal mammary development and stem cells, an attractive hypothesis is that targeting upstream WNT signaling at the level of WNT receptors or WNT secretion may inhibit cancer stem cell self-renewal and initiate apoptosis. Thus, a combination of chemo- or radiotherapy together with WNT pathway inhibition may provide a rational therapeutic alternative for tumor subtypes with an enriched WNT/stem cell signature.
Taken together, this study addresses a critical gap in our knowledge of cap cell proliferation, survival, and the pathways underlying its homeostasis. Utilizing a p63CreERT2-based lineage-tracing strategy in the mammary gland, we observed that cap cells were unipotent and only generated cells with basal characteristics. Moreover, we found that dislocated cap cells underwent apoptosis and contributed to lumen formation during mammary ductal morphogenesis. We identified a critical role for the FOXO family of TFs in determining cell cycle dynamics and survival in cap cells. Importantly, we observed that the WNT signaling pathway modulated FOXO localization and subsequent transcriptional output, potentially through AKT. Significantly, this mode of WNT regulation of FOXO1 may apply to other stem cell systems as well as pathological contexts.
STAR Methods
KEY RESOURCES TABLE
| REAGENT or RESOURCE | SOURCE | IDENTIFIER |
|---|---|---|
| Antibodies | ||
| Mouse monoclonal anti-GFP | Clontech Laboratories Inc. | Cat# 632381; RRID:AB_2313808 |
| Rabbit polyclonal anti-RFP | Rockland | Cat# 600-401-379, RRID:AB_2209751 |
| Rat monoclonal anti-Keratin 8 | Developmental Studies Hybridoma Bank (DSHB) | Cat# TROMA-I, RRID:AB_531826 |
| Rabbit polyclonal anti-Keratin 5 | BioLegend | Cat# 905501, RRID:AB_2565050 |
| Mouse monoclonal anti-p63 | Santa Cruz Biotechnology | Cat# sc-8431, RRID:AB_628091 |
| Mouse monoclonal anti-αSMA | Sigma-Aldrich | Cat# A2547, RRID:AB_476701 |
| Rat monoclonal anti-BrdU | Abcam | Cat# ab6326, RRID:AB_305426 |
| Rabbit polyclonal anti-pH3 | Cell Signaling Technology | Cat# 9701L, RRID:AB_331535 |
| Rabbit polyclonal anti-cc3 | Cell Signaling Technology | Cat# 9661, RRID:AB_2341188 |
| Rabbit monoclonal anti-FoxO1 | Cell Signaling Technology | Cat# 2880, RRID:AB_2106495 |
| Mouse monoclonal anti-β-catenin | BD Biosciences | Cat# 610154, RRID:AB_397555 |
| Rabbit monoclonal anti-pAkt(S473) | Cell Signaling Technology | Cat# 3787, RRID:AB_331170 |
| Rabbit polyclonal anti-pFoxO1(T24)/FoxO3(T32) | Cell Signaling Technology | Cat# 9464, RRID:AB_329842 |
| Rabbit polyclonal anti-pFoxO1(S256) | Cell Signaling Technology | Cat# 9461, RRID:AB_329831 |
| Rabbit polyclonal anti-pAkt(S473) | Cell Signaling Technology | Cat# 9271, RRID:AB_329825 |
| Mouse monoclonal anti-pAkt(T308) | Cell Signaling Technology | Cat# 5106S, RRID:AB_836861 |
| Rabbit polyclonal anti-Akt | Cell Signaling Technology | Cat# 9272, RRID:AB_329827 |
| Rabbit polyclonal anti-pLrp6(S1490) | Cell Signaling Technology | Cat# 2568, RRID:AB_2139327 |
| Rabbit monoclonal anti-Lrp6 | Cell Signaling Technology | Cat# 3395S, RRID:AB_1950408 |
| Rabbit monoclonal anti-GAPDH | Cell Signaling Technology | Cat# 2118, RRID:AB_561053 |
| Rat monoclonal CD24-APC | BioLegend | Cat# 101813, RRID:AB_439715 |
| Hamster monoclonal CD29-Pacific Blue | BioLegend | Cat# 102224, RRID:AB_2128079 |
| Rat monoclonal CD24-Pacific Blue | BioLegend | Cat# 101819, RRID:AB_572010 |
| Hamster monoclonal CD29- APC/Cy7 | BioLegend | Cat# 102225, RRID:AB_2128078 |
| Bacterial and Virus Strains | ||
| 7TGC – Lentiviral Wnt reporter | (Fuerer and Nusse, 2010) | Addgene ID:24304 |
| 7TC – Lentiviral Wnt reporter | (ten Berge et al., 2008) | Addgene ID:24315 |
| Biological Samples | ||
| MTB-TWNT mice mammary tissue blocks | (Gunther et al., 2003) | Gift, Chodosh lab |
| Chemicals, Peptides, and Recombinant Proteins | ||
| Tamoxifen | Sigma-Aldrich | Cat# T5648, CAS: 10540-29-1 |
| Sesame oil | Sigma-Aldrich | Cat# 3547, CAS: 8008-74-0 |
| Collagenase A | Sigma-Aldrich | Cat# 11088793001, CAS: 9001-12-1 |
| Sytox Red | Thermo Fisher Scientific | Cat# S34859 |
| Matrigel | Corning | Cat# 354320 |
| NucBlue/DAPI Fixed Cell Reagent | Thermo Fisher Scientific | Cat# R37606 |
| Aqua-Poly/Mount | Polysciences, Inc. | Cat# 18606-20 |
| RIPA Lysis and Extraction Buffer | Thermo Fisher Scientific | Cat# 89900 |
| EDTA-free Protease Inhibitor Cocktail | Roche | Cat# 04693132001 |
| PhosSTOP Phosphatase Inhibitor Tablets | Roche | Cat# 04906837001 |
| 2x Laemmli buffer | Bio-Rad | Cat# 161-0737 |
| TransIT-293 Transfection reagent | Mirus Bio LLC | Cat# MIR2705 |
| TransITX2 Transfection reagent | Mirus Bio LLC | Cat# MIR6004 |
| LGK-974 | Selleckchem | Cat# S7143, CAS: 1243244-14-5 |
| MK-2206 | Selleckchem | Cat# S1078, CAS: 1032350-13-2 |
| BrdU | Sigma-Aldrich | Cat# B5002, CAS: 59-14-3 |
| Recombinant human Wnt3a protein | R&D Systems | Cat# 5036-WN/CF |
| Critical Commercial Assays | ||
| EasySep Mouse Mammary Stem Cell Enrichment Kit | Stem Cell Technologies | Cat# 19757 |
| PicoPure RNA Isolation kit | Thermo Fisher Scientific | Cat# KIT0204 |
| Ovation qPCR system | NuGEN | Cat# 2210-24 |
| Ovation RNA-Seq System V2 | NuGEN | Cat# 7102-32 |
| ThruPLEX DNA-seq kit | Rubicon Genomics | Cat# R400406 |
| AmfiSure qGreen qPCR master mix | GenDEPOT | Cat# Q5602-005 |
| Mouse On Mouse (M.O.M) kit | Vector Laboratories | Cat# BMK-2202 |
| TSA Fluorescein System | Perkin Elmer | Cat# NEL701A001KT |
| ABC reagent | Vector Laboratories | Cat# PK-7100 |
| DAB substrate | Vector Laboratories | Cat# SK-4100 |
| Deposited Data | ||
| Cap versus basal mammary epithelial cell RNA-seq data | Gene Expression Omnibus | GEO: GSE81385 |
| Experimental Models: Cell Lines | ||
| Human: 293T cells | ATCC | Cat# CRL-3216 |
| Human: MCF-10a/5e clone | (Wang et al., 2011) | Gift, Janes lab |
| Mouse: 2508Wnt1-YL MMTV-Wnt1 tumor-derived cell line | (Batts et al., 2011) | Gift, Li lab |
| Experimental Models: Organisms/Strains | ||
| Mouse: BALB/c mice | Envigo | Order code:047 |
| Mouse: C57BL/6J mice | The Jackson Laboratory | Stock No.:000664 |
| Mouse: RosamT/mG mice | The Jackson Laboratory | Stock No.:007576 |
| Mouse: p63CreERT2 knock-in mice | (Lee et al., 2014) | N/A |
| Mouse: p63CreERT2; RosamT/mG mice | This paper | N/A, mixed background |
| Mouse: s-shipeGFP/+ transgenic mice | (Bai and Rohrschneider, 2010) | N/A |
| Mouse: MMTVWnt1/+ transgenic mice | (Tsukamoto et al., 1988) | N/A |
| Mouse: MMTVWnt1/+; s-shipeGFP/+ transgenic mice | This paper | N/A, mixed background |
| Mouse: Foxo1fl/−;Foxo3fl/fl mice | (Liu et al., 2013b) | N/A |
| Mouse: Foxo1fl/−;Foxo3fl/fl; p63CreERT2; RosamT/mG mice | This paper | N/A, mixed background |
| Oligonucleotides | ||
| siRNAs | ||
| SignalSilence Akt siRNAI | Cell Signaling Technology | Cat# 6211 |
| SignalSilence Akt siRNAII | Cell Signaling Technology | Cat# 6510 |
| Primers - See Table S2 | ||
| Recombinant DNA | ||
| FOXO1-GFP fusion plasmid | (Frescas et al., 2005) | Addgene ID:17551 |
| FOXO1-ADA-GFP fusion plasmid | (Qiang et al., 2010) | Addgene ID:35640 |
| Software and Algorithms | ||
| FlowJo v.10.2 | FlowJo, LLC | RRID:SCR_008520 |
| Cufflinks (Galaxy tool v.2.2.1.0) | http://cole-trapnell-lab.github.io/cufflinks/ | RRID:SCR_014597 |
| Gene set enrichment analysis (GSEA) | (Subramanian et al., 2005) | N/A |
| MSigDB (C3-TFT) | http://software.broadinstitute.org/gsea/msigdb/collections.jsp#C3 | N/A |
| NIS Elements Confocal Acquisition software | Nikon Instruments Inc. | N/A |
| Image Pro Plus 6.1 software | Media Cybernetics | N/A |
| Fiji | http://fiji.sc | RRID:SCR_002285 |
| GraphPad Prism 7 | http://www.graphpad.com | RRID:SCR_002798 |
CONTACT FOR REAGENT AND RESOURCE SHARING
Further information and requests for resources and reagents should be directed to and will be fulfilled by the Lead Contact, Jeffrey M. Rosen (jrosen@bcm.edu).
EXPERIMENTAL MODEL AND SUBJECT DETAILS
Animal studies
Animals were housed under a 14-h light, 10-h dark cycle in the Center for Comparative Medicine facility at Baylor College of Medicine. Animals were provided food and water ad libitum. All mice treatment, surgery, and euthanasia protocols utilized in this study were reviewed and approved by the Institutional Animal Care and Use Committee (IACUC) at Baylor College of Medicine. BALB/c mice and C57BL/6J wild-type mice were purchased from Envigo (previously Harlan Laboratories). RosamT/mG mice (stock # 007576) were purchased from the Jackson Laboratory and subsequently maintained. p63CreERT2 knock-in mice were obtained from Dr. Jianming Xu and generated as described previously (Lee et al., 2014). Tg11.5kb-GFP mice (s-shipeGFP/+ mice) were obtained from Dr. Lixia Bai and generated as described previously. s-shipeGFP/+ mice were also backcrossed into the BALB/c background for >eight generations. MMTVWnt1/+ transgenic mice were obtained from Dr. Yi Li and generated as described previously (Tsukamoto et al., 1988). MMTVWnt1/+ mice were crossed to s-shipeGFP/+ mice and maintained on a mixed background. Foxo1fl/−;Foxo3fl/fl mice were obtained from Dr. JoAnne Richards (Liu et al., 2013b) and crossed to p63CreERT2/+;RosamTmG/+ mice. Pubertal female mice (4–6 weeks of age) were used for experiments except when indicated otherwise.
Cell culture
The HEK-293T cell line was originally sourced from the American Type Culture Collection (CRL-3216, ATCC). Cell lines were maintained in DMEM media containing 10% Fetal Bovine Serum (FBS) and 1% Antibiotic-Antimycotic (AA). Cells were maintained at low passage numbers (<10) and were confirmed to be mycoplasma-free. HEK-293T cells are derived from a human female fetal kidney.
The MCF-10a/5E clone is reported to express FOXO1 and FOXO3 and was cultured as described (Wang et al., 2011). Cells were maintained in DMEM/F12 media containing 5% Horse Serum, 20ng/ml EGF, 0.5mg/ml Hydrocortisone, 100ng/ml Cholera Toxin, 10μg/ml insulin, 1% Pen/Strep. Cells were maintained at low passage numbers (<5) and were confirmed to be mycoplasma-free. MCF-10a parent cell lines were derived from a human female adult breast.
2508Wnt1-YL MMTV-Wnt1 female mouse transgenic tumor-derived cell lines were maintained in DMEM/F12 media containing 2.5% FBS, 20ng/ml EGF, 10μg/ml insulin, 1% Pen/Strep. Cells were tested for the retention of the MMTV-Wnt1 transgene. Cells were maintained at low passage numbers (<5) and were confirmed to be mycoplasma-free.
METHOD DETAILS
Tamoxifen treatment for Cre activation
Pubertal mice (5–6 weeks of age; postnatal day P32 for lineage-tracing experiments) received a single i.p injection of tamoxifen at a dose of 2mg/25g body weight (Tam). A 20mg/ml stock solution of tamoxifen (T5648, Sigma-Aldrich) was prepared in 90% sesame oil/10% ethanol, aliquoted and dissolved at 50°C prior to use. Control mice were injected with an equivalent volume of 90% sesame oil/10% ethanol (Veh).
Mammary epithelial cell preparation
The detailed protocol for the mammary epithelial cell preparation can be found at: https://media.bcm.edu/documents/2015/71/pmec-isolation-and-transduction-protocol.pdf. Briefly, inguinal and thoracic mammary glands from pubertal female mice were dissected, weighed and chopped using a McIlwain Tissue Chopper to generate ~1mm2 pieces of tissue. These pieces were subsequently digested in DMEM/F12 containing 1mg/ml Collagenase A (11088793001, Sigma-Aldrich) for 2 h at 37°C, 125rpm rotation. The digest was then spun three times at 1500 rpm for 8 sec each to enrich for mammary epithelial organoids. These were digested to single cells using 0.25% trypsin and mechanical dissociation, followed by filtration through a 40μm mesh. Single cells were washed with HBSS+ (HBSS containing 2% FBS and 10mM HEPES) and processed for lineage depletion using the EasySep Mouse Mammary Stem Cell Enrichment Kit (19757, Stem Cell Technologies). Resulting cells were suspended at <107 cells/ml in HBSS+ and stained with antibodies at 1:100 dilution for 30 min on ice. The following anti-mouse antibodies were used to isolate basal and luminal fractions: CD24-APC (101813, BioLegend), CD29-Pacific Blue (102224, BioLegend), CD24-Pacific Blue (101819, BioLegend), and CD29-APC/Cy7 (102225, BioLegend). Sytox Red (S34859, Thermo Fisher Scientific) at 1:1000 dilution was used to distinguish live cells from dead cells. Cells were analyzed using a cell analyzer (LSR Fortessa, BD) or sorted using a cell sorter (Aria II, BD). Data were processed using FlowJo v.10.2.
Lentiviral transduction
The single cell suspension obtained after trypsinization, filtation, and washing as above were seeded in a low-attachment 24-well plate at 500,000 cells/well. These cells were infected overnight with the 7TCF-mCherry lentivirus at an MOI of 30 in 800μl growth medium. The cell clumps were washed 3x with PBS and resuspended in a 1:1 ratio of HBSS:Matrigel (354230, Corning) to achieve a concentration of ~10,000 cells/10μl for cleared mammary fat pad injections.
RNA isolation and RNA-seq analysis
RNA was isolated from sorted mammary cells using the PicoPure RNA Isolation kit (KIT0204, Thermo Fisher Scientific) using the manufacturer’s protocol. The Genomic and RNA Profiling (GARP) core at Baylor College of Medicine performed quality control and subsequent amplification of RNA samples derived from biological replicates using the Ovation qPCR system (2210-24, NuGEN) or the Ovation RNA-Seq System V2 (7102-32, NuGEN) for qPCR and RNA-Seq downstream applications, respectively. RNA-seq samples were isolated from s-ship-eGFP high, low, and negative sorted cells in triplicates. Library preparation for RNA-Seq was performed using the ThruPLEX DNA-seq kit (R400406, Rubicon Genomics). Average reads derived per sample were 80 million. ERCC spike-in controls were used to normalize data. RNA sequencing reads in FASTQ files were mapped to mm10 whole genome using TopHat (Galaxy tool v.0.9) with parameters –r10. UCSC known transcripts were supplied in GTF format file. Fragments per kilobase of transcript per million mapped reads (FPKM) were calculated using Cufflinks (Galaxy tool v.2.2.1.0) with parameters –r 0. Gene set enrichment analysis (GSEA)(Subramanian et al., 2005) was carried out using signal-to-noise as the ranking metric, “weighted” scoring scheme, and 1000 gene set permutations. Genes were defined as significant if the computed t-test p-value was < 0.01 and the Log2 fold change in expression was >1.4.
TF motif analysis
MSigDB (C3-TFT) was utilized to identify TF motifs in s-ship-eGFP high versus negative differentially expressed genes. Total number of unique genes profiled by RNA-seq (n=15364) was used as the reference population. P-value by one-sided Fisher’s exact test. False Discovery Rates (FDR) based on the total of 616 motifs tested for enrichment.
Quantitative RT-PCR
qRT-PCR was performed on RNA isolated as described above. AmfiSure qGreen qPCR master mix (Q5602-005, GenDEPOT) was used and qPCR was performed on the StepOne Plus instrument (Applied Biosystems). Primers were designed using the Roche Universal Probe Library. See Table S2 for primer sequences. Analysis of gene expression changes was performed using the ΔΔCt method after normalizing to the housekeeping gene (β-actin).
In vivo drug treatments
z-VAD-FMK
Pubertal sibling mice (5–6 weeks of age) were randomized into treatment or vehicle groups and received daily i.p. injections of 2μg/g body weight of z-VAD-FMK (FMK001, R&D Systems) or equivalent volume of 1% DMSO/sterile saline for 3 consecutive days. Mice were euthanized on day 4, and mammary glands were harvested and processed as described below. A priori sample size estimation was not performed.
LGK974
Pubertal sibling mice (5–6 weeks of age) were randomized into treatment or vehicle groups and administered daily doses of 6μg/g body weight of LGK974 (S7143, Selleckchem) or equivalent volume of 0.5% methylcellulose/0.5% Tween-80. Mice were euthanized after 24, 48, or 72 h of treatment, and mammary glands were harvested and processed as described below. A priori sample size estimation was not performed.
BrdU incorporation
For proliferation studies, mice received a single i.p. injection of 60μg/g body weight of BrdU (B5002, Sigma-Aldrich) 2 h prior to sample collection.
Mammary gland isolation for immunostaining
Inguinal and thoracic mammary glands were dissected post euthanasia and flattened between glass plates for fluorescent wholemount stereoscopic analysis. Glands were fixed in 4% paraformaldehyde overnight at 4°C, before being processed and embedded as paraffin blocks. Sections (15μm) were cut and transferred to HistoBond+ slides. Prior to immunostaining, sections were deparaffinized and rehydrated. Sections were then subjected to heat-based antigen retrieval by boiling slides in Tris-EDTA buffer (10mM Tris base, 1mM EDTA, and 0.05% Tween-20, pH=9) for 20 min in a microwave. Sections were blocked for 1 h at room temperature using 5% goat serum in PBST + M.O.M. block (BMK-2202, Vector Laboratories) as per the manufacturer’s instructions. Subsequently, primary antibodies were diluted in 5% goat serum in PBST + M.O.M. diluent and added onto sections for overnight incubation at 4°C. Slides were then rinsed with PBST before incubating with goat-raised, Alexa Fluor-conjugated secondary antibodies (diluted 1:1000 in PBST for 1.5 hr) at room temperature for IF. Sections were subsequently rinsed with PBST and incubated with NucBlue/DAPI Fixed Cell Reagent (R37606, Thermo Fisher Scientific) for 30 min. Slides were then mounted using Aqua-Poly/Mount (18606-20, Polysciences, Inc.) and a glass coverslip, and allowed to air-dry overnight prior to imaging. For FOXO1 IF, the same protocol was applied, but an additional amplification protocol was incorporated (NEL701A001KT, Perkin Elmer) as per the manufacturer’s instructions. For IHC, a similar protocol was followed, but biotinylated secondary antibodies were used instead, followed by use of the ABC reagent (PK-7100, Vector Laboratories) and DAB substrate (SK-4100, Vector Laboratories). Detailed protocols for IF, TSA amplification, and IHC can be obtained here: https://media.bcm.edu/documents/2014/78/immunofluorescencegeneralprotocol.pdf https://media.bcm.edu/documents/2015/9a/tsa-immunofluorescence-amplification.pdf https://media.bcm.edu/documents/2014/a0/immunohistochemistrygeneralprotocol.pdf The primary antibodies used were as follows: mouse anti-GFP – 1:250 (632381, Clontech), rabbit anti-RFP – 1:150 (600-401-379, Rockland), rat anti-K8 – 1:250 (TROMA-I, Developmental Studies Hybridoma Bank), rabbit anti-K5 – 1:5000 (905501, BioLegend), mouse anti-p63 – 1:500 (sc-8431, Santa Cruz Biotechnology), mouse anti-αSMA – 1:500 (A2547, Sigma-Aldrich), rat anti-BrdU – 1:250 (ab6326, Abcam), rabbit anti-pH3 – 1:250 (9701, Cell Signaling Technology), rabbit anti-cc3 – 1:250 (9661, Cell Signaling Technology), rabbit anti-FoxO1 – 1:500 (2880, Cell Signaling Technology), mouse anti-β-catenin – 1:150 (610154, BD Biosciences), and rabbit anti-phospho-Akt – 1:50 (3787, Cell Signaling Technology).
Image acquisition
All IF images were captured using the Nikon A1-R confocal microscope equipped with NIS Elements Acquisition software. Optimal step size for confocal images was determined based on the objective lens type, magnification and numerical aperture using Nyquist step and pixel size recommendations: http://nic.feinberg.northwestern.edu/content/Depot/step_pixel_chart.pdf.
Fluorescent wholemount imaging of the mammary gland was performed using the Leica MZ16F stereomicroscope equipped with the Image Pro Plus 6.1 software. Analysis and cell counts were performed using the Fiji open source image-processing program. Western blot chemiluminescent signal was detected and imaged using the Amersham Imager 600 (GE Healthcare Life Sciences).
Image quantification
Proximal versus distal notations
These spatial distinctions were assigned roughly by eye using the following metric due to conformational variability between glands. At t1, TEBs are present but not in a fully developed front. In this case, the region surrounding the collecting duct adjacent to the nipple is referred to as ‘proximal’, whereas the TEBs and subtending ducts are referred to as ‘distal’. At t2, the segregation between regions proximal and distal from the nipple is much more distinct. The entire epithelium is roughly considered as 3 parts of a whole where the distal 1/3rd comprises the TEB front whereas the proximal 1/3rd comprises the nipple and primary duct. At t3, the entire mammary fat pad is considered 4 parts of a whole with distal and proximal quarters thus assigned.
TEB counts
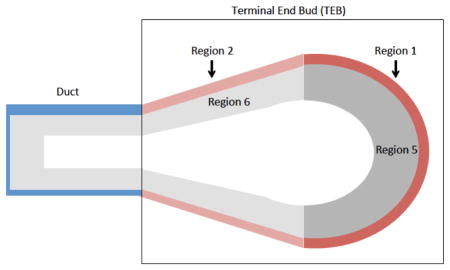
Adapted after (Paine et al., 2016). TEBs were identified as the bulbous tips of ducts and demarcated distinct from the duct at the narrowest region of the bulb structure (in the case of sections with trailing ducts). Cells in the outer single layer with basal/cap markers (K5, αSMA, p63, s-ship-eGFP) in regions 1 and 2 are referred to as cap cells. Cells with basal/cap markers (K5, αSMA, p63, s-ship-eGFP) in regions 5 and 6 delaminated from the outer single layer of cells were quantified as cap-in-body cells. Body cells were identified by luminal marker K8.
In vitro treatments
Cells were transfected using TransIT-293 Transfection reagent (MIR 2705, Mirus) as per the manufacturer’s protocol. Plasmids used include the FOXO1-GFP fusion plasmid (17551, Addgene) and the FOXO1-ADA-GFP fusion plasmid (35640, Addgene) kindly deposited by Dr. Domenico Accili.
For treatment studies, cells were serum-starved overnight (DMEM + 0.1% FBS + 1%AA) before addition of WNT3A ligand at lo=50ng/ml or hi=100ng/ml concentrations (5036-WN-010, R&D Systems). All comparisons were made to cells treated with vehicle (PBS) at 15 min post addition of the ligand.
For 2508Wnt1-YLexperiments, cells were transduced with lentiviral Wnt reporter 7TGC at an MOI=10. Transduced cells were serum-starved overnight before treatment with WNT3A (hi=100ng/ml), WNTi (LGK974, 1μM), or AKTi (MK2206, 10μM) for 24 h before the experimental endpoint.
For AKTi experiments, 293T cells were pre-treated with 10μM MK-2206 (S1078, Selleckchem) for 30 min before WNT ligand addition as described above. The vehicle control in this case was an equivalent volume of DMSO.
For siRNA experiments, 293T cells were transfected with 2 siRNAs against Akt (6211 & 6510, Cell Signaling Technologies) using TransIT-293 Transfection reagent (MIR 6004, Mirus) as per the manufacturer’s protocol.
Western blot analysis
Cells were scraped in ice cold RIPA Lysis and Extraction Buffer (89900, Thermo Fisher Scientific) containing protease and phosphatase inhibitors. The lysate was placed on ice for 30 min and mechanically dispersed every 10 min. The resulting lysate was spun at 13000×g for 25 min and the supernatant was collected. Protein concentrations were determined using the Bradford assay and 50μg of protein was loaded in the presence of Laemmli buffer into each well of a 10% Tris Glycine SDS-polyacrylamide gel and run. Transfers were carried out overnight at 4°C onto a PVDF membrane. Membranes were blocked in 5% milk-TBST and incubated overnight at 4°C with the following primary antibodies in 5% BSA-TBST: rabbit anti-phospho-FoxO1(T24)/FoxO3(T32) – 1:1000 (9464, Cell Signaling Technology), rabbit anti-phospho-FoxO1(S256) – 1:1000 (9461, Cell Signaling Technology), rabbit anti-FoxO1 – 1:1000 (2880, Cell Signaling Technology), rabbit anti-phospho-Akt(S473) – 1:1000 (9271, Cell Signaling Technology), mouse anti-phospho-Akt(T308) – 1:1000 (5106, Cell Signaling Technology), rabbit anti-Akt – 1:1000 (9272, Cell Signaling Technology), rabbit anti-phospho-PDK1 – 1:1000 (3438, Cell Signaling Technology), rabbit anti-PDK1 – 1:1000 (3062, Cell Signaling Technology), and rabbit anti-phospho-mTOR – 1:1000 (2971, Cell Signaling Technology), rabbit anti-mTOR – 1:1000 (2972, Cell Signaling Technology), The housekeeping gene control antibody was rabbit anti-GAPDH – 1:4000 (2118, Cell Signaling Technology).
QUANTIFICATION AND STATISTICAL ANALYSIS
Quantification graphs indicate mean ± SD. Student’s t-test (unpaired) was used to compute statistical significance in all counts comparing %BrdU, PH3, cc3, and TUNEL+ cells. The percentage positivity in all TEB populations is compared to the cap-in-body cell population. p-values for qRT-PCR fold changes are calculated using Student’s t-test (paired) comparing levels in recombined and unrecombined cells sorted from the same mice. Two-way ANOVA was performed on graphs depicting the effect of WNTi treatment in vivo at 24 and 72 h. p-values for GO terms were calculated using Fisher’s exact test (one-sided).
DATA AND SOFTWARE AVAILABILITY
RNA-sequencing analysis of cap versus basal cells from s-ship-eGFP mice has been deposited into the Gene Expression Omnibus (https://www.ncbi.nlm.nih.gov/geo/, GEO: GSE81385).
Supplementary Material
Highlights.
Cap cells are unipotent and contribute only to the basal layer
Dislocated cap cells, i.e., cap-in-body cells, are non-proliferative and apoptotic
FOXO-mediated transcription underlies this non-proliferation and apoptosis
WNT signaling causes FOXO nuclear exclusion, promoting cap cell survival
Acknowledgments
We thank Drs. Amy Shore and Sarah Kurley for their valuable input, Mahnaz Janghorban for assistance with drug treatments and Fengju Chen for assistance with the RNA-seq analysis. We thank Drs. Lixia Bai (FHCRC, Seattle), Kevin Janes (UVa, Charlottesville), and Yi Li (BCM, Houston) for kindly providing the s-ship-eGFP mice, MCF-10a/5E cell line clone, and 2508Wnt1-YL cell line respectively. We thank Alvenia Daniels, Maria Gonzalez-Rimbau, and Shirley Small for general lab management and mouse colony maintenance. This project was supported by the Genetically Engineered Mouse Core (funded by NCI P30 CA125123), Cytometry and Cell Sorting Core (funded by NIH P30 AI036211, P30 CA125123, and S10 RR024574), the Genomics and RNA Profiling Core (funded by NIDDK P30 DK56338 and NCI P30 CA125123), the Integrated Microscopy Core (funded by NIH DK56338, and CA125123, the Dan L. Duncan Cancer Center, and the John S. Dunn Gulf Coast Consortium for Chemical Genomics), and the Optical Imaging and Vital Microscopy Core at Baylor College of Medicine. This work was funded by the NCI-CA16303 (J.M.R.), NIH-CA112403 (J.X.), NIH-CA193455 (J.X.) grants and the CPRIT pre-doctoral training fellowship RP140102 (A.S). The authors declare no conflicts of interest.
Footnotes
Author Contributions
Conceptualization, A.S., J.S.R., and J.M.R.; Methodology, A.S., J.X., L.A.C., J.S.R., and J.M.R.; Validation, A.S., M.T., and E.T.; Formal Analysis, A.S., E.T., and C.J.C.; Investigation, A.S., M.J.T., E.T., K.P.R.; Resources, G.K.B., J.X., L.A.C., J.S.R. and J.M.R.; Writing – Original Draft, A.S. and J.M.R.; Visualization, A.S.; Supervision, A.S., and J.M.R.; Funding Acquisition, A.S., and J.M.R.
Publisher's Disclaimer: This is a PDF file of an unedited manuscript that has been accepted for publication. As a service to our customers we are providing this early version of the manuscript. The manuscript will undergo copyediting, typesetting, and review of the resulting proof before it is published in its final citable form. Please note that during the production process errors may be discovered which could affect the content, and all legal disclaimers that apply to the journal pertain.
References
- Bai L, Rohrschneider LR. s-SHIP promoter expression marks activated stem cells in developing mouse mammary tissue. Genes Dev. 2010;24:1882–1892. doi: 10.1101/gad.1932810. [DOI] [PMC free article] [PubMed] [Google Scholar]
- Ballard MS, Zhu A, Iwai N, Stensrud M, Mapps A, Postiglione MP, Knoblich JA, Hinck L. Mammary Stem Cell Self-Renewal Is Regulated by Slit2/Robo1 Signaling through SNAI1 and mINSC. Cell Rep. 2015;13:290–301. doi: 10.1016/j.celrep.2015.09.006. [DOI] [PMC free article] [PubMed] [Google Scholar]
- Batts TD, Machado HL, Zhang Y, Creighton CJ, Li Y, Rosen JM. Stem cell antigen-1 (sca-1) regulates mammary tumor development and cell migration. PLoS One. 2011;6:e27841. doi: 10.1371/journal.pone.0027841. [DOI] [PMC free article] [PubMed] [Google Scholar]
- Cai S, Kalisky T, Sahoo D, Dalerba P, Feng W, Lin Y, Qian D, Kong A, Yu J, Wang F, et al. A Quiescent Bcl11b High Stem Cell Population Is Required for Maintenance of the Mammary Gland. Cell Stem Cell. 2016 doi: 10.1016/j.stem.2016.11.007. [DOI] [PMC free article] [PubMed] [Google Scholar]
- Calnan DR, Brunet A. The FoxO code. Oncogene. 2008;27:2276–2288. doi: 10.1038/onc.2008.21. [DOI] [PubMed] [Google Scholar]
- Chakrabarti R, Wei Y, Hwang J, Hang X, Andres Blanco M, Choudhury A, Tiede B, Romano RA, DeCoste C, Mercatali L, et al. DeltaNp63 promotes stem cell activity in mammary gland development and basal-like breast cancer by enhancing Fzd7 expression and Wnt signalling. Nat Cell Biol. 2014;16:1004–1015. 1001–1013. doi: 10.1038/ncb3040. [DOI] [PMC free article] [PubMed] [Google Scholar]
- de Visser KE, Ciampricotti M, Michalak EM, Tan DW, Speksnijder EN, Hau CS, Clevers H, Barker N, Jonkers J. Developmental stage-specific contribution of LGR5(+) cells to basal and luminal epithelial lineages in the postnatal mammary gland. J Pathol. 2012;228:300–309. doi: 10.1002/path.4096. [DOI] [PubMed] [Google Scholar]
- dos Santos CO, Rebbeck C, Rozhkova E, Valentine A, Samuels A, Kadiri LR, Osten P, Harris EY, Uren PJ, Smith AD, et al. Molecular hierarchy of mammary differentiation yields refined markers of mammary stem cells. Proc Natl Acad Sci U S A. 2013;110:7123–7130. doi: 10.1073/pnas.1303919110. [DOI] [PMC free article] [PubMed] [Google Scholar]
- Dravis C, Spike BT, Harrell JC, Johns C, Trejo CL, Southard-Smith EM, Perou CM, Wahl GM. Sox10 Regulates Stem/Progenitor and Mesenchymal Cell States in Mammary Epithelial Cells. Cell Rep. 2015;12:2035–2048. doi: 10.1016/j.celrep.2015.08.040. [DOI] [PMC free article] [PubMed] [Google Scholar]
- Eijkelenboom A, Burgering BM. FOXOs: signalling integrators for homeostasis maintenance. Nat Rev Mol Cell Biol. 2013;14:83–97. doi: 10.1038/nrm3507. [DOI] [PubMed] [Google Scholar]
- Eisenhoffer GT, Loftus PD, Yoshigi M, Otsuna H, Chien CB, Morcos PA, Rosenblatt J. Crowding induces live cell extrusion to maintain homeostatic cell numbers in epithelia. Nature. 2012;484:546–549. doi: 10.1038/nature10999. [DOI] [PMC free article] [PubMed] [Google Scholar]
- Farin HF, Jordens I, Mosa MH, Basak O, Korving J, Tauriello DV, de Punder K, Angers S, Peters PJ, Maurice MM, et al. Visualization of a short-range Wnt gradient in the intestinal stem-cell niche. Nature. 2016;530:340–343. doi: 10.1038/nature16937. [DOI] [PubMed] [Google Scholar]
- Frescas D, Valenti L, Accili D. Nuclear trapping of the forkhead transcription factor FoxO1 via Sirt-dependent deacetylation promotes expression of glucogenetic genes. J Biol Chem. 2005;280:20589–20595. doi: 10.1074/jbc.M412357200. [DOI] [PubMed] [Google Scholar]
- Fu NY, Rios AC, Pal B, Law CW, Jamieson P, Liu R, Vaillant F, Jackling F, Liu KH, Smyth GK, et al. Identification of quiescent and spatially restricted mammary stem cells that are hormone responsive. Nat Cell Biol. 2017;19:164–176. doi: 10.1038/ncb3471. [DOI] [PubMed] [Google Scholar]
- Fuerer C, Nusse R. Lentiviral vectors to probe and manipulate the Wnt signaling pathway. PLoS One. 2010;5:e9370. doi: 10.1371/journal.pone.0009370. [DOI] [PMC free article] [PubMed] [Google Scholar]
- Gunther EJ, Moody SE, Belka GK, Hahn KT, Innocent N, Dugan KD, Cardiff RD, Chodosh LA. Impact of p53 loss on reversal and recurrence of conditional Wnt-induced tumorigenesis. Genes Dev. 2003;17:488–501. doi: 10.1101/gad.1051603. [DOI] [PMC free article] [PubMed] [Google Scholar]
- Guo W, Keckesova Z, Donaher JL, Shibue T, Tischler V, Reinhardt F, Itzkovitz S, Noske A, Zurrer-Hardi U, Bell G, et al. Slug and Sox9 cooperatively determine the mammary stem cell state. Cell. 2012;148:1015–1028. doi: 10.1016/j.cell.2012.02.008. [DOI] [PMC free article] [PubMed] [Google Scholar]
- Habib SJ, Chen BC, Tsai FC, Anastassiadis K, Meyer T, Betzig E, Nusse R. A localized Wnt signal orients asymmetric stem cell division in vitro. Science. 2013;339:1445–1448. doi: 10.1126/science.1231077. [DOI] [PMC free article] [PubMed] [Google Scholar]
- Hinck L, Silberstein GB. Key stages in mammary gland development: the mammary end bud as a motile organ. Breast Cancer Res. 2005;7:245–251. doi: 10.1186/bcr1331. [DOI] [PMC free article] [PubMed] [Google Scholar]
- Holland JD, Klaus A, Garratt AN, Birchmeier W. Wnt signaling in stem and cancer stem cells. Curr Opin Cell Biol. 2013;25:254–264. doi: 10.1016/j.ceb.2013.01.004. [DOI] [PubMed] [Google Scholar]
- Hoogeboom D, Essers MA, Polderman PE, Voets E, Smits LM, Burgering BM. Interaction of FOXO with beta-catenin inhibits beta-catenin/T cell factor activity. J Biol Chem. 2008;283:9224–9230. doi: 10.1074/jbc.M706638200. [DOI] [PubMed] [Google Scholar]
- Huang S, Li Y, Chen Y, Podsypanina K, Chamorro M, Olshen AB, Desai KV, Tann A, Petersen D, Green JE, et al. Changes in gene expression during the development of mammary tumors in MMTV-Wnt-1 transgenic mice. Genome Biol. 2005;6:R84. doi: 10.1186/gb-2005-6-10-r84. [DOI] [PMC free article] [PubMed] [Google Scholar]
- Humphreys RC, Krajewska M, Krnacik S, Jaeger R, Weiher H, Krajewski S, Reed JC, Rosen JM. Apoptosis in the terminal endbud of the murine mammary gland: a mechanism of ductal morphogenesis. Development. 1996;122:4013–4022. doi: 10.1242/dev.122.12.4013. [DOI] [PubMed] [Google Scholar]
- Junankar S, Baker LA, Roden DL, Nair R, Elsworth B, Gallego-Ortega D, Lacaze P, Cazet A, Nikolic I, Teo WS, et al. ID4 controls mammary stem cells and marks breast cancers with a stem cell-like phenotype. Nat Commun. 2015;6:6548. doi: 10.1038/ncomms7548. [DOI] [PubMed] [Google Scholar]
- Kouros-Mehr H, Werb Z. Candidate regulators of mammary branching morphogenesis identified by genome-wide transcript analysis. Dev Dyn. 2006;235:3404–3412. doi: 10.1002/dvdy.20978. [DOI] [PMC free article] [PubMed] [Google Scholar]
- Lee DK, Liu Y, Liao L, Wang F, Xu J. The prostate basal cell (BC) heterogeneity and the p63-positive BC differentiation spectrum in mice. Int J Biol Sci. 2014;10:1007–1017. doi: 10.7150/ijbs.9997. [DOI] [PMC free article] [PubMed] [Google Scholar]
- Li N, Singh S, Cherukuri P, Li H, Yuan Z, Ellisen LW, Wang B, Robbins D, DiRenzo J. Reciprocal intraepithelial interactions between TP63 and hedgehog signaling regulate quiescence and activation of progenitor elaboration by mammary stem cells. Stem Cells. 2008;26:1253–1264. doi: 10.1634/stemcells.2007-0691. [DOI] [PMC free article] [PubMed] [Google Scholar]
- Liu J, Pan S, Hsieh MH, Ng N, Sun F, Wang T, Kasibhatla S, Schuller AG, Li AG, Cheng D, et al. Targeting Wnt-driven cancer through the inhibition of Porcupine by LGK974. Proc Natl Acad Sci U S A. 2013a;110:20224–20229. doi: 10.1073/pnas.1314239110. [DOI] [PMC free article] [PubMed] [Google Scholar]
- Liu Z, Castrillon DH, Zhou W, Richards JS. FOXO1/3 depletion in granulosa cells alters follicle growth, death and regulation of pituitary FSH. Mol Endocrinol. 2013b;27:238–252. doi: 10.1210/me.2012-1296. [DOI] [PMC free article] [PubMed] [Google Scholar]
- Lloyd-Lewis B, Harris OB, Watson CJ, Davis FM. Mammary Stem Cells: Premise, Properties, and Perspectives. Trends Cell Biol. 2017;27:556–567. doi: 10.1016/j.tcb.2017.04.001. [DOI] [PubMed] [Google Scholar]
- Mailleux AA, Overholtzer M, Schmelzle T, Bouillet P, Strasser A, Brugge JS. BIM regulates apoptosis during mammary ductal morphogenesis, and its absence reveals alternative cell death mechanisms. Dev Cell. 2007;12:221–234. doi: 10.1016/j.devcel.2006.12.003. [DOI] [PMC free article] [PubMed] [Google Scholar]
- Muzumdar MD, Tasic B, Miyamichi K, Li L, Luo L. A global double-fluorescent Cre reporter mouse. Genesis. 2007;45:593–605. doi: 10.1002/dvg.20335. [DOI] [PubMed] [Google Scholar]
- Paik JH, Ding Z, Narurkar R, Ramkissoon S, Muller F, Kamoun WS, Chae SS, Zheng H, Ying H, Mahoney J, et al. FoxOs cooperatively regulate diverse pathways governing neural stem cell homeostasis. Cell Stem Cell. 2009;5:540–553. doi: 10.1016/j.stem.2009.09.013. [DOI] [PMC free article] [PubMed] [Google Scholar]
- Paine I, Chauviere A, Landua J, Sreekumar A, Cristini V, Rosen J, Lewis MT. A Geometrically-Constrained Mathematical Model of Mammary Gland Ductal Elongation Reveals Novel Cellular Dynamics within the Terminal End Bud. PLoS Comput Biol. 2016;12:e1004839. doi: 10.1371/journal.pcbi.1004839. [DOI] [PMC free article] [PubMed] [Google Scholar]
- Plaks V, Brenot A, Lawson DA, Linnemann JR, Van Kappel EC, Wong KC, de Sauvage F, Klein OD, Werb Z. Lgr5-expressing cells are sufficient and necessary for postnatal mammary gland organogenesis. Cell Rep. 2013;3:70–78. doi: 10.1016/j.celrep.2012.12.017. [DOI] [PMC free article] [PubMed] [Google Scholar]
- Qiang L, Banks AS, Accili D. Uncoupling of acetylation from phosphorylation regulates FoxO1 function independent of its subcellular localization. J Biol Chem. 2010;285:27396–27401. doi: 10.1074/jbc.M110.140228. [DOI] [PMC free article] [PubMed] [Google Scholar]
- Regan JL, Sourisseau T, Soady K, Kendrick H, McCarthy A, Tang C, Brennan K, Linardopoulos S, White DE, Smalley MJ. Aurora A kinase regulates mammary epithelial cell fate by determining mitotic spindle orientation in a Notch-dependent manner. Cell Rep. 2013;4:110–123. doi: 10.1016/j.celrep.2013.05.044. [DOI] [PubMed] [Google Scholar]
- Roarty K, Shore AN, Creighton CJ, Rosen JM. Ror2 regulates branching, differentiation, and actin-cytoskeletal dynamics within the mammary epithelium. J Cell Biol. 2015;208:351–366. doi: 10.1083/jcb.201408058. [DOI] [PMC free article] [PubMed] [Google Scholar]
- Scheele CL, Hannezo E, Muraro MJ, Zomer A, Langedijk NS, van Oudenaarden A, Simons BD, van Rheenen J. Identity and dynamics of mammary stem cells during branching morphogenesis. Nature. 2017 doi: 10.1038/nature21046. [DOI] [PMC free article] [PubMed] [Google Scholar]
- Shackleton M, Vaillant F, Simpson KJ, Stingl J, Smyth GK, Asselin-Labat ML, Wu L, Lindeman GJ, Visvader JE. Generation of a functional mammary gland from a single stem cell. Nature. 2006;439:84–88. doi: 10.1038/nature04372. [DOI] [PubMed] [Google Scholar]
- Srinivasan K, Strickland P, Valdes A, Shin GC, Hinck L. Netrin-1/neogenin interaction stabilizes multipotent progenitor cap cells during mammary gland morphogenesis. Dev Cell. 2003;4:371–382. doi: 10.1016/s1534-5807(03)00054-6. [DOI] [PubMed] [Google Scholar]
- Stingl J, Eirew P, Ricketson I, Shackleton M, Vaillant F, Choi D, Li HI, Eaves CJ. Purification and unique properties of mammary epithelial stem cells. Nature. 2006;439:993–997. doi: 10.1038/nature04496. [DOI] [PubMed] [Google Scholar]
- Subramanian A, Tamayo P, Mootha VK, Mukherjee S, Ebert BL, Gillette MA, Paulovich A, Pomeroy SL, Golub TR, Lander ES, et al. Gene set enrichment analysis: a knowledge-based approach for interpreting genome-wide expression profiles. Proc Natl Acad Sci U S A. 2005;102:15545–15550. doi: 10.1073/pnas.0506580102. [DOI] [PMC free article] [PubMed] [Google Scholar]
- ten Berge D, Koole W, Fuerer C, Fish M, Eroglu E, Nusse R. Wnt signaling mediates self-organization and axis formation in embryoid bodies. Cell Stem Cell. 2008;3:508–518. doi: 10.1016/j.stem.2008.09.013. [DOI] [PMC free article] [PubMed] [Google Scholar]
- Tepera SB, McCrea PD, Rosen JM. A beta-catenin survival signal is required for normal lobular development in the mammary gland. J Cell Sci. 2003;116:1137–1149. doi: 10.1242/jcs.00334. [DOI] [PubMed] [Google Scholar]
- Tothova Z, Kollipara R, Huntly BJ, Lee BH, Castrillon DH, Cullen DE, McDowell EP, Lazo-Kallanian S, Williams IR, Sears C, et al. FoxOs are critical mediators of hematopoietic stem cell resistance to physiologic oxidative stress. Cell. 2007;128:325–339. doi: 10.1016/j.cell.2007.01.003. [DOI] [PubMed] [Google Scholar]
- Tsukamoto AS, Grosschedl R, Guzman RC, Parslow T, Varmus HE. Expression of the int-1 gene in transgenic mice is associated with mammary gland hyperplasia and adenocarcinomas in male and female mice. Cell. 1988;55:619–625. doi: 10.1016/0092-8674(88)90220-6. [DOI] [PubMed] [Google Scholar]
- van Amerongen R, Bowman AN, Nusse R. Developmental stage and time dictate the fate of Wnt/beta-catenin-responsive stem cells in the mammary gland. Cell Stem Cell. 2012;11:387–400. doi: 10.1016/j.stem.2012.05.023. [DOI] [PubMed] [Google Scholar]
- Wang D, Cai C, Dong X, Yu QC, Zhang XO, Yang L, Zeng YA. Identification of multipotent mammary stem cells by protein C receptor expression. Nature. 2015;517:81–84. doi: 10.1038/nature13851. [DOI] [PubMed] [Google Scholar]
- Wang L, Brugge JS, Janes KA. Intersection of FOXO- and RUNX1-mediated gene expression programs in single breast epithelial cells during morphogenesis and tumor progression. Proc Natl Acad Sci U S A. 2011;108:E803–812. doi: 10.1073/pnas.1103423108. [DOI] [PMC free article] [PubMed] [Google Scholar]
- Williams JM, Daniel CW. Mammary ductal elongation: differentiation of myoepithelium and basal lamina during branching morphogenesis. Dev Biol. 1983;97:274–290. doi: 10.1016/0012-1606(83)90086-6. [DOI] [PubMed] [Google Scholar]
- Zeng YA, Nusse R. Wnt proteins are self-renewal factors for mammary stem cells and promote their long-term expansion in culture. Cell Stem Cell. 2010;6:568–577. doi: 10.1016/j.stem.2010.03.020. [DOI] [PMC free article] [PubMed] [Google Scholar]
Associated Data
This section collects any data citations, data availability statements, or supplementary materials included in this article.