

Abstract
Objectives
Recent studies have highlighted the potential of analyses of genomic sharing to produce insight into the demographic processes affecting human populations. We study ROH in 18 Jewish populations, examining these groups in relation to 123 non-Jewish populations sampled worldwide.
Methods
By sorting ROH into three length classes—short, intermediate, and long—we evaluate the impact of demographic processes on genomic patterns in Jewish populations.
Results
We find that the portion of the genome appearing in long ROH—the length class most directly related to recent consanguinity—closely accords with data gathered from interviews during the 1950s on frequencies of consanguineous unions in various Jewish groups.
Conclusion
A high correlation between 1950s consanguinity levels and coverage by long ROH explains differences across populations in ROH patterns. The dissection of ROH into length classes and the comparison to consanguinity data assist in understanding a number of additional phenomena, including similarities of Jewish populations to Middle Eastern, European, and Central and South Asian non-Jewish populations in short ROH patterns, relative lengths of identity-by-descent tracts in different Jewish groups, and the “population isolate” status of the Ashkenazi Jews.
Keywords: heterozygosity, identity by descent, inbreeding coefficient
Introduction
Genome-based analysis of genetic sharing within and between individuals and use of dense genomic polymorphism data in the direct evaluation of identity by descent (IBD) have provided powerful techniques for enabling advances in human genetics—on problems such as relatedness estimation, inference of population relationships, haplotype phasing and imputation, and various aspects of the mapping of disease-related alleles [1, 2].
Runs of homozygosity (ROH), describing IBD for the two genomic copies possessed by a single diploid individual, represent a particularly informative type of genomic sharing. Because genomic sharing in an individual can result from processes taking place on different time scales, ROH both catalog haplotype homozygosity resulting from shared descent of two parents from the limited number of ancestors who underwent ancient population migrations and record consanguineous unions in the recent ancestors of individuals. ROH studies have been used to measure inbreeding in individuals and populations [3–5], to investigate influences of the features of population history on genetic variation among populations [6–8], as well as to test for influences of genomic homozygosity on phenotypes [9–13].
Levels of homozygosity vary by population as a result of the differing descent of different populations from the ancient migration events that have led to elevated homozygosities. Consequently, Pemberton et al. [8] developed a population-wise method for identifying segments that are sufficiently long to represent ROH. They devised a model-based clustering scheme that partitions the ROH of a population into three classes: short ROH, resulting from the pairing of ancient haplotypes; intermediate ROH, largely reflecting cryptic relatedness within populations or groups of populations; and long ROH, indicating recent consanguinity. This subdivision clarifies that multiple forces underlie the observation that high fractions of the genome lie in ROH in a variety of populations. For example, ancient bottlenecks in some Native American populations generate many “short” ROH, and recent consanguinity produces many “long” ROH in some populations of the Middle East. The ternary system of ROH classification has also been employed in analyzing the distribution of deleterious variants among ROH belonging to each of the three classes [14] and in detecting ROH of different classes from whole-exome sequencing data [15].
In Jewish populations, studies of genomic sharing, primarily in the form of IBD analyses within and between populations, have produced three consistent patterns [16]. First, high levels of IBD sharing between Jewish groups have supported the existence of a component of shared ancestry for Jewish groups in distant locations [17–21]. Second, it has been observed that Jewish groups often have higher levels of within-group IBD sharing than nearby non-Jewish groups [18, 20, 22–24]. Third, studies have noted that Jewish groups vary considerably in their levels of within-group IBD sharing [17, 18, 20, 21].
Here, we investigate ROH in Jewish populations, considering the extra information about consanguinity available from ROH—which examine the two haplotypes of an individual—compared to IBD calculations between individuals or populations. We make use of a remarkable demographic data set on consanguinity collected in the 1950s from many of the groups that we study [25, 26]. By relating ROH to demographic data on consanguinity, we find that the level of consanguinity measured in the populations is predictive of long ROH—both affirming the value of subdividing ROH into length classes and recording genetic evidence of consanguinity practices that existed during the 1950s. The results also contribute insight into the patterns observed in IBD studies in Jewish populations.
Methods
Genotype data processing
We assembled a data set of single-nucleotide polymorphism (SNP) variants that combines information from two sources. The first is the data of Behar et al. [19] on 1,572 individuals from 89 non-Jewish populations originating from Africa, Asia, and Europe, and 202 individuals from 18 widely dispersed Jewish populations. It contains genotype information at 270,898 SNPs. We obtained a count of 89 non-Jewish populations instead of the 88 reported by Behar et al. [19] as we separate two Bantu populations that they grouped together.
The second source consists of the combination of the HGDP-CEPH and HapMap III data sets studied by Verdu et al. [27]. It contains 2,055 non-Jewish individuals (938 HGDP-CEPH, 1,117 HapMap III) from 64 worldwide populations, with genotypes at 590,461 SNPs.
We merged the two data sets as follows:
First, we identified the 32 populations containing exact duplicates of individuals present in both the Behar et al. [19] and Verdu et al. [27] data sets: 31 HGDP-CEPH populations and the HapMap III Gujarati population. For each duplicate pair, one duplicate was removed.
In two of the 31 HGDP-CEPH populations with duplicate individuals (Palestinian and Druze), Behar et al. [19] also included individuals that did not originate from HGDP-CEPH. These individuals were retained, but they were treated as belonging to populations separate from the corresponding HGDP-CEPH populations (annotated 1 for Verdu et al., 2 for Behar et al.).
Two more populations (Russian and Mongolian) appeared in both Behar et al. [19] and Verdu et al. [27], but with no overlap of individuals across data sets. In these cases, all individuals were retained, but for each pair of corresponding samples, the two samples were treated as separate (1 for Verdu et al., 2 for Behar et al.).
Extensive quality control was performed in assembly of the Behar et al. [19] and Verdu et al. [27] data sets from raw genotype data. We retained the SNPs shared by both sources, discarding SNPs present in only one of the data sets. At 757 SNPs, the data sets had genotypes given for opposite strands, and we converted the Behar et al. [19] genotypes to match those from Verdu et al. [27].
After processing, the merged data set consists of 3,105 individuals from 141 populations, 123 non-Jewish and 18 Jewish, genotyped at 257,091 SNPs. We classified non-Jewish populations into geographic regions: Sub-Saharan Africa, the Middle East (together with North Africa), Europe, the Caucasus region, Central and South Asia, East Asia, Oceania, the Americas, and Admixed, containing African-American and Mexican-American samples (Table S1). We classified the 18 Jewish populations into six regional groups, following Behar et al. [19]:
European (Ashkenazi, Italian, Sephardi);
Middle Eastern (Azerbaijani, Georgian, Iranian, Iraqi, Kurdish, Syrian, Uzbekistani);
North African (Algerian, Libyan, Moroccan, Tunisian);
South Asian (Cochin, Mumbai);
Ethiopian;
Yemenite.
The Middle Eastern Jewish group accords with the group termed “Mizrahi” or “Oriental” elsewhere. Note that the regional groups for the Jewish populations do not necessarily map onto single geographic regions among those used for the non-Jewish populations.
Identification of ROH
Within individual genomes, we identified ROH and classified them by size according to the procedure of Pemberton et al. [8]. For each population, we estimated the allele frequencies at each SNP by sampling 40 alleles without replacement, calculating the allele frequencies from the sampled alleles. This resampling procedure is performed to account for sample-size differences across populations (Table S1).
Next, to identify ROH, we employed a likelihood approach adapted by Pemberton et al. [8] from Wang et al. [28]. This approach considers a sliding window of n SNPs that moves along the chromosome with an increment of m SNPs. Because our SNP density was approximately half that of Pemberton et al. [8] (257,091 compared to 577,489), we chose (n, m) = (30, 1), in contrast to (60, 1) in Pemberton et al. [8]. By halving n, we arrange for windows to contain comparably many base pairs to those used by Pemberton et al. [8].
Following Pemberton et al. [8], the strength of autozygosity for a window is quantified by a log-likelihood (LOD score) comparing the hypothesis that the segment is autozygous to the hypothesis that it is non-autozygous, allowing for an error term that accommodates genotyping error or mutation within autozygous regions. As in Pemberton et al. [8], we set the error parameter to 0.001. For each population, we obtained the LOD score distribution across all windows in all individuals, using the density function in R with a Gaussian kernel and default nrd0 bandwidth.
As in Pemberton et al. [8], the LOD score distributions have two modes. The locations of these modes differ by population, and for each population, we followed Pemberton et al. [8] in using as the ROH threshold the local minimum between the modes. All windows whose LOD score exceeded the population-specific threshold were taken to be homozygous, with contiguous windows joined and considered as part of a single ROH.
Size classification of ROH
The length of each SNP window determined to be an ROH was recorded as the length of the interval between its two most extreme SNPs, including the endpoints. Again following Pemberton et al. [8], separately in each population, we modeled the ROH length distribution as a mixture of three Gaussian distributions representing three ROH classes: (A) short ROH measuring tens of kb, (B) intermediate ROH measuring hundreds of kb to a few Mb, and (C) long ROH measuring multiple Mb. Unsupervised three-component Gaussian fitting was performed population-wise, using the Mclust function from the mclust package in R, and allowing component proportions, means, and variances to be free variables.
For each population, let Amin and Amax be minimum and maximum ROH lengths classified as belonging to class A, and define Bmin, Bmax, Cmin, and Cmax analogously. The boundary between classes A and B is given by (Amax + Bmin)/2, and the boundary between classes B and C by (Bmax + Cmin)/2. Across all populations, the A–B boundaries lie in the range [421,410.5 bp, 686,103 bp], with mean 504,952 bp and standard deviation 37,451 bp. The B–C boundaries lie in [1,343,237 bp, 2,325,452 bp], with mean 1,711,184 bp and standard deviation 159,590 bp. Thus, the class boundaries vary across populations, but with all A–B boundaries strictly below all B–C boundaries, so that the classes are clearly delineated.
Demographic data on Jewish patterns of consanguinity
We use demographic data reported by Goldschmidt et al. [25] on the rate of consanguineous unions in different Jewish populations in Israel during 1955–1957. Goldschmidt et al. [25] surveyed 11,424 mothers of newborn babies in maternity wards of eight hospitals in Haifa, Jerusalem, and Tel Aviv, recording data on the unions represented by the parents of the newborns. Among unions classified as consanguineous, three further subdivisions were employed: “first cousins,” “uncle–niece,” and “more distant relationships.”
Nine Jewish populations appear in both our genotype data and the demographic data from Goldschmidt et al. [25]: Ashkenazi, Iranian, Iraqi, Libyan, Moroccan, Sephardi, Syrian, Tunisian, and Yemenite. The Jewish population labeled by Behar et al. [19] as “Iranian” corresponds to the Persian population of Goldschmidt et al. [25]. We treated the Behar et al. “Sephardi” population as commensurable with the Turkish population of Goldschmidt et al., as the Behar et al. Sephardi sample was largely from the Turkish Jewish population.
For each Jewish group, we estimated the overall inbreeding coefficient by weighting the percentages of the population in each of the three consanguinity classes by their associated inbreeding coefficients. For first cousins, this inbreeding coefficient is 1/16; for uncle–niece unions, it is 1/8. For consanguineous unions that are more distant than first cousins, we assigned a value of 1/32. For non-consanguineous unions, we assigned a value of 0.
Results
Jewish ROH lengths in the context of worldwide populations
We first examined the ROH in Jewish populations in relation to those seen in other populations. Summing ROH lengths across the genome, we evaluated, within individuals, the total length of all ROH and the total length of ROH in each length class.
Across all ROH, the worldwide pattern refines the pattern found in Pemberton et al. [8], with an increase in individual-level total ROH length with increasing distance of populations from Sub-Saharan Africa (Figure 1D). The Jewish populations have similar total ROH lengths to non-Jewish populations from the Middle East, Europe, the Caucasus, and Central and South Asia. High variability across individuals in the total ROH length seen within Jewish populations is also observed elsewhere, most frequently in the Middle Eastern, Central and South Asian, and Native American populations.
Figure 1.

Population-specific distributions of ROH length across individuals. (A) Class A ROH. (B) Class B ROH. (C) Class C ROH. (D) All ROH. Each distribution is shown as a violin plot, with the width depicting a kernel density trace and its reflection. A box plot is embedded in each violin plot. The white dot is the median of the distribution. Populations are ordered by regional groupings, and within groups by median total ROH length.
As in Pemberton et al. [8], the median length in an individual’s genome that lies in the shorter class A and B ROH increases stepwise with distance from Africa in successive continental groups (Figure 1A & 1B). For class A ROH in particular, Jewish populations have distributions comparable to the Middle East, Europe, the Caucasus, and Central and South Asia (Figure 1A & S1A). Permutation tests for a difference between a pair of population groups in the median across populations of the median ROH length across individuals—permuting group memberships and recomputing the absolute difference between group medians—confirm this observation, as low P-values, indicating a significant absolute difference from the Jewish populations in class A ROH length, do not occur for these regions (Table 1).
Table 1.
P-values from permutation tests of equality of the median ROH lengths between Jewish and non-Jewish populations.
| Population group | Class A ROH | Class B ROH | Class C ROH | All ROH |
|---|---|---|---|---|
| Africa | 0.00011 | 0.00002 | 0.00370 | 0.00005 |
| Middle East | 0.11594 | 0.00076 | 0.04278 | 0.01085 |
| Europe | 0.51785 | 0.70336 | <0.00001 | 0.00005 |
| Caucasus | 0.05814 | 0.01505 | 0.00289 | 0.00182 |
| Central/South Asia | 0.79118 | 0.24431 | 0.72541 | 0.62450 |
| East Asia | <0.00001 | 0.00004 | 0.00109 | 0.00023 |
| Oceania | 0.00566 | 0.00566 | 0.25843 | 0.00566 |
| Americas | 0.00189 | 0.00172 | 0.00500 | 0.00188 |
| Admixed | 0.11054 | 0.08186 | 0.13437 | 0.04625 |
For each ROH class and each non-Jewish population group, we determined the median ROH length across individuals for each population in the group. The absolute difference of the median of these values across populations from the corresponding median ROH length across Jewish populations was then calculated. The Jewish/non-Jewish labels were permuted among the populations, and the number of permutations for which the permuted absolute difference was greater than or equal to the unpermuted absolute difference was tabulated. The Ethiopian Jewish population was excluded from the Jewish sample for these computations. The number of permutations was 100,000.
Unlike class A and B ROH, which largely follow distance from Africa, class C ROH lengths in non-Jewish populations have the highest values in the Middle East, Central and South Asia, and the Americas (Figure 1C & S1C). As was noted by Pemberton et al. [8], individuals from these regions often possess high degrees of recent parental relatedness. After two Native American populations, the highly consanguineous Samaritan population isolate [29] has the highest median class C ROH length. A number of Jewish populations, including the Mumbai, Kurdish, Iranian, Cochin, and Azerbaijani groups, have particularly long class C ROH. Considerable variability in the pattern of class C ROH exists across Jewish populations, with comparable variation across populations to that seen in non-Jewish populations of the Middle East and Central and South Asia (Figure 1C).
ROH lengths among Jewish populations
To compare ROH patterns across Jewish populations in more detail, we considered only the Jewish samples, reporting in Figure 2 the relationship between ROH lengths in pairs of classes. For ROH lengths in classes A and B, Figure 2A suggests that for Jewish groups, a correlation is largely due to the Ethiopian Jewish population, the only Jewish group with substantial recent Sub-Saharan African ancestry (r = 0.646, P < 2 × 10⁻⁶ including Ethiopian Jews; r = 0.051, P = 0.486 excluding them). At the worldwide level, the major factor that drives strong correlations between class A and B ROH (Figure S2) is high variability across continental regions in the residual signal of ancient migrations outward from Sub-Saharan Africa, whose effects contribute similarly to both classes [8]. With the exception of the Ethiopian Jews, Jewish populations trace to regions at comparable continental locations in terms of distance from Africa, so that continental differences that give rise to the correlation between class A and class B are largely absent.
Figure 2.

Individual-level ROH lengths in pairs of classes, considering individuals in Jewish populations. (A) Class B vs. Class A. (B) Class C vs. Class A. (C) Class C vs. Class B. The dotted regression lines include the Ethiopian Jewish samples, and the dashed regression lines exclude them.
Figure 2B & 2C show that for Jewish samples, neither class A nor class B ROH is strongly correlated with class C ROH (r = 0.243 and r = 0.183 for the correlations of A and C and of B and C with the Ethiopian Jewish population included, r = 0.099 and r = 0.006 for the corresponding calculations excluding it), in the same way that patterns in class C ROH differ from those seen for class A and class B ROH worldwide in Figure 1. The Jewish samples with elevated class C ROH lengths originate mostly from the Middle Eastern and South Asian regional groups, where nearby non-Jewish Middle Eastern and Central and South Asian populations often have relatively high levels of class C ROH as well.
Excluding the Ethiopian Jewish population, observed heterozygosity is strongly negatively correlated with the total length of all ROH (Figure 3D, r = −0.962, P < 2 × 10⁻¹⁶). Unlike in a worldwide analysis, in which the relationship with observed heterozygosity of total length in all ROH is more tightly connected to class A and class B ROH than to class C (Figure S3), in the Jewish samples, this correlation is driven primarily by class C (Figure 3C, r = −0.961, P < 2 × 10⁻¹⁶). The magnitudes of the correlations with observed heterozygosity are lower for class A and B ROH lengths (Figure 3A & 3B, r = −0.137, and r = −0.114, respectively). The pattern further indicates that other than for the Ethiopian Jews, differing ROH patterns across Jewish populations are attributable mainly to differences in class C ROH lengths—and hence, to underlying consanguinity differences—rather than to differences in ROH of classes A and B.
Figure 3.
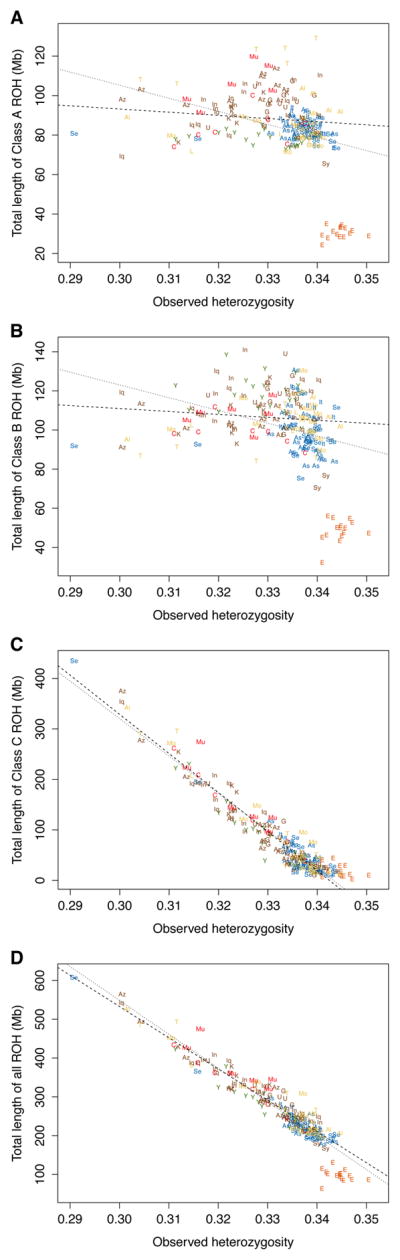
Individual-level ROH lengths and observed heterozygosities for Jewish populations. (A) Class A ROH. (B) Class B ROH. (C) Class C ROH. (D) All ROH. The dotted regression lines include the Ethiopian Jewish samples, and the dashed regression lines exclude them. The legend follows Figure 2.
ROH lengths and consanguinity in Jewish populations
For the Jewish populations, the data of Goldschmidt et al. [25] provide direct measurements of consanguinity. Therefore, with the aim of studying the relationship between demographic and genetic measures of consanguinity, we examined ROH lengths in Jewish populations in relation to the consanguinity rates reported by Goldschmidt et al. [25]. From demographic consanguinity data, we estimated a population inbreeding coefficient for the nine Jewish populations that are also present in our genotype data. Consanguinity rates from Goldschmidt et al. [25] are reproduced in Table 2, which also includes the associated inbreeding coefficients.
Table 2.
Demographic estimates of consanguinity rates in the 1950s, and associated inbreeding coefficients.
| Jewish population | Regional group | Sample size | First cousins | Uncle– niece | More distant | Inbreeding coefficient, F(%) |
|---|---|---|---|---|---|---|
| Iranian | Middle Eastern | 427 | 68 | 7 | (1/32) 37 | 1.471 |
| Iraqi | Middle Eastern | 1,450 | 238 | 16 | 162 | 1.513 |
| Syrian | Middle Eastern | 406 | 15 | 2 | 16 | 0.416 |
|
| ||||||
| Yemenite | Yemenite | 628 | 50 | 4 | 61 | 0.881 |
|
| ||||||
| Ashkenazi | European | 4,734 | 64 | 2 | 50 | 0.123 |
| Sephardi | European | 607 | 19 | 2 | 27 | 0.376 |
|
| ||||||
| Libyan | North African | 298 | 18 | 2 | 12 | 0.587 |
| Moroccan | North African | 504 | 26 | 10 | 18 | 0.682 |
| Tunisian | North African | 149 | 16 | 2 | 2 | 0.881 |
Each data point represents a birth, and the consanguinity of the parents is tabulated, as reported by Goldschmidt et al. [25]. The population inbreeding coefficient is computed by summing 1/16 of the fraction of first-cousin unions, 1/8 of the fraction of uncle–niece unions, and 1/32 of the fraction of more distant unions of relatives.
Figure 4 examines the relationship between ROH lengths in the nine Jewish populations and consanguinity-based inbreeding coefficients. We observe a positive correlation between the inbreeding coefficient of a population and the mean total ROH length of its constituent individuals (Figure 4D). A regression slope of 92.06 indicates that each 1% increase in the inbreeding coefficient contributes 92.06 Mb to the total ROH length, and the high correlation coefficient of r = 0.762 between the mean total ROH length and the inbreeding coefficient has P = 0.017. In considering ROH classes separately, we see that class C ROH length is the most important contributor to this relationship, with both the greatest slope and the largest correlation coefficient (Figure 4C, slope = 61.42, r = 0.765, P = 0.016); values for class A (Figure 4A, slope = 12.10, r = 0.418, P = 0.263) and class B (Figure 4B, slope = 18.54, r =0.621, P = 0.074) are positive for both the slope and the correlation coefficient, but smaller. The stronger relationship between class C ROH and the inbreeding coefficient, which is compatible with the view of class C ROH as reflecting recent consanguinity, is robust to different assumptions regarding the appropriate choice of inbreeding coefficient for relationships more distant than first cousins (Table 3). Note that the intercepts in Figure 4 are non-zero as even with no consanguinity in recent generations, inbreeding in earlier generations produces ROH. Because recent consanguinity is connected primarily to class C ROH, the intercept is lowest for class C.
Figure 4.

ROH lengths and inbreeding coefficients from demographic data for Jewish populations. (A) Class A ROH. (B) Class B ROH. (C) Class C ROH. (D) All ROH. The plots consider nine Jewish populations for which demographic data were available. Panels (A), (B) and (C) are plotted on the same scale, and in (D), the y-axis represents the same height, so that the slopes of all four regression lines are visually comparable. Each point represents an individual, with its x-axis value being the estimated inbreeding coefficient of the population to which it belongs. The diamonds indicate the mean total ROH length of a particular class over all individuals in a population, and the dashed lines represent regression lines for the mean ROH lengths. Population abbreviations, which appear above the figures in alignment with their associated inbreeding coefficients, follow Figure 2.
Table 3.
Slope, correlation coefficient, and P-value for the regression of population mean ROH lengths on inbreeding coefficients, using different values for the inbreeding coefficient value Fdistant for relationships more distant than first cousins.
| Fdistant = 1/16 | Fdistant = 1/32 | Fdistant = 1/64 | |||||||
|---|---|---|---|---|---|---|---|---|---|
|
| |||||||||
| ROH class | Slope | r | P | Slope | r | P | Slope | r | P |
|
| |||||||||
| Class A ROH | 7.67 | 0.317 | 0.406 | 12.10 | 0.418 | 0.263 | 15.28 | 0.481 | 0.190 |
| Class B ROH | 16.40 | 0.657 | 0.055 | 18.54 | 0.621 | 0.074 | 19.42 | 0.593 | 0.093 |
| Class C ROH | 47.81 | 0.712 | 0.031 | 61.42 | 0.765 | 0.016 | 69.95 | 0.794 | 0.011 |
| All ROH | 71.88 | 0.711 | 0.032 | 92.06 | 0.762 | 0.017 | 104.65 | 0.789 | 0.012 |
Discussion
We have analyzed runs of homozygosity in Jewish populations in relation to ROH in other populations. Short and intermediate ROH in Jewish groups, largely representing autozygosity for haplotypes that trace to ancient migration events, follow patterns seen in other groups from Europe and regions of Asia historically inhabited by Jewish populations (Figure 1A & 1B). Long ROH, however, indicating recent parental relatedness, occupy more of the genome in the Jewish populations than in most groups (Figure 1C), and they drive the differences among Jewish populations in total ROH levels (Figure 2 & 3). Many Jewish populations, including the Azerbaijani, Cochin, Georgian, Iranian, Mumbai, Tunisian, Uzbekistani, and Yemenite populations, have some of the highest proportions of their genomes in long ROH among populations worldwide, comparable to many non-Jewish populations of the Middle East and Central and South Asia, and exceeding non-Jewish European and African groups (Figure S1C). These high proportions of long ROH accord with demographic data that also identify high consanguinity levels in various Jewish populations (Figure 4).
Our ROH patterns generally agree with past data on genomic sharing in Jewish and non-Jewish populations. The ROH signals at the level of larger geographic regions add to the work of Pemberton et al. [8], with short and intermediate ROH lengths increasing outward from Africa, and with long ROH occurring frequently in the Middle East, Central and South Asia, and the Americas. The ranking of Jewish populations by total ROH length largely accords with that of Waldman et al. [21], obtained in a separate sample of individuals, with ROH detected using a fixed minimum length threshold for ROH identification rather than employing population-specific thresholds and ROH length classes. Among Jewish populations that overlap between our study and that of Waldman et al. [21], Waldman et al. reported that in decreasing order, the Mumbai, Georgian, Cochin, Libyan, Iranian, Tunisian, Iraqi, Yemenite, Algerian, Moroccan, Italian, Syrian, Ashkenazi, and Turkish populations had the longest median total ROH lengths. The corresponding order in our study is Mumbai, Iranian, Cochin, Tunisian, Georgian, Yemenite, Iraqi, Algerian, Libyan, Moroccan, Italian, Ashkenazi, Sephardi (largely Turkish), and Syrian (Figure 1D). Although the specific rankings differ in several positions, both studies find that ROH values are generally higher in most Middle Eastern, North African, and South Asian Jewish populations than in the Ashkenazi and Sephardi populations.
More generally, studies of IBD levels across individuals within Jewish populations have detected similar patterns to those we have seen for ROH, typically with analogous higher IBD levels in Middle Eastern, North African, and South Asian Jewish populations than in the Ashkenazi and Sephardi groups [17, 18, 20, 21]. By subdividing ROH into classes, we have found that owing to their similar positions in relation to out-of-Africa migrations, the Jewish groups are relatively similar in their short and intermediate ROH, and ROH variability across populations lies primarily in the long ROH. It is possible that increased consanguinity rates that underlie an increase in long ROH can inflate IBD sharing not only for the two haplotypes of the offspring of a consanguineous union, but also for pairs of haplotypes in the population more generally. If consanguinity were to increase IBD sharing in this manner, then variability across Jewish populations in within-population IBD sharing might result in part from the differences among the populations in consanguinity rates. This argument is supported by an observation that in a population pedigree model, an increase in consanguinity decreases the mean time to the most recent common ancestor (TMRCA) of a pair of lineages sampled from different individuals (solving eqs. 1–3 for V in ref. 30). The reduced TMRCA from increased consanguinity has as a consequence an increase in IBD sharing, because less time has transpired on average since the occurrence of recombinations that break down IBD segments. We note, however, that the model [30] that underlies this reasoning uses sib mating; further analysis of consanguinity models suited to human populations will be required for clarifying the relationship between consanguinity and within-population IBD sharing.
In the context of European and European-American populations, the Ashkenazi Jewish population has been seen to have relatively high ROH and between-individual IBD levels [22–24, 31]. With a larger number of European populations tested, this pattern is somewhat supported in our study, as ROH levels in Ashkenazi Jews exceed those in many, though not all, European populations (Figure 1 & S1). Both according to ROH in our study and that of Waldman et al. [21], and by within-population IBD [17, 18, 20, 21], however, Ashkenazi Jews are not among the Jewish populations with the highest levels of genomic sharing. This result is observed for shorter class A and B ROH as well as for the longer class C. The status of the Ashkenazi Jewish group as a relatively homogeneous population isolate in relation to Europeans and European Americans contrasts with its shorter ROH and IBD segments in relation to many Middle Eastern, North African, and South Asian Jewish populations. This contrast also extends to consideration of Mendelian diseases whose prevalences are amplified by consanguinity, as Ashkenazi Jewish populations can be regarded as having a high Mendelian disease burden in the context of European and European-American populations, but not necessarily in relation to other Jewish populations [32].
Because the total lengths of long ROH have a close conceptual relationship with the demographic consanguinity measure—closer than corresponding relationships involving the short and intermediate ROH lengths—the accord of the level of long ROH observed in individual genomes with demographic measures of consanguinity illustrates the perspective of Pemberton et al. [8] that long ROH reflect recent parental relatedness, whereas short and intermediate ROH reflect more ancient migration events. Among Jewish populations, both the lengths of long ROH and consanguinity levels are greatest in geographic regions where the non-Jewish populations also have high total lengths for long ROH. Many factors underlie the historical consanguinity practices of the various Jewish populations, including their levels of isolation from other Jewish populations, their interpretations of Jewish texts favoring consanguinity, and cultural and economic factors [25, 32]. The geographic overlap of high-consanguinity populations suggests that historically, consanguinity in the Jewish populations might have been influenced in some cases by factors similar to those that have contributed to consanguinity in neighboring non-Jewish populations.
We found that each 1% increase in the consanguinity-based inbreeding coefficient predicted an increase of 92.06 Mb in the total length of ROH. This value corresponds to ~3% of the human genome, a larger increase in ROH length than the 1% expected from a 1% inbreeding coefficient increase. Because the consanguinity-based measure is based only on the most recent generation, it does not capture effects of consanguinity in previous generations. Nontrivial consanguinity rates might have persisted over many generations, and a single-generation computation might substantially underestimate the true inbreeding coefficient.
Both for the Jewish populations and for other populations with high median values for the total length of long ROH, the variability across individuals of the total class C ROH length was particularly high. It is possible that like the median, a high variance is also an indicator of high consanguinity levels. In this view, within a population, some individuals might descend from multiple generations of consanguineous union, whereas other family lineages—perhaps even most lineages—might not participate in a cultural preference for consanguinity at all. That such preferences vary among families within populations is seen in the aggregated Ashkenazi Jewish population, for which consanguinity rates vary by country of origin [25, 33]; other variables such as religiosity and education level that can be intergenerationally correlated within families have associations with endogamy levels [33]. Further investigation of intergenerational patterns might shed light on the information possessed by ROH variances regarding consanguinity practices.
The demographic consanguinity data we have used were collected for births that occurred during the 1950s. More recent studies have documented substantial decreases in consanguinity for the Jewish populations [33, 34]. Even when the 1950s data were collected, consanguinity rates were decreasing; although the births for which consanguinity was measured took place during 1955–1957, marriages had a range of dates, and in most populations, more recent marriages had lower consanguinity rates [25, 26]. Our samples, collected from adult volunteers prior to the study of Behar et al. [19], reflect a wide range of ages, and for 54 individuals among the 126 from the nine populations for which consanguinity data were available, we were able to extrapolate from the age at the time of sampling to obtain approximate birth dates. This computation suggests a mean and median birth date of 1963, close to the time at which the consanguinity data were measured, with standard deviation 13 and range [1929, 1989]. It is interesting that although consanguinity rates in the populations have undergone considerable change, ROH evaluated in comparatively small samples of volunteers in the genomic era have recovered the signature of population-level consanguinity patterns measured near the time of their births, six decades ago. Note, however, that the modern sample might not be entirely independent of the 1950s data: because the 1950s data, with sample size >10,000, represent a substantial fraction of all newborns during 1955–1957 [35] in a population of <2,000,000 [36], some of the participants in our study might very well be among those whose mothers were interviewed when they were born.
Genome-wide data sets provide new opportunities for comparing demographic and pedigree-based measures of consanguinity and relatedness with direct measurements of genomic sharing, with increasingly many applications favoring genomic values and even finding that non-genomic values can be unnecessary [37, 38]. We have seen that for understanding population history, including the history of consanguinity, genomic aspects of ROH are highly informative. However, significant additional information was obtained by considering ROH together with demographic data on consanguinity; we expect that studies will have increasing potential to capitalize on combinations of multiple forms of data in studying the recent history of mating practices and their genomic consequences.
Supplementary Material
Acknowledgments
We thank T. J. Pemberton for technical assistance, and NIH grant R01 HG005855 and the Stanford Center for Computational, Evolutionary, and Human Genomics for financial support.
Literature Cited
- 1.Browning SR, Browining BL. Identity by descent between distant relatives: detection and applications. Annu Rev Genet. 2012;46:617–633. doi: 10.1146/annurev-genet-110711-155534. [DOI] [PubMed] [Google Scholar]
- 2.Thompson EA. Identity by descent: variation in meiosis, across genomes, and in populations. Genetics. 2013;194:301–326. doi: 10.1534/genetics.112.148825. [DOI] [PMC free article] [PubMed] [Google Scholar]
- 3.McQuillan R, Leutenegger AL, Abdel-Rahman R, Franklin CS, Pericic M, Barac-Lauc L, Smolej-Narancic N, Janicijevic B, Polasek O, Tenesa A, et al. Runs of homozygosity in European populations. Am J Hum Genet. 2008;83:359–372. doi: 10.1016/j.ajhg.2008.08.007. [DOI] [PMC free article] [PubMed] [Google Scholar]
- 4.Keller MC, Visscher PM, Goddard ME. Quantification of inbreeding due to distant ancestors and its detection using dense single nucleotide polymorphism data. Genetics. 2011;189:237–249. doi: 10.1534/genetics.111.130922. [DOI] [PMC free article] [PubMed] [Google Scholar]
- 5.Rehder CW, David KL, Hirsch B, Toriello HV, Wilson CM, Kearney HM. American College of Medical Genetics and Genomics: standards and guidelines for documenting suspected consanguinity as an incidental finding of genomic testing. Genet Med. 2013;15:150–152. doi: 10.1038/gim.2012.169. [DOI] [PubMed] [Google Scholar]
- 6.Kirin M, McQuillan R, Franklin CS, Campbell H, McKeigue PM, Wilson JF. Genomic runs of homozygosity record population history and consanguinity. PLoS One. 2010;5:e13996. doi: 10.1371/journal.pone.0013996. [DOI] [PMC free article] [PubMed] [Google Scholar]
- 7.Nothnagel M, Lu TT, Kayser M, Krawczak M. Genomic and geographic distribution of SNP-defined runs of homozygosity in Europeans. Hum Mol Genet. 2010;19:2927–2935. doi: 10.1093/hmg/ddq198. [DOI] [PubMed] [Google Scholar]
- 8.Pemberton TJ, Absher D, Feldman MW, Myers RM, Rosenberg NA, Li JZ. Genomic patterns of homozygosity in worldwide human populations. Am J Hum Genet. 2012;91:275–292. doi: 10.1016/j.ajhg.2012.06.014. [DOI] [PMC free article] [PubMed] [Google Scholar]
- 9.Campbell H, Carothers AD, Rudan I, Hayward C, Biloglav Z, Barac L, Pericic M, Janicijevic B, Smolej-Narancic N, Polasek O, et al. Effects of genome-wide heterozygosity on a range of biomedically relevant human quantitative traits. Hum Mol Genet. 2007;16:233–241. doi: 10.1093/hmg/ddl473. [DOI] [PubMed] [Google Scholar]
- 10.Keller MC, Simonson MA, Ripke S, Neale BM, Gejman PV, Howrigan DP, Lee SH, Lencz T, Levinson DF, Sullivan PF, et al. Runs of homozygosity implicate autozygosity as a schizophrenia risk factor. PLoS Genet. 2012;8:e1002656. doi: 10.1371/journal.pgen.1002656. [DOI] [PMC free article] [PubMed] [Google Scholar]
- 11.McQuillan R, Eklund N, Pirastu N, Kuningas M, McEvoy BP, Esko T, Corre T, Davies G, Kaakinen M, Lyytikäinen LP, et al. Evidence of inbreeding depression on human height. PLoS Genet. 2012;8:e1002655. doi: 10.1371/journal.pgen.1002655. [DOI] [PMC free article] [PubMed] [Google Scholar]
- 12.Ghani M, Reitz C, Cheng R, Vardarajan BN, Jun G, Sato C, Naj A, Rajbhandary R, Wang LS, Valladares O, et al. Association of long runs of homozygosity with Alzheimer disease among African American individuals. JAMA Neurol. 2015;72:1313–1323. doi: 10.1001/jamaneurol.2015.1700. [DOI] [PMC free article] [PubMed] [Google Scholar]
- 13.Joshi PK, Esko T, Mattsson H, Eklund N, Gandin I, Nutile T, Jackson AU, Schurmann C, Smith AV, Zhang W, et al. Directional dominance on stature and cognition in diverse human populations. Nature. 2015;523:459–462. doi: 10.1038/nature14618. [DOI] [PMC free article] [PubMed] [Google Scholar]
- 14.Szpiech ZA, Xu J, Pemberton TJ, Peng W, Zöllner S, Rosenberg NA, Li JZ. Long runs of homozygosity are enriched for deleterious variation. Am J Hum Genet. 2013;93:90–102. doi: 10.1016/j.ajhg.2013.05.003. [DOI] [PMC free article] [PubMed] [Google Scholar]
- 15.Pippucci T, Magi A, Gialluisi A, Romeo G. Detection of runs of homozygosity from whole exome sequencing data: state of the art and perspectives for clinical, population and epidemiological studies. Hum Hered. 2014;77:63–72. doi: 10.1159/000362412. [DOI] [PubMed] [Google Scholar]
- 16.Ostrer H, Skorecki K. The population genetics of the Jewish people. Hum Genet. 2013;132:119–127. doi: 10.1007/s00439-012-1235-6. [DOI] [PMC free article] [PubMed] [Google Scholar]
- 17.Atzmon G, Hao L, Pe’er I, Velez C, Pearlman A, Palamara PF, Morrow B, Friedman E, Oddoux C, Burns E, et al. Abraham’s children in the genome era: Major Jewish diaspora populations comprise distinct genetic clusters with shared Middle Eastern ancestry. Am J Hum Genet. 2010;86:850–859. doi: 10.1016/j.ajhg.2010.04.015. [DOI] [PMC free article] [PubMed] [Google Scholar]
- 18.Campbell CL, Palamara PF, Dubrovsky M, Botigué LR, Fellous M, Atzmon G, Oddoux C, Pearlman A, Hao L, Henn BM, et al. North African Jewish and non-Jewish populations form distinctive, orthogonal clusters. Proc Natl Acad Sci USA. 2012;109:13865–13870. doi: 10.1073/pnas.1204840109. [DOI] [PMC free article] [PubMed] [Google Scholar]
- 19.Behar DM, Metspalu M, Baran Y, Kopelman NM, Yunusbayev B, Gladstein A, Tzur S, Sahakyan H, Bahmanimehr A, Yepiskoposyan L, et al. No evidence from genome-wide data of a Khazar origin for the Ashkenazi Jews. Hum Biol. 2013;85:859–900. doi: 10.3378/027.085.0604. [DOI] [PubMed] [Google Scholar]
- 20.Waldman YY, Biddanda A, Davidson NR, Billing-Ross P, Dubrovsky M, Campbell CL, Oddoux C, Friedman E, Atzmon G, Halperin E, et al. The genetics of Bene Israel from India reveals both substantial Jewish and Indian ancestry. PLoS One. 2016;11:e0152056. doi: 10.1371/journal.pone.0152056. [DOI] [PMC free article] [PubMed] [Google Scholar]
- 21.Waldman YY, Biddanda A, Dubrovsky M, Campbell CL, Oddoux C, Friedman E, Atzmon G, Halperin E, Ostrer H, Keinan A. The genetic history of Cochin Jews from India. Hum Genet. 2016;135:1127–1143. doi: 10.1007/s00439-016-1698-y. [DOI] [PMC free article] [PubMed] [Google Scholar]
- 22.Bray SM, Mulle JG, Dodd AF, Pulver AE, Wooding S, Warren ST. Signatures of founder effects, admixture, and selection in the Ashkenazi Jewish population. Proc Natl Acad Sci USA. 2010;107:16222–16227. doi: 10.1073/pnas.1004381107. [DOI] [PMC free article] [PubMed] [Google Scholar]
- 23.Henn BM, Hon L, Macpherson JM, Eriksson N, Saxonov S, Pe’er I, Mountain JL. Cryptic distant relatives are common in both isolated and cosmopolitan genetic samples. PLoS One. 2012;7:e34267. doi: 10.1371/journal.pone.0034267. [DOI] [PMC free article] [PubMed] [Google Scholar]
- 24.Carmi S, Hui KY, Kochav E, Liu X, Xue J, Grady F, Guha S, Upadhyay K, Ben-Avraham D, Mukherjee S, et al. Sequencing an Ashkenazi reference panel supports population-targeted personal genomics and illuminates Jewish and European origins. Nat Commun. 2014;5:4835. doi: 10.1038/ncomms5835. [DOI] [PMC free article] [PubMed] [Google Scholar]
- 25.Goldschmidt E, Ronen A, Ronen I. Changing marriage systems in the Jewish communities of Israel. Ann Hum Genet. 1960;24:191–204. doi: 10.1111/j.1469-1809.1960.tb01732.x. [DOI] [PubMed] [Google Scholar]
- 26.Ronen A, Ronen I, Goldschmidt E. Marriage systems. In: Goldschmidt E, editor. The Genetics of Migrant and Isolate Populations. Williams & Wilkins; 1963. pp. 340–343. [Google Scholar]
- 27.Verdu P, Pemberton TJ, Laurent R, Kemp BM, Gonzalez-Oliver A, Gorodezky C, Hughes CE, Shattuck MR, Petzelt B, Mitchell J, et al. Patterns of admixture and population structure in native populations of northwest North America. PLoS Genet. 2014;10:e1004530. doi: 10.1371/journal.pgen.1004530. [DOI] [PMC free article] [PubMed] [Google Scholar]
- 28.Wang S, Haynes C, Barany F, Ott J. Genome-wide autozygosity mapping in human populations. Genet Epidemiol. 2009;33:172–180. doi: 10.1002/gepi.20344. [DOI] [PMC free article] [PubMed] [Google Scholar]
- 29.Bonné-Tamir B. The Samaritans: a living ancient isolate. In: Eriksson AW, Forsius HR, Nevallina HR, Workman PL, Norio RK, editors. Population Structure and Genetic Disorders. Academic Press; 1980. pp. 27–41. [Google Scholar]
- 30.Campbell RB. The effect of inbreeding constraints and offspring distribution on time to the most recent common ancestor. J Theor Biol. 2015;382:74–80. doi: 10.1016/j.jtbi.2015.06.037. [DOI] [PubMed] [Google Scholar]
- 31.Olshen AB, Gold B, Lohmueller KE, Struewing JP, Satagopan J, Stefanov SA, Eskin E, Kirchhoff T, Lautenberger JA, Klein RJ, et al. Analysis of genetic variation in Ashkenazi Jews by high density SNP genotyping. BMC Genet. 2008;9:14. doi: 10.1186/1471-2156-9-14. [DOI] [PMC free article] [PubMed] [Google Scholar]
- 32.Goodman RM. Genetic Disorders among the Jewish People. Johns Hopkins University Press; 1979. [Google Scholar]
- 33.Cohen T, Vardi-Saliternik R, Friedlander Y. Consanguinity, intracommunity and intercommunity marriages in a population sample of Israeli Jews. Ann Hum Biol. 2004;31:38–48. doi: 10.1080/0301446032000159255. [DOI] [PubMed] [Google Scholar]
- 34.Tsafrir J, Halbrecht I. Consanguinity and marriage systems in the Jewish community in Israel. Ann Hum Genet. 1972;35:343–347. doi: 10.1111/j.1469-1809.1957.tb01408.x. [DOI] [PubMed] [Google Scholar]
- 35.Israel Central Bureau of Statistics: Total live-births. 2012 http://statil.org/Population/252/3714.
- 36.Israel Central Bureau of Statistics: Population. 2012 http://statil.org/Population/263/3700.
- 37.Speed D, Balding DJ. Relatedness in the post-genomic era: is it still useful? Nat Rev Genet. 2015;16:33–44. doi: 10.1038/nrg3821. [DOI] [PubMed] [Google Scholar]
- 38.Cussens J, Sheehan NA. Special issue on new developments in relatedness and relationship estimation. Theor Popul Biol. 2016;107:1–3. doi: 10.1016/j.tpb.2015.12.003. [DOI] [PubMed] [Google Scholar]
Associated Data
This section collects any data citations, data availability statements, or supplementary materials included in this article.