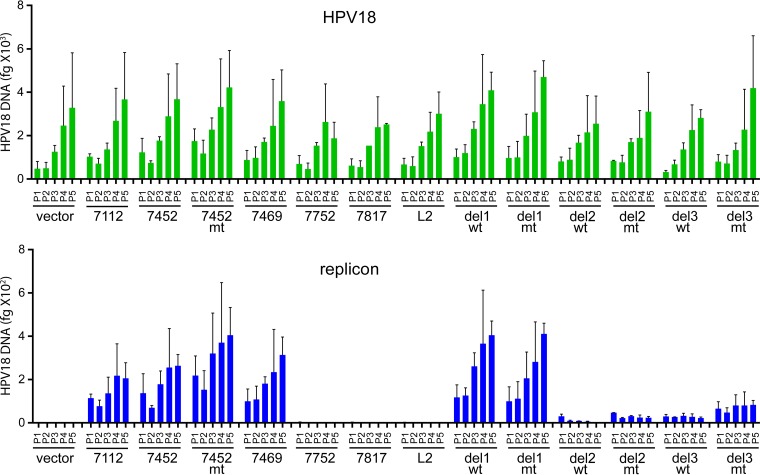
FIG 7 .
Quantitation of long-term maintenance of the pCpG URR replicons in keratinocytes. The cellular DNA samples shown in Fig. 6 were digested with EcoRI and DpnI and analyzed using qPCR with primers specific for the for HPV18 genome, the pCpGneo URR replicons, and β-actin. The bar graph at the top shows the amounts of HPV18 DNA measured by qPCR in 15 ng of cellular DNA at each of five passes posttransfection, and the bar graph on the bottom shows the amounts of the pCpG-neoURR replicons in the same samples. Each sample was normalized to the amount of actin in each sample. The graphs show the mean values in two identical, independent transfection experiments, and the error bars represent standard deviations. Similar results were found in multiple, similar (though not identical) replicates.

