

Abstract
Haemophilia has been associated with low bone mineral density (BMD) probably due to some predisposing factors. The aim of this study was to evaluate the relationship between BMD and potential clinical predictors in adult haemophilic patients. Fortynine patients with moderate and severe haemophilia were enrolled. BMD was measured by Dual Energy X-Ray Absorptiometry (DXA) and blood tests were performed for vitamin D, calcium, phosphore, alkaline phosphatase and parathormone levels. Functional Independence Score in Haemophilia (FISH) and Haemophilia Joint Health Score (HJHS) were used to assess musculoskeletal functions. Body mass index (BMI), Hepatitis C virus (HCV)/Human immunodeficiency virus (HIV) seropositivity and smoking status were also recorded. BMD was found lower than expected for reference age in 34.8% of patients of less than 50 years old. In patients older than 50 years, 66.6% of them had osteoporosis and 33.3% of them had normal BMD. FISH score was statistically significant correlated with BMD of total hip (TH) and femur neck (FN) but not with lumbar spine (LS). In eligible patients, there was also a statistically significant correlation between BMD of TH and HJHS. Vitamine D deficiency was common and found in 77.5% of patients, although there was no significant correlation with BMD. Also no correlation was found between BMD and blood tests, HCV/HIV status, BMI and smoking. This study confirmed that patients with haemophilia have an increased prevelance of low BMD even in younger group. Our results showed that there are significant correlations between FISH score and BMD of TH and FN and also between HJHS score and BMD of TH. Thus, using scoring systems may be beneficial as a simple predictors of BMD to reflect the severity of haemophilic arthropathy.
Keywords: Haemophilia, bone mineral density, osteoporosis, FISH, HJHS
Introduction
Haemophilia is a rare, X-linked recessive inherited bleeding disorder characterized by deficiency of coagulation factor VIII (Haemophilia A) and factor IX (Haemophilia B) [1]. The life expectancy of patients with haemophilia has remarkably improved over the last few decades due to the advances in the clinical management strategies [2,3]. Recently, underestimated comorbidities like osteoporosis which is more likely to be seen in advanced ages has become more popular in patients with haemophilia [4]. Nevertheless, only few references are available in the literature about bone health in haemophilic population.
Osteoporosis is a systemic bone disease characterized by low bone mineral density (BMD) and microarchitecture deterioration of bone tissue which leads to increased bone fragility and risk of fracture. Although it is less common in men than women, there is an increasing attention on male osteoporosis as a leading cause of morbidity and mortality [5]. While age-related bone loss is the primary cause of osteoporosis in men. Secondary factors including some chronical diseases, excessive alcohol intake and smoking, exogenous or endogenous glucocorticoid excess and hypogonadism may cause low BMD in younger group [6,7].
It has been shown that patients with haemophilia have some predisposing factors that can cause low BMD including particularly the physical inactivity caused by haemophilic arthropathy, vitamin D deficiency and increased HCV/HIV seropositivity [8,9]. Several studies assessing the impact of potential risk factors for low bone mass in patients with haemophilia have found conflicting results although they were mostly in agreement on increased prevelance of reduced BMD. The aim of this study was to evaluate the prevelance of low BMD and the relationship between BMD and potential clinical predictors in adult haemophilic patients.
Material and methods
Patient characteristics
This cross-sectional study was conducted on 49 patients with moderate and severe haemophilia aged between 20-60 who were followed up in Ege University Adult Haemophilia Centre from November 2014 to July 2015. According to the factor VIII and IX levels, moderate haemophilia was defined as a factor activity level ≥1 percent of normal and ≤5 percent of normal, corresponding to ≥0.01 and ≤0.05 IU/mL. Severe haemophilia was defined as <1 percent factor activity, which correspondes to <0.01 IU/mL. Hepatitis C virus (HCV)/Human immunodeficiency virus (HIV) seropositivity, Body Mass Index (BMI), alcohol consumption and smoking status were recorded for each individual. The study was approved by Ege University Hospital Ethic Committee and all of the patients provided informed written consent.
Bone densitometry (DXA)
Dual Energy X-Ray Absorptiometry (DXA) is considered the gold standard for the diagnosis of osteoporosis worldwide and it is also recommended to assess BMD for men at risk of osteoporosis. According to the World Health Organisation (WHO) classification system, for people over the age of 50, T-score of less than -2.5 SD of the standard normal population is defined as osteoporosis, a T-score of between -1 and -2.5 SD is defined as osteopenia, and >-1 SD is defined as normal [10]. For the patients under the age of 50, a Z-score which is defined by comparing the expected BMD level in the age-matched healthy group is used. Z-score of -2 SD or below is defined as “bone density lower than expected for age”, between -2 SD and -1 SD is considered as “low normal” and a Z-score above -1 SD is “normal” [11]. In our study a DXA scan of the lumbar spine (LS), femoral neck (FN) and total hip (TH) was performed by a Hologic QDR-4500A (S/N. 45469) scanner. Although BMD values in g/cm2 were also collected, T and Z-scores were primarily preferred in this study as they better reflect the comparisons related to age. Thus, patients were categorized into the groups as normal BMD, BMD lower than expected for age/low normal BMD, osteopenic and osteoporotic.
Joint score (HJHS)
Haemophilia Joint Health Score (HJHS) was developed by the Physiotherapy Working Group of the International Prophylaxis Study Group (IPSG) to evaluate the early signs of arthropathy in six main joints of the elbows, knees and ankles [12]. Although it is widely used in pediatric population, recently it is also recommended to use for adults [13,14]. In this study, our physiotherapists performed HJHS version 2.1 assessment to all patients and evaluated swelling, duration of swelling, muscular atrophy, axial alignment, crepitus on motion, loss of range of motion in extension and flexion, joint pain, strength, gait at joint level and global gait parameters and calculated total joint score. The total HJHS score ranges from 0 to 124 which represent the perfect and the worst joint health, respectively.
Functional ability questionnaire (FISH)
The Functional Independence Score in Haemophilia (FISH) is an objective, performance-based assessment tool to evaluate the functional ability of patients with haemophilia [15]. In our study, FISH was used to assess musculoskeletal functions for each patient. Self-care (eating, grooming, bathing, and dressing), transfers (chair and squatting), and mobility (walking, going up stairs, and running) were assessed and each function was assigned a score of 1 to 4. The total FISH scores ranged from 7 (the worst) to 28 (the best) were recorded.
Blood tests
Blood tests was performed for all patients to detect the vitamin D, calcium (Ca), phosphore (P), alkaline phosphatase (ALP) and parathormone (PTH) levels. Vitamin D deficiency is defined as a 25-hydroxyvitamin D concentration (25(OH)D) of less than 50 nmol/L (20 ng/ml) and Vitamin D insufficiency is defined as a 25(OH)D concentration of 50 to 75 nmol/L (20 to 30 ng/mL) [16]. Reference ranges for blood tests in our biochemical laboratory were as following; Ca: 8.6-10.2 mg/dL, P: 2.3-4.5 mg/dL, ALP: 40-129 U/L, and PTH: 11-67 pg/mL.
Statistical analysis
The Statistical Package for the Social Sciences (SPSS version 15.0, SPSS Inc., Chicago, Illinois, United States) software was used for all statistical analysis and P<0.05 was considered signicant. Descriptive statistics results are presented as means with ± SDs or 95% Confidence Intervals (CI) to describe the numeric variables. In this study Pearson correlation analysis was basicly used to measure the strength and direction of the linear relationship between BMD and other variables. Additionally, T test was used to compare the means of related parameters for the moderate and severe haemophilia groups, One way ANOVA was used to determine the statictical significant difference between associated variables and BMD subgroups (normal BMD, osteopenia or low than expected for age, osteoporosis or low normal). However in both analyses there were no statistically significant difference between the mentioned groups. Therefore, these outcomes were not expressed in “results” section.
Results
The study population includes 49 individuals: 39 Haemophilia A (35 severe, 4 moderate) and 10 Haemophilia B (8 severe, 2 moderate) all of whom had been recieving regularly prophylactic factor replacement therapy since 2001. Because prophylactic factor treatments was not available before 2001 in Turkey. According to age distribution vast majority of the study group were younger than 50 years (n: 43, 88%) and only 6 patients were over the age of 50. The average age was 36.0 ± 11.35 years (mean ± standard deviation).
There was no significant alcohol consumption (>2 drink per day) in any patient but 26 of patients (53%) were smoking and 14 of them (28.6%) were heavy smoker with a history of more than 10 pack-years smoking. No significant association was found between BMD and smoking habit in any degree. According to serologic assessment, HCV seropositivity (n=8, 16.3%) was the most common among our patients and there was no patient infected with HIV. HBV seropositivity was found in one patient (2%). Statistical correlation could not found between BMD and viral serologic status. Mean BMI was 26.4 in our study group and only a weak positive correlation was determined between BMI and Z-score in TH (r=0.292, p=0.042).
According to Z score assessment for less than 50 years old patients; 15/43 (34.8%) had Z score ≤-2 indicated a BMD “lower than expected for age”, 16/43 (37.2%) had Z score between -1 and -2 which was evaluated as “low normal” and 12/43 (27.9%) had “normal” BMD with a Z-score of >-1 (Figure 1). Mean Z score values of this group were found -1.23 in LS, -0.90 in TH and -0.81 in FN. Minimum Z-score was -4.2 in TH and FN in one patient at the age of 47. Based on T-score criteria, 4 patients (66.6%) of more than 50 years old had osteoporosis and the rest (33.3%) had normal BMD. Mean T-scores were found -1.18 in LS, -1.42 in TH and -1.87 in FN. Minimum T-score was -3.3 in LS in one patient at the age of 58 (Table 1).
Figure 1.
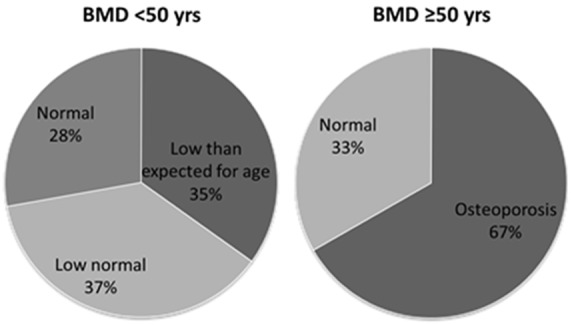
BMD status of the patients based on Z-score for <50 years and T-score for ≥50 years.
Table 1.
DXA scan results for LS, TH and FN in patients <50 years and ≥50 years
| Mean ± SD (range) | 95% CI for mean | Minimum-Maximum | |
|---|---|---|---|
|
|
|||
| Lower/Upper bound | |||
| Z-score (<50 yrs) | |||
| Lumbar spine | -1.24 ± 1.06 | -1.56/-0.90 | -3.60/1.20 |
| Total hip | -0.90 ± 1.21 | -1.28/-0.53 | -4.20/1.50 |
| Femoral neck | -0.81 ± 1.29 | -1.21/-0.42 | -4.20/2.20 |
| T-score (>50 yrs) | |||
| Lumbar spine | -1.18 ± 1.87 | -3.15/0.78 | -3.30/1.10 |
| Total hip | -1.42 ± 1.39 | -2.87/0.04 | -2.90/0.30 |
| Femoral neck | -1.87 ± 1.11 | -3.04/-0.70 | -2.70/-0.20 |
Vitamin D deficiency (<50 nmol/L) was very common and detected in 38 patients (77.5%), although vitamin D insufficiency (50-75 nmol/L) was found only in 9 patients (18.4%). Mean serum 25(OH)D concentration was 32 nmol/L in Vitamin D deficient group while it was 39 nmol/L in whole study group. Only 2 patients (4%) had a normal (>75 nmol/L) Vitamin D concentration. In our study, no significant correlation was found between BMD and Vitamin D levels. Serum Ca levels were found in normal range with a mean of 9.7 mg/dl in whole group except two patients with slightly higher Ca levels (10.3 and 10.5 mg/dl). Mean serum P level was 3.1 mg/dl and only in three patients P was found slightly lower than reference (2.2, 2.1 and 2.1) and only in one patient ALP was higher than reference range (144 U/L). Parathyroid hormone level was found higher than normal in 11 patients, moreover two of those patients had to be excluded because of excessively high levels (750 and 235.1 pg/ml) with hypercalcemia which mentioned above. There were also no correlation revealed between BMD and blood tests of Ca, P, ALP and PTH (Tables 2, 3).
Table 2.
Characteristics of the patient group
| Mean ± SD (range) | 95% CI for mean | Minimum-maximum | |
|---|---|---|---|
|
|
|||
| Lower-Upper bound | |||
| Joint score (HJHS) | 25.6 ± 17 | 19.5-32.3 | 3-56 |
| FISH score | 24.2 ± 4.9 | 22.8-25.7 | 15-32 |
| (25 (OH) vitD3) (nmol/L) | 39.1 ± 18.3 | 33.9-44.4 | 6-91 |
| Alk.Phosphatase (ALP) (U/L) | 80.6 ± 20.2 | 74.8-86.4 | 52-144 |
| Calcium (Ca+2) (mg/dL) | 9.7 ± 0.4 | 9.6-9.8 | 8.7-10.5 |
| Phosphorus (P-1) (mg/dL) | 3.1 ± 0.6 | 2.9-3.3 | 2.1-4.4 |
| Parathormone (PTH) (pg/mL) | 47.7 ± 24.4 | 40.6-54.9 | 9.3-119 |
| Body mass index (BMI) | 26.4 ± 4.5 | 25.1-27.7 | 18-43 |
Table 3.
Correlations between BMD and potential related parameters by Pearson correlation analysis
| HJHS | FISH | Vitamin D | ALP | Ca+2 | P-1 | PTH | BMI | |
|---|---|---|---|---|---|---|---|---|
| T-score (LS) | ||||||||
| Pearson C | -0.077 | 0.042 | 0.147 | 0.028 | -0.135 | -0.200 | 0.087 | 0.111 |
| Sig. 2-tailed | 0.704 | 0.774 | 0.313 | 0.846 | 0.357 | 0.168 | 0.560 | 0.449 |
| T-score (TH) | ||||||||
| Pearson C | -0.456 | 0.385 | -0.048 | -0.240 | -0.266 | 0.007 | 0.049 | 0.267 |
| Sig. 2-tailed | 0.017 | 0.006 | 0.745 | 0.097 | 0.065 | 0.961 | 0.742 | 0.064 |
| T-score (FN) | ||||||||
| Pearson C | -0.339 | 0.443 | -0.069 | -0.187 | -0.175 | 0.146 | -0.076 | 0.207 |
| Sig. 2-tailed | 0.084 | 0.001 | 0.635 | 0.198 | 0.230 | 0.317 | 0.610 | 0.153 |
| Z-score (LS) | ||||||||
| Pearson C | -0.024 | -0.042 | 0.144 | 0.061 | -0.151 | -0.198 | 0.093 | 0.138 |
| Sig. 2-tailed | 0.906 | 0.774 | 0.325 | 0.677 | 0.300 | 0.172 | 0.536 | 0.344 |
| Z-score (TH) | ||||||||
| Pearson C | -0.401 | 0.321 | -0.050 | -0.212 | -0.285 | -0.001 | 0.064 | 0.292 |
| Sig. 2-tailed | 0.038 | 0.025 | 0.733 | 0.144 | 0.047 | 0.995 | 0.671 | 0.042 |
| Z-score (FN) | ||||||||
| Pearson C | -0.209 | 0.330 | -0.080 | -0.140 | -0.233 | 0.130 | -0.030 | 0.262 |
| Sig. 2-tailed | 0.295 | 0.021 | 0.582 | 0.336 | 0.108 | 0.373 | 0.843 | 0.069 |
Mean of FISH score was 24 and it was statistically significant correlated with both Z scores of TH and FN (r=0.385, p=0.006 and r=0.443, p=0.001, respectively) and T scores of TH and FN (r=0.321, p=0.025 and r=0.330, p=0.021, respectively) but not with BMD of LS. HJHS joint scores could be assessed in 27 of 49 patients. In 22 patients, an optimal assessment could not be performed because of the existence of prosthetic materials, acute hemarthrosis or lack of compliance of the patient. In eligible patients (55%), mean HJHS score was 25.6 and it was statistically significant correlated with T and Z scores of TH (r=-0.456, p=0.017 and r=-0.401 p=0.038, respectively), but not with BMD of LS and FN (Tables 2, 3). It is well known that higher scores represent better joint function in FISH and worse joint function in HJHS. But in our study the direction of correlations was opposite for FISH and HJHS due to having chronic hemarthrosis.
Discussion
This study confirmed that patients with haemophilia have an increased prevelance of low BMD even in young patient group of less than 50 years of age. Based on WHO criteria, according to Z score assessment 71% of patients of less than 50 years had low BMD. Our results showed that there is a significant correlation between FISH score and BMD in TH and FN. Also we found a correlation between Joint score (HJHS) and BMD in TH. Additionally there was no statistically significant correlation was found between BMD and other potentially related parameters as viral serologic status, BMI, smoking habit, and the serum levels of 25(OH)D, Ca, P, ALP and PTH.
According to a recent comprehensive report which was prepared in collaboration with the International Osteoporosis Foundation (IOF) and the European Federation of Pharmaceutical Industry Associations (EFPIA); the overall prevalence of osteoporosis in men over 50 years old in the European Union was 6.6% with an increasing prevelance reaching to 16.6% in men over 80 years old [6]. Available studies showed that prevelance of low BMD in patients with haemophilia is significantly higher than general population. Therefore the results of patients were assesed in comparison to the recognized standart BMD levels for healthy male population in this study. Our study group was substantially consisted of young patients who were under the age of 50 (88%). The incidence of osteoporosis in age-matched healthy population is very rare, therefore a control group was not preferred to be used with the fact that Z-score was already reflecting the comparison based on age.
The first study assessing bone density in patients with haemophilia was published by Gallacher et al. in 1994, indicated that hemophiliacs had lower BMD (mean of 0.19 g/cm2 in LS and 0.13 g/cm2 in FN) compared to healthy population. Liver dysfunction and immobilization were defined to be the primary relevant factors lead to low BMD [8]. From 1994 to 2007 there was not a sufficient number of published data about bone health in patients with haemophilia until Wallny et al. shed light on osteoporosis in haemophilia as an underestimated comorbidity. Osteopenia and osteoporosis rates in their case group were 25.8% and 43.5%, respectively, confirmed the high prevalance of low BMD in haemophiliacs. It was suggested that concomitant HCV infection may lead to reduced bone mass besides haemophilic arthropathy as a main cause [4]. Although our low BMD rates were similar to these studies, an assosiciation between BMD and HCV seropositivity could not be detected in our study. Nevertheless, our study also supports that joint disability due to haemophilic arthropaty seems to be the most important predisposing factor for low BMD.
In a case-control study about osteoporosis in young haemophilic patients from western India, a statistically significant correlation was found between joint evaluation scores and BMD of TH, but not with LS. According to this study there was no correlation between HCV status and BMD of any site [17]. These outcomes were very compatible with ours as we also found the significant correlation of joint scores with BMD in TH and FN, but not in LS. Moreover, it justified our result which showed no correlation between BMD and HCV status. With a very similar study design, Gerstner G et al. suggested that lower 25(OH)D levels, lower BMI, lower activity and joint scores, HIV and HCV seropositivity were all associated with increased bone loss [18]. In our study, FISH and HJHS score which were similar to physical activity questionnaire and joint range of motion score in Gerstner’s study were used and we found the same association between BMD and joint scores. But we could not find any assosiciation between BMD with 25(OH)D and BMI. Both of these studies concluded that BMD was significantly correlated with scoring systems which were reflecting directly or indirectly joint ability status. Another subsequent cross-sectional study assessing the relationship between osteoporosis and haemophilic arthropathy in patients with severe hemophilia revealed that factor replacement status, the number of arthropathic joints and joint bleeding episodes in the past year were significant independent predictors of both spinal and femoral BMD [19].
First meta-analysis of seven case-control studies evaluating BMD in haemophiliacs also confirmed the association between severe haemophilia and low BMD. However, lower BMD was not significantly correlated with lower BMI or HCV seropositivity [9]. A review by Ghosh K et al. was concluded that the causes of osteoporosis were diverse and might vary in different countries and different patient groups. Beside this fact, they also suggested that lack of physical exercise, recurrent hemarthrosis attacks, vitamin D deficiency and low BMI were associated with low BMD [20]. In another important study, low BMD was diagnosed in 26,9% of the patients with haemophilia and 20% of the controls (p=0.0001). It was also suggested that the levels of physical activity and 25(OH)D were independent predictors of low BMD [21]. In 2014, a systematic review and meta-analysis which included ten studies, suggested that patients with haemophilia present a significant reduction in BMD of both LS and TH. But there was no evidence that age, BMI, physical activity degree or serologic status affected BMD of LS [22].
In last two years, couple of studies were added to the literature in this area. In one of these studies, it was found that only cigarette smoking was significantly related to low BMD among other variables including physical activity, calcium intake and demographic properties [23]. Another case-control study from UK showed that patients who have more severely affected joints, lower activity levels, HIV or HCV seropositivity and lower BMI had lower BMD [24]. Lastly two comprehensive reviews were published in 2015 and both emphasized that low BMD is prevalent among patients with haemophilia. Physical inactivity and vitamin D deficiency were played a significant role in bone loss [25,26].
As we researched, our study has an important role to be the first assesment of BMD and related parameters in adult Turkish haemophilic patients. It confirms that low BMD is very common in patients with haemophilia and rate of prevelance is very similar to mentioned studies from other geographic regions. Additionally it also supports that vitamin D deficiency/insufficiency is common in patients. According to our outcomes, decreased joint mobility is the major determinant of BMD and none of other potential variables seem to have a strong correlation. One of the prominent outcome from this study is using FISH questionnaire to distinguish the high risk patients with haemophilic arthropathy and related low BMD is effective and practical.
HJHS was also found useful to represent low BMD in TH. Few studies have assessed the importance of FISH as a prognostic tool in patients with haemophilia [15,27-30]. Furthermore, those studies which primarily assessed the effectiveness of FISH for diagnosing and monitoring haemophilic arthropathy did not directly evaluate its relation to BMD status. They were all performed in children patient group and mainly included the comparisons with other joint scoring systems and radiological methods. There are also some studies which have analyzed relationship between HJHS and BMD in patients with haemophilia [31]. Based on our results, we suggest that FISH score and HJHS might be used as the simple predictors of BMD by reflecting the severity of haemophilic arthropathy in adult patients.
In conclusion, awareness of low BMD as an important comorbidity is very crucial to perform an early and adequate management in patients with haemophilia. Objective assessment tools seem effective for haemophilia care providers to distinguish patients with high risk for low BMD.
Acknowledgements
We acknowledge that this study was supported by Ege University Medical Faculty Research Project Subcommittee (Grant number: 2014/TIP/032).
Disclosure of conflict of interest
None.
References
- 1.Hoyer LW. Hemophilia A. N Engl J Med. 1994;330:38–47. doi: 10.1056/NEJM199401063300108. [DOI] [PubMed] [Google Scholar]
- 2.Darby SC, Kan SW, Spooner RJ, Giangrande PL, Hill FG, Hay CR, Lee CA, Ludlam CA, Williams M. Mortality rates, life expectancy, and causes of death in people with hemophilia A or B in the United Kingdom who were not infected with HIV. Blood. 2007;110:815–825. doi: 10.1182/blood-2006-10-050435. [DOI] [PubMed] [Google Scholar]
- 3.Canaro M, Goranova-Marinova V, Berntorp E. The ageing patient with haemophilia. Eur J Haematol. 2015;94(Suppl 77):17–22. doi: 10.1111/ejh.12497. [DOI] [PubMed] [Google Scholar]
- 4.Wallny TA, Scholz DT, Oldenburg J, Nicolay C, Ezziddin S, Pennekamp PH, Stoffel-Wagner B, Kraft CN. Osteoporosis in haemophiliaan underestimated comorbidity? Haemophilia. 2007;13:79–84. doi: 10.1111/j.1365-2516.2006.01405.x. [DOI] [PubMed] [Google Scholar]
- 5.Adler RA. Osteoporosis in men: what has changed? Curr Osteoporos Rep. 2011;9:31–35. doi: 10.1007/s11914-010-0039-7. [DOI] [PubMed] [Google Scholar]
- 6.Willson T, Nelson SD, Newbold J, Nelson RE, LaFleur J. The clinical epidemiology of male osteoporosis: a review of the recent literature. Clin Epidemiol. 2015;7:65–76. doi: 10.2147/CLEP.S40966. [DOI] [PMC free article] [PubMed] [Google Scholar]
- 7.Drake MT, Murad MH, Mauck KF, Lane MA, Undavalli C, Elraiyah T, Stuart LM, Prasad C, Shahrour A, Mullan RJ, Hazem A, Erwin PJ, Montori VM. Clinical review. Risk factors for low bone mass-related fractures in men: a systematic review and meta-analysis. J Clin Endocrinol Metab. 2012;97:1861–1870. doi: 10.1210/jc.2011-3058. [DOI] [PubMed] [Google Scholar]
- 8.Gallacher SJ, Deighan C, Wallace AM, Cowan RA, Fraser WD, Fenner JA, Lowe GD, Boyle IT. Association of severe haemophilia A with osteoporosis: a densitometric and biochemical study. Q J Med. 1994;87:181–186. [PubMed] [Google Scholar]
- 9.Iorio A, Fabbriciani G, Marcucci M, Brozzetti M, Filipponi P. Bone mineral density in haemophilia patients. A meta-analysis. Thromb Haemost. 2010;103:596–603. doi: 10.1160/TH09-09-0629. [DOI] [PubMed] [Google Scholar]
- 10.Watts NB, Adler RA, Bilezikian JP, Drake MT, Eastell R, Orwoll ES, Finkelstein JS, Endocrine S. Osteoporosis in men: an endocrine society clinical practice guideline. J Clin Endocrinol Metab. 2012;97:1802–1822. doi: 10.1210/jc.2011-3045. [DOI] [PubMed] [Google Scholar]
- 11.Lewiecki EM, Gordon CM, Baim S, Leonard MB, Bishop NJ, Bianchi ML, Kalkwarf HJ, Langman CB, Plotkin H, Rauch F, Zemel BS, Binkley N, Bilezikian JP, Kendler DL, Hans DB, Silverman S. International society for clinical densitometry 2007 adult and pediatric official positions. Bone. 2008;43:1115–1121. doi: 10.1016/j.bone.2008.08.106. [DOI] [PubMed] [Google Scholar]
- 12.Hilliard P, Funk S, Zourikian N, Bergstrom BM, Bradley CS, McLimont M, Manco-Johnson M, Petrini P, van den Berg M, Feldman BM. Hemophilia joint health score reliability study. Haemophilia. 2006;12:518–525. doi: 10.1111/j.1365-2516.2006.01312.x. [DOI] [PubMed] [Google Scholar]
- 13.Fischer K, de Kleijn P. Using the haemophilia joint health score for assessment of teenagers and young adults: exploring reliability and validity. Haemophilia. 2013;19:944–950. doi: 10.1111/hae.12197. [DOI] [PubMed] [Google Scholar]
- 14.de Moerloose P, Fischer K, Lambert T, Windyga J, Batorova A, Lavigne-Lissalde G, Rocino A, Astermark J, Hermans C. Recommendations for assessment, monitoring and follow-up of patients with haemophilia. Haemophilia. 2012;18:319–325. doi: 10.1111/j.1365-2516.2011.02671.x. [DOI] [PubMed] [Google Scholar]
- 15.Poonnoose PM, Manigandan C, Thomas R, Shyamkumar NK, Kavitha ML, Bhattacharji S, Srivastava A. Functional independence score in haemophilia: a new performancebased instrument to measure disability. Haemophilia. 2005;11:598–602. doi: 10.1111/j.1365-2516.2005.01142.x. [DOI] [PubMed] [Google Scholar]
- 16.Dawson-Hughes B, Mithal A, Bonjour JP, Boonen S, Burckhardt P, Fuleihan GE, Josse RG, Lips P, Morales-Torres J, Yoshimura N. IOF position statement: vitamin D recommendations for older adults. Osteoporos Int. 2010;21:1151–1154. doi: 10.1007/s00198-010-1285-3. [DOI] [PubMed] [Google Scholar]
- 17.Nair AP, Jijina F, Ghosh K, Madkaikar M, Shrikhande M, Nema M. Osteoporosis in young haemophiliacs from western India. Am J Hematol. 2007;82:453–457. doi: 10.1002/ajh.20877. [DOI] [PubMed] [Google Scholar]
- 18.Gerstner G, Damiano ML, Tom A, Worman C, Schultz W, Recht M, Stopeck AT. Prevalence and risk factors associated with decreased bone mineral density in patients with haemophilia. Haemophilia. 2009;15:559–565. doi: 10.1111/j.1365-2516.2008.01963.x. [DOI] [PubMed] [Google Scholar]
- 19.Naderi A, Nikvarz M, Arasteh M, Shokoohi M. Osteoporosis/osteopenia and hemophilic arthropathy in severe hemophilic patients. Arch Iran Med. 2012;15:82–84. [PubMed] [Google Scholar]
- 20.Ghosh K, Shetty S. Bone health in persons with haemophilia: a review. Eur J Haematol. 2012;89:95–102. doi: 10.1111/j.1600-0609.2012.01803.x. [DOI] [PubMed] [Google Scholar]
- 21.Anagnostis P, Vakalopoulou S, Slavakis A, Charizopoulou M, Kazantzidou E, Chrysopoulou T, Vyzantiadis TA, Moka E, Agapidou A, Garipidou V. Reduced bone mineral density in patients with haemophilia A and B in Northern Greece. Thromb Haemost. 2012;107:545–551. doi: 10.1160/TH11-08-05563. [DOI] [PubMed] [Google Scholar]
- 22.Paschou SA, Anagnostis P, Karras S, Annweiler C, Vakalopoulou S, Garipidou V, Goulis DG. Bone mineral density in men and children with haemophilia A and B: a systematic review and meta-analysis. Osteoporos Int. 2014;25:2399–2407. doi: 10.1007/s00198-014-2773-7. [DOI] [PubMed] [Google Scholar]
- 23.Roushan N, Meysamie A, Managhchi M, Esmaili J, Dormohammadi T. Bone mineral density in hemophilia patients. Indian J Hematol Blood Transfus. 2014;30:351–355. doi: 10.1007/s12288-013-0318-4. [DOI] [PMC free article] [PubMed] [Google Scholar]
- 24.Wells AJ, McLaughlin P, Simmonds JV, Prouse PJ, Prelevic G, Gill S, Chowdary P. A casecontrol study assessing bone mineral density in severe haemophilia A in the UK. Haemophilia. 2015;21:109–115. doi: 10.1111/hae.12565. [DOI] [PubMed] [Google Scholar]
- 25.Kempton CL, Antoniucci DM, Rodriguez-Merchan EC. Bone health in persons with haemophilia. Haemophilia. 2015;21:568–577. doi: 10.1111/hae.12736. [DOI] [PubMed] [Google Scholar]
- 26.Anagnostis P, Karras S, Paschou SA, Goulis DG. Haemophilia A and B as a cause for secondary osteoporosis and increased fracture risk. Blood Coagul Fibrinolysis. 2015;26:599–603. doi: 10.1097/MBC.0000000000000330. [DOI] [PubMed] [Google Scholar]
- 27.Tlacuilo-Parra A, Villela-Rodriguez J, Garibaldi-Covarrubias R, Soto-Padilla J, Orozco-Alcala J. Functional independence score in hemophilia: a cross-sectional study assessment of Mexican children. Pediatr Blood Cancer. 2010;54:394–397. doi: 10.1002/pbc.22291. [DOI] [PubMed] [Google Scholar]
- 28.Hassan TH, Badr MA, El-Gerby KM. Correlation between musculoskeletal function and radiological joint scores in haemophilia A adolescents. Haemophilia. 2011;17:920–925. doi: 10.1111/j.1365-2516.2011.02496.x. [DOI] [PubMed] [Google Scholar]
- 29.Oymak Y, Yildirim AT, Yaman Y, Gurcinar M, Firat A, Cubuckcu D, Carti O, Ozek G, Vergin RC. The effectiveness of tools for monitoring hemophilic arthropathy. J Pediatr Hematol Oncol. 2015;37:e80–85. doi: 10.1097/MPH.0000000000000210. [DOI] [PubMed] [Google Scholar]
- 30.Tasbihi M, Pishdad P, Haghpanah S, Ardeshiri R, Tavoosi H, Karimi M. A comparison between MRI, sonography and functional independence score in Haemophilia methods in diagnosis, evaluation and classification of arthropathy in severe haemophilia A and B. Blood Coagul Fibrinolysis. 2016;27:131–135. doi: 10.1097/MBC.0000000000000376. [DOI] [PubMed] [Google Scholar]
- 31.Christoforidis A, Economou M, Papadopoulou E, Kazantzidou E, Farmaki E, Tzimouli V, Tsatra I, Gompakis N, Athanassiou-Metaxa M. Comparative study of dual energy X-ray absorptiometry and quantitative ultrasonography with the use of biochemical markers of bone turnover in boys with haemophilia. Haemophilia. 2011;17:e217–222. doi: 10.1111/j.1365-2516.2010.02385.x. [DOI] [PubMed] [Google Scholar]