

Abstract
Aims
We conducted population pharmacokinetic (PopPK) and exposure–response analyses for trastuzumab emtansine (T‐DM1), to assess the need for T‐DM1 dose optimization in patients with low exposure by using TH3RESA [A Study of Trastuzumab Emtansine in Comparison With Treatment of Physician's Choice in Patients With human epidermal growth factor receptor 2 (HER2)‐positive Breast Cancer Who Have Received at Least Two Prior Regimens of HER2‐directed Therapy] study data (NCT01419197). The randomized phase III TH3RESA study investigated T‐DM1 vs. treatment of physician's choice (TPC) in patients with heavily pretreated HER2‐positive advanced breast cancer.
Methods
We compared a historical T‐DM1 PopPK model with T‐DM1 pharmacokinetics in TH3RESA and performed exposure–response analyses using model‐predicted cycle 1 maximum concentration (Cmax), cycle 1 minimum concentration (Cmin) and area under the concentration–time curve at steady state (AUCss). Kaplan–Meier analyses [overall survival (OS), progression‐free survival (PFS)] and logistic regression [overall response rate (ORR), safety] were stratified by T‐DM1 exposure metrics. Survival hazard ratios (HRs) in the lowest exposure quartile (Q1) of cycle 1 Cmin were compared with matched TPC‐treated patients.
Results
T‐DM1 concentrations in TH3RESA were described well by the historical PopPK model. Patients with higher cycle 1 Cmin and AUCss exhibited numerically longer median OS and PFS and higher ORR than patients with lower exposure. Exposure–response relationships were less evident for cycle 1 Cmax. No relationship between exposure and safety was identified. HRs for the comparison of T‐DM1‐treated patients in the Q1 subgroup with matched TPC‐treated patients were 0.96 [95% confidence interval (CI) 0.63, 1.47] for OS and 0.92 (95% CI 0.64, 1.32) for PFS.
Conclusions
Exposure–response relationships for efficacy were inconsistent across exposure metrics. HRs for survival in patients in the lowest T‐DM1 exposure quartile vs. matched TPC‐treated patients suggest that, compared with TCP, the approved T‐DM1 dose is unlikely to be detrimental to patients with low exposure.
Keywords: exposure–response (E‐R), metastatic breast cancer, population pharmacokinetics (PopPK), trastuzumab emtansine (T‐DM1)
What is Already Known about this Subject
During review of the application for trastuzumab emtansine (T‐DM1), the sponsor and US Food and Drug Administration conducted exposure–response analyses of EMILIA study data. No clinically meaningful relationships for safety were identified. Following covariate adjustment, higher model‐predicted cycle 1 minimum concentration (Cmin) was associated with improved overall survival (OS), progression‐free survival (PFS) and objective response rate.
In the phase III TH3RESA [A Study of Trastuzumab Emtansine in Comparison With Treatment of Physician's Choice in Patients With human epidermal growth factor receptor 2 (HER2)‐positive Breast Cancer Who Have Received at Least Two Prior Regimens of HER2‐directed Therapy] study (NCT01419197), OS and PFS were significantly improved with T‐DM1 vs. treatment of physician's choice (TPC) in patients with HER2‐positive locally advanced or metastatic breast cancer previously treated with ≥2 HER2‐directed regimens.
A historical population pharmacokinetic model informed by data from patients with HER2‐positive metastatic breast cancer demonstrated that T‐DM1 pharmacokinetics are consistent and predictable.
What this Study Adds
The pharmacokinetics of T‐DM1 in the TH3RESA study population was well described by the historical population pharmacokinetic model.
OS and PFS were numerically longer in patients with higher vs. lower T‐DM1 cycle 1 Cmin and AUCss. Exposure–response relationships were less evident for cycle 1 maximum concentration (Cmax) and more shallow after covariate adjustment. No exposure–response relationship was observed for grade ≥3 thrombocytopenia or hepatotoxicity.
Hazard ratios for the comparison of T‐DM1‐treated patients in the lowest exposure quartile with matched TPC‐treated patients were 0.96 for OS and 0.92 for PFS, suggesting that the approved T‐DM1 dose (3.6 mg kg–1 every 3 weeks), when compared with TPC, is unlikely to be detrimental in patients with low T‐DM1 exposure.
Introduction
Trastuzumab emtansine (T‐DM1) is an antibody–drug conjugate comprising the humanized monoclonal antibody trastuzumab conjugated to DM1, a highly potent cytotoxic agent. T‐DM1 delivers DM1 specifically to human epidermal growth factor receptor 2 (HER2)‐overexpressing tumour cells 1, 2. Like trastuzumab, T‐DM1 induces antibody‐dependent cellular cytotoxicity, inhibits cell signalling through the phosphatidylinositol 3‐kinase/AKT pathway, and inhibits HER2 shedding 2, 3. T‐DM1 3.6 mg kg–1 every 3 weeks (q3w) was identified as the maximum tolerated dose in a phase I clinical trial 4. In the phase III registration study (EMILIA, NCT00829166), single‐agent T‐DM1 3.6 mg kg–1 q3w demonstrated superior efficacy relative to lapatinib plus capecitabine in patients with previously treated HER2‐positive advanced breast cancer 5. Based, in part, on results from EMILIA, T‐DM1 was approved by the United States Food and Drug Administration (FDA) in 2013 for patients with HER2‐positive metastatic breast cancer (MBC) previously treated with trastuzumab and a taxane.
Exposure–response analyses of EMILIA data were conducted by both the sponsor and the FDA 6, 7 during review of the biological licence application (BLA) for T‐DM1. While exposure–response analyses for safety did not identify any clinically meaningful relationships, a relationship for efficacy was suggested. Following covariate adjustment [Eastern Cooperative Oncology Group performance status (ECOG PS) score, HER2 shed extracellular domain (ECD), tumour burden, measurable disease, number of disease sites, previous anthracycline use, previous trastuzumab treatment and presence of visceral disease], higher T‐DM1 exposures based on model‐predicted cycle 1 minimum concentration (Cmin) were associated with improved overall survival (OS), progression‐free survival (PFS) and objective response rate (ORR).
Based on the exposure–response analyses conducted by the FDA, there might be an opportunity further to assess treatment dose in the subset of patients with low T‐DM1 exposure 6, 7. There is also a need further to characterize the exposure–response relationship using data from TH3RESA (NCT01419197), a phase III study comparing the efficacy and safety of single‐agent T‐DM1 3.6 mg kg–1 q3w with treatment of physician's choice (TPC) in patients with HER2‐positive locally advanced breast cancer or MBC previously treated with ≥2 HER2‐directed regimens, including trastuzumab and lapatinib in the advanced setting, and a taxane in any setting 8. The totality of the exposure–response analyses from both studies will then be examined to determine whether dose optimization is needed for patients with low T‐DM1 exposure. The present article highlights the results of the population pharmacokinetic (PopPK) and exposure–response analyses of TH3RESA study data. We also discuss the implication of these results on the need for T‐DM1 dose optimization.
Materials and methods
Patients and study design
The present analysis evaluated the pharmacokinetics and exposure–response relationships of T‐DM1 using TH3RESA study data. Patients randomized to T‐DM1 were intravenously infused with T‐DM1 3.6 mg kg–1 q3w. The treatment regimens administered in the TPC arm have been described 8. TH3RESA was conducted in accordance with Good Clinical Practice guidelines and the Declaration of Helsinki. All patients provided written informed consent, and the protocol was approved by the institutional review board at each participating centre.
Pharmacokinetic sampling and bioanalytic method
Sparse pharmacokinetic samples were collected during cycle 1 [end of infusion (EOI) and 2 h after EOI] and cycle 3 (predose, EOI and 2 h after EOI). Serum concentrations of T‐DM1 conjugate were measured by purified protein derivative (PPD) (Richmond, VA, USA) using a validated indirect, sandwich enzyme‐linked immunosorbent assay 9. This assay quantified all trastuzumab molecules conjugated to ≥1 covalently bound DM1 molecule with a lower limit of quantification of 0.06 μg ml–1, while excluding unconjugated trastuzumab.
Population pharmacokinetic analysis
The PopPK analysis of TH3RESA study data was conducted using nonlinear mixed‐effects modelling with a qualified installation of the nonlinear mixed‐effects modelling (NONMEM®) software, version 7.2 (ICON Development Solutions, Hanover, MD, USA). Models were run on a computer grid with multiple computer nodes. The censored‐data likelihood method (M3 method in NONMEM®) 10 was implemented.
In the historical PopPK analysis that pooled data from 671 patients with MBC, the pharmacokinetic properties of T‐DM1 were found to be consistent across different lines of therapy for MBC 11. As a consequence, for the present PopPK analysis, population parameters (i.e. THETAs and OMEGAs) were fixed at the previously estimated values. Six statistically significant covariates (P < 0.001) were identified and included in the historical PopPK model: body weight [for clearance (CL) and volume of distribution in the central compartment], serum HER2 ECD, tumour burden, serum albumin concentration, serum aspartate aminotransferase (AST) concentration and baseline trastuzumab concentration (for CL only) 11. Neither HER2 ECD nor tumour burden were examined in the current analysis; this is because HER2 ECD was not measured in TH3RESA, and tumour burden was defined using RECIST 1.1 12 in TH3RESA and RECIST 1.0 13 in the historical PopPK model 11. Covariate values for HER2 ECD (25 ng ml–1) and tumour burden (9 cm) of a typical patient 11 and actual values for the other four covariates were used to determine Empirical Bayes pharmacokinetic parameter estimates.
Two approaches were employed to evaluate the adequacy of the prior model: simulation‐based predictive checks and comparison of model‐predicted and observed concentrations. Empirical Bayes pharmacokinetic parameter estimates of individual T‐DM1 pharmacokinetic parameters were derived using the historical PopPK model 11 with individual covariate values included. Individual concentration predictions were generated accordingly. For exposure–response analysis, individual Empirical Bayes estimates were also used to derive model‐predicted maximum concentration (Cmax) at cycle 1, Cmin at cycle 1 (nominal time of 504 h postdose), and area under the concentration–time curve at steady state (AUCss).
Exposure–response analyses
Kaplan–Meier analyses for OS and PFS were performed on T‐DM1‐treated patients stratified by quartile of exposure metrics (model‐predicted Cmax at cycle 1, Cmin at cycle 1 or AUCss). The hazard ratio (HR) for each quartile of exposure metrics relative to the TPC arm was estimated using Cox proportional hazard modelling. To explore the exposure–response relationship for T‐DM1 and adjust for potentially confounding effects, baseline covariates were added via a stepwise approach to the model that included T‐DM1 exposure metrics. Covariates were included in the full model based on univariate screening at P < 0.10. Covariates were then backward eliminated at P < 0.05 from the multivariate model containing all selected covariates and T‐DM1 exposure metrics. T‐DM1 exposure metrics were included as either categorical (quartile) or continuous variables. For covariates missing in ≤15% of patients, missing values were imputed either as the population median (for continuous covariates) or as the most frequent category (for categorical covariates). Covariates missing in >15% of patients were excluded from the exposure–response analyses.
Logistic regression models were used for the binary endpoints ORR and adverse event occurrence (grade ≥3 thrombocytopenia, grade ≥3 hepatotoxicity and any grade ≥3 adverse event). In these models, the various exposure metrics were analysed as continuous variables. For ORR, exposure–response analyses were conducted using both model‐predicted Cmin at cycle 1 and AUCss. For safety endpoints, exposure–response analyses were conducted using model‐predicted Cmax at cycle 1, Cmin at cycle 1 and AUCss. Covariates were included in the model using stepwise modelling as described above.
Baseline covariates that were potential risk factors for efficacy and safety endpoints were screened in the exposure–response analyses and included age, albumin, AST, alanine aminotransferase, total bilirubin, alkaline phosphatase, total protein, platelet count, tumour burden, race (Asian vs. non‐Asian), ECOG PS (0 vs. ≥1), measurable disease (yes vs. no), visceral disease (yes vs. no), liver metastases (yes vs. no), brain metastases (yes vs. no), bone metastases (yes vs. no), tumour type (locally advanced vs. metastatic breast cancer), number of disease sites (<3 vs. ≥3), oestrogen receptor status (positive vs. negative), progesterone receptor status (positive vs. negative), prior anthracycline use (yes vs. no), number of prior treatments (≤3 vs. >3) and world region.
Case‐matching analysis
To supplement the Cox proportional hazard models for OS and PFS, case‐matching analysis was used to compare OS and PFS in the lowest exposure quartile (Q1) of model‐predicted T‐DM1 Cmin at cycle 1 with matched TPC‐treated patients 14. Patients from the TPC arm were matched based on the covariate distributions seen in patients in the T‐DM1 Q1 subgroup. Covariates selected for matching included age, AST, tumour burden, race (Asian vs. non‐Asian), ECOG PS (0 vs. ≥1), measurable disease (yes vs. no), visceral disease (yes vs. no), liver metastases (yes vs. no), brain metastases (yes vs. no), bone metastases (yes vs. no), tumour type (locally advanced vs. metastatic breast cancer), number of disease sites (<3 vs. ≥3), oestrogen receptor status (positive vs. negative), progesterone receptor status (positive vs. negative), prior anthracycline use (yes vs. no), number of prior treatments (≤3 vs. >3) and world region. Propensity scores were used for optimal matching 15, 16 and were calculated via the MatchIt R package 17; emphasis was placed on assessment of balance, as measured by standardized differences between comparator groups. The matching algorithm was a one‐to‐one, calliper‐matching algorithm based on propensity scores 18. The calliper used was 0.2 times the trimmed standard deviation of the propensity scores in the Q1 subgroup based on model‐predicted Cmin at cycle 1. Using the matched data, patients in the lowest T‐DM1 exposure quartile (Q1) were compared with TPC‐treated patients using the final Cox proportional hazard model for OS and PFS described above.
Sensitivity to the choice of matched sample and analysis model was also assessed. Using the propensity score, calliper‐matching approach, it was possible for some patients in the Q1 subgroup to not be matched. In such instances, unmatched T‐DM1‐treated patients were excluded from the primary case‐matching analysis. To assess the sensitivity of the choice of matched sample, a secondary analysis was performed that compared the full Q1 subgroup, including unmatched T‐DM1‐treated patients, with the primary matched sample of patients from the TPC arm. To preserve the correlation structure, the pairwise interactions of covariates between comparator groups were also assessed.
Nomenclature of targets and ligands
Key protein targets and ligands in this article are hyperlinked to corresponding entries in http://www.guidetopharmacology.org, the common portal for data from the IUPHAR/BPS Guide to PHARMACOLOGY 19, and are permanently archived in the Concise Guide to PHARMACOLOGY 2015/16 20.
Results
Patient population and pharmacokinetic samples
Pharmacokinetic samples were available from 86.9% (351/404) of T‐DM1‐treated patients. Collectively, these 351 patients provided 1421 evaluable serum T‐DM1 concentration records (including eight records below the limit of quantification), which were included in the TH3RESA PopPK dataset. Baseline covariates in this subset of TH3RESA study participants were similar to those reported for the patient population used in the historical PopPK analysis 11 (Table S1), as well as the intent‐to‐treat TH3RESA study population 8. As mentioned above, tumour burden differed between the present PopPK population and the historical PopPK population, as the former was described using RECIST 1.1 and the latter RECIST 1.0.
Population pharmacokinetic analysis
Diagnostic plots revealed general goodness of fit (Figure 1). Cmax and Cmin observations were characterized well, with the exception of two individual Cmax values and three individual Cmin values that were notably high (>300 μg ml–1 and >10 μg ml–1, respectively). No obvious reasons for these elevated values were identified when these patients’ dosing histories and covariates were interrogated; thus, these values were retained in the dataset. T‐DM1‐treated patients exhibited a cycle 1 Cmax of 76.3 ± 11.3 μg ml–1, cycle 1 Cmin of 1.66 ± 0.94 μg ml–1 and AUCss of 357 ± 62.8 μg*day ml–1 (Table 1).
Figure 1.
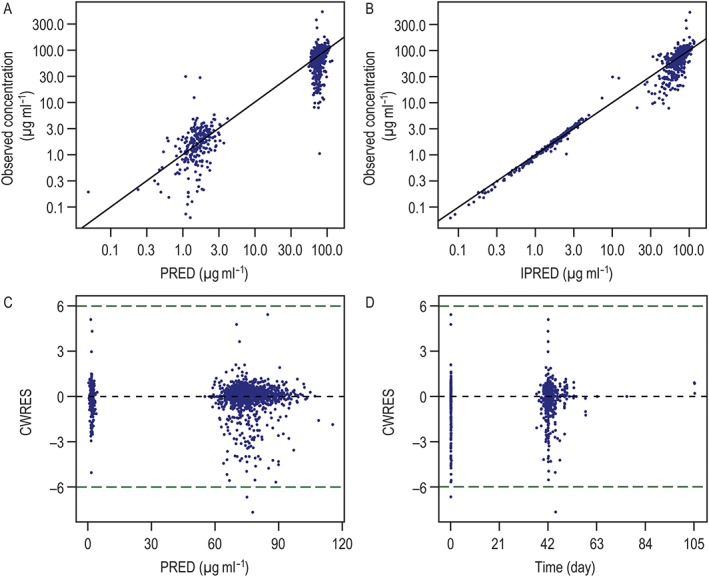
Goodness‐of‐fit plots for the PopPK analysis of TH3RESA. (A) DV vs. PRED; (B) DV vs. IPRED; (C) CWRES vs. PRED; and (D) CWRES vs. time. CWRES, conditional‐weighted residual; DV, observed; IPRED, individual population‐predicted T‐DM1 serum concentrations; PopPK, population pharmacokinetic; PRED, population‐predicted T‐DM1 serum concentrations; TH3RESA, A Study of Trastuzumab Emtansine in Comparison With Treatment of Physician's Choice in Patients With human epidermal growth factor receptor 2 (HER2)‐positive Breast Cancer Who Have Received at Least Two Prior Regimens of HER2‐directed Therapy
Table 1.
Summary of model‐predicted T‐DM1 exposure metrics by exposure quartile
| Mean (SD) | |||
|---|---|---|---|
| C max at cycle 1 (μg ml –1 ) | C min at cycle 1 (μg ml –1 ) | AUC ss (μg*day ml–1) | |
| All (N = 351) | 76.3 (11.3) | 1.66 (0.94) | 357 (62.8) |
| Quartile 1 (n = 88) | 62.5 (9.4) | 0.67 (0.28) | 279 (30.9) |
| Quartile 2 (n = 88) | 73.5 (1.9) | 1.30 (0.14) | 337 (12.8) |
| Quartile 3 (n = 87) | 79.6 (1.6) | 1.82 (0.17) | 376 (10.1) |
| Quartile 4 ( n = 88) | 89.4 (6.1) | 2.83 (0.93) | 437 (35.3) |
AUCss, area under the concentration–time curve at steady state; Cmax, maximum concentration; Cmin, minimum concentration; SD, standard deviation; T‐DM1, trastuzumab emtansine
External validation of the visual predictive check (VPC) was conducted to evaluate the predictive performance of the historical PopPK model with respect to the serum T‐DM1 concentrations measured in the TH3RESA study. In general, the model predicted the central tendency of the observed data well, although the model‐predicted 5th and 95th percentiles were greater than the observed 5th and 95th percentiles (Figure S1).
Exposure–response analyses of OS and PFS
In the TPC arm, 185 of 198 (93.4%) patients received ≥1 dose of study drug and had evaluable pharmacokinetic and efficacy data; these patients were included in the exposure–response analyses. The effect of T‐DM1 exposure on OS and PFS was first examined via the Kaplan–Meier method. Patients were stratified by quartiles for all model‐predicted exposure metrics, as no single T‐DM1 exposure metric provided strong scientific rationale as the most relevant efficacy driver (Figure 2). The exposure–response relationships were not consistent for the three analysed exposure metrics. A visual exposure–response relationship was observed for model‐predicted Cmin at cycle 1 and AUCss, with median OS and PFS increasing with higher exposure. The relationship was less evident for model‐predicted Cmax at cycle 1: median PFS was comparable between the lowest (Q1) and highest (Q4) exposure quartiles (6.3 months vs. 6.8 months, respectively). Therefore, model‐predicted Cmin at cycle 1 and AUCss were the exposure metrics used further to examine the relationship between T‐DM1 exposure and response.
Figure 2.

Kaplan–Meier curves for (A) OS and (B) PFS in the pharmacokinetic‐evaluable population of T‐DM1‐treated patients (n = 351) by quartile of model‐predicted T‐DM1 exposure metric and the efficacy‐evaluable population of TPC‐treated patients (n = 185). AUCss, area under the concentration–time curve at steady state; Cmax, maximum concentration; Cmin, minimum concentration; OS, overall survival; PFS, progression‐free survival; Q, quartile; T‐DM1, trastuzumab emtansine; TPC, treatment of physician's choice
Because of the univariate nature of the Kaplan–Meier analyses and the fact that differences in OS and PFS may have been confounded by other risk factors, the distribution of covariates was compared across T‐DM1 exposure quartiles (Table S2). The distribution of most covariates was comparable across T‐DM1 exposure quartiles, except that there was a trend for tumour burden, AST and alkaline phosphatase to be numerically greater in patients in the Q1 subgroup; in addition, a greater proportion of patients in the Q1 subgroup had an ECOG PS ≥1. Cox proportional hazard modelling was thus employed to correct for the imbalances in covariates across T‐DM1 exposure quartiles.
The final Cox proportional hazard models for OS corrected for ECOG PS, measurable disease, tumour burden, number of disease sites, baseline alkaline phosphatase, baseline AST and baseline albumin; model‐predicted Cmin at cycle 1 and AUCss were analysed as both categorical (quartiles; data not shown) and continuous variables (Table 2). During stepwise covariate model building, all of these covariates were selected – irrespective of the exposure metric (model‐predicted Cmin at cycle 1 vs. AUCss) or whether exposure was considered as a categorical vs. continuous variable – highlighting the influence of these covariates on OS. Overall, after covariate adjustment, the OS HRs decreased with increasing T‐DM1 exposure quartiles (Figure 3). Cmin at cycle 1 (analysed as a continuous variable) was significantly associated with OS (P < 0.001; Table 2). Notably, OS was more strongly associated with Cmin at cycle 1 than with AUCss. Although AUCss in the Q4 subgroup was associated with a numerically lower OS HR relative to the AUCss Q1−Q3 subgroups (Figure 3), Cox proportional hazard analysis with AUCss as a continuous variable showed that AUCss was not a significant predictor of HR at α = 0.05 following covariate adjustment (P = 0.065) (Table 2).
Table 2.
Cox proportional‐hazard models of OS and PFS (exposure metrics analysed as continuous variables)
| Exposure metric | Endpoint | Covariate adjusted | Covariates included in final model | P‐value * |
|---|---|---|---|---|
| C min at cycle 1 | OS | No | ––– | <0.001 |
| C min at cycle 1 | OS | Yes | ECOG, DME, TMBD, NDIS, ALKP, AST, ALBU | <0.001 |
| AUC ss | OS | No | ––– | <0.001 |
| AUC ss | OS | Yes | ECOG, DME, TMBD, NDIS, ALKP, AST, ALBU | 0.065 |
| C min at cycle 1 | PFS | No | ––– | <0.001 |
| C min at cycle 1 | PFS | Yes | ECOG, DME, TMBD | <0.001 |
| AUC ss | PFS | No | ––– | <0.001 |
| AUC ss | PFS | Yes | ECOG, DME, TMBD | <0.001 |
P‐value for testing whether the coefficient for exposure is equal to 0
ALBU, serum albumin concentration; ALKP, serum alkaline phosphatase concentration; AST, serum aspartate aminotransferase concentration; AUCss, area under the concentration–time curve at steady state; Cmin, minimum concentration; DME, measurable disease; ECOG, Eastern Cooperative Oncology Group performance status; NDIS, number of disease site, OS, overall survival; PFS, progression‐free survival; TMBD, tumour burden
Figure 3.

HRs for each T‐DM1 exposure quartile vs. TPC before and after adjusting for covariates in the final Cox proportional hazard models of OS and PFS. (A) model‐predicted Cmin at cycle 1. (B) AUCss. AUCss, area under the concentration–time curve at steady state; Cmin, minimum concentration; HR, hazard ratio; OS, overall survival; PFS, progression‐free survival; Q, quartile; TPC, treatment of physician's choice
The same set of baseline covariates [again, regardless of the exposure metric or variable type (categorical vs. continuous)] were selected in the Cox proportional hazard analysis of PFS. The final models for PFS corrected for ECOG PS, measurable disease and tumour burden in the presence of either model‐predicted Cmin at cycle 1 or AUCss (Table 2). Similar to the Cox proportional hazard analysis of OS, the PFS HRs generally decreased with increasing T‐DM1 exposure – both before and after adjusting for covariates and consideration as a categorical (Figure 3) vs. continuous (Table 2) variable. As observed with OS, PFS was more strongly associated with Cmin at cycle 1 than with AUCss.
Exposure–response analysis of ORR
The exposure–response analysis of ORR was based on patients with measurable disease at baseline. Of the 351 pharmacokinetic‐evaluable patients randomized to T‐DM1, 301 (86.0%) had measurable disease (Table S2). Of the 198 patients randomized to TPC, 163 (82.3%) had measurable disease. Model‐predicted Cmin at cycle 1 and AUCss were evaluated as continuous variables in final models that included the additional effect of ECOG PS. For both exposure metrics, an exposure–response trend was noted, with numerically higher ORRs seen with higher exposure to T‐DM1 (Figure 4). The ORRs based on model‐predicted Cmin at cycle 1 ranged from 0.16 [95% confidence interval (CI) 0.1, 0.25] in the lowest T‐DM1 exposure quartile (Q1) to 0.47 (95% CI 0.38, 0.56) in the highest exposure quartile (Q4); the ORRs in T‐DM1‐treated patients were numerically higher those that observed among TPC‐treated patients (0.09; 95% CI 0.06, 0.15). Similarly, the ORRs based on model‐predicted AUCss increased from 0.23 (95% CI 0.17, 0.31) in the lowest T‐DM1 exposure quartile to 0.43 (95% CI 0.34, 0.52) in the highest exposure quartile.
Figure 4.

Logistic regression analysis of the relationship between ORR and (A) Cmin at cycle 1 and (B) AUCss. Vertical ticks at each individual patient's exposure value represent whether the individual did (at 1) or did not (at 0) have an objective response. Solid points represent the mean ORR for each T‐DM1 exposure quartile (red) or the TPC arm (blue). Error bars represent ±2 standard errors of the mean. Centred curves and shaded areas represent predicted values and 95% CIs of model‐predicted response probability after covariate adjustment (ECOG). AUCss, area under the concentration–time curve at steady state; CI, confidence interval; Cmin, minimum concentration; ECOG, Eastern Cooperative Oncology Group performance status; ORR, objective response rate; OS, overall survival; PFS, progression‐free survival; T‐DM1, trastuzumab emtansine; TPC, treatment of physician's choice
Exposure–response analysis of safety
Logistic regression was used to evaluate the effect of T‐DM1 exposure on grade ≥3 thrombocytopenia, grade ≥3 hepatotoxicity and any grade ≥3 adverse event. Baseline covariates selected for each individual adverse event were incorporated into the final models. None of these adverse events increased with greater T‐DM1 exposure, either before or after adjusting for baseline risk factors (Figures [Link], [Link]).
Case‐matching analysis
In addition to Cox proportional hazard modelling, another methodology (i.e. case‐matching analysis) was used to adjust for numerically higher tumour burden, AST, alkaline phosphatase and proportions of ECOG PS ≥1 observed in the Q1 subgroup. Case‐matching analysis was performed on the complete set of potentially confounding covariates. Among the 88 T‐DM1‐treated patients in the Q1 subgroup (based on model‐predicted Cmin at cycle 1, given its stronger exposure–response trend for OS and PFS relative to model‐predicted AUCss), there were four who could not be matched to a TPC‐treated patient. All covariates in the remaining 84 T‐DM1‐treated patients in the Q1 subgroup were balanced after matching (Table S3). The HR for the comparison of T‐DM1‐treated patients in the Q1 subgroup with matched patients from the TPC arm was 0.96 (95% CI 0.63, 1.47) for OS and 0.92 (95% CI 0.64, 1.32) for PFS (Table 3). A sensitivity analysis including the four T‐DM1‐treated patients who could not be matched to TPC‐treated patients confirmed the robustness of the results from the primary case‐matching analysis (Table 3).
Table 3.
HRs for OS and PFS in patients in the T‐DM1 Q1 exposure subgroup (based on Cmin at cycle 1) and TPC‐treated patients
| Endpoint | Analysis | Median survival (months) | HR (95% CI) | |
|---|---|---|---|---|
| T‐DM1 Q1 subgroup | TPC | |||
| OS | Total cohort* | n = 88 | n = 185 | 1.14 (0.83, 1.55) |
| 14.16 | 15.84 | |||
| Matched cohort | n = 84 | n = 84 | 0.96 (0.63, 1.47) | |
| 14.16 | 17.05 | |||
| Sensitivity analysis | n = 88 | n = 84 | 0.93 (0.61, 1.41) | |
| 14.16 | 17.05 | |||
| PFS | Total cohort* | n = 88 | n = 185 | 0.85 (0.63, 1.15) |
| 4.24 | 3.25 | |||
| Matched cohort | n = 84 | n = 84 | 0.92 (0.64, 1.32) | |
| 4.44 | 3.68 | |||
| Sensitivity analysis | n = 88 | n = 84 | 0.96 (0.68, 1.38) | |
| 4.24 | 3.68 | |||
Unadjusted HR
CI, confidence interval; Cmin, minimum concentration; HR, hazard ratio; OS, overall survival; PFS, progression‐free survival; Q, quartile; T‐DM1, trastuzumab emtansine; TPC, treatment of physician's choice
Discussion
Exposure–response analyses performed at the time of the FDA review of the BLA for T‐DM1 suggested that the dose of T‐DM1 (3.6 mg kg–1 q3w) currently approved for patients with MBC might not be optimal and that there might be an opportunity further to assess treatment dose in a subset of patients with low T‐DM1 exposure 6, 7. These extensive analyses used TH3RESA study data to further our understanding of exposure–response relationships in a population of MBC patients with a wide range of prior treatments, baseline characteristics and pathophysiological covariates. Furthermore, a variety of methodologies were explored, and different exposure metrics were used to determine the best exposure metric for such analyses. The results of these exposure–response analyses will be assessed alongside previously conducted EMILIA exposure–response analyses to determine whether treatment dose is optimal for patients with MBC and low T‐DM1 exposure.
Despite the different treatment history of patients with HER2‐positive MBC enrolled to EMILIA (previous trastuzumab‐based treatment) and TH3RESA (≥2 previous HER2‐directed regimens), prior PopPK analysis has shown the pharmacokinetic properties of T‐DM1 to be consistent across different HER2‐positive MBC populations 11. In the current PopPK analysis, the pharmacokinetics of T‐DM1 observed in the phase III TH3RESA study were described well by the historical PopPK model 11. Although HER2 ECD (data not collected) and tumour burden data (assessed using RECIST v1.1 vs. v1.0) were not included in the TH3RESA PopPK analysis, goodness‐of‐fit diagnostics demonstrated that the historical T‐DM1 PopPK model provided reliable predictions of the individual exposure metrics observed in TH3RESA. The VPC results (Figure S1) were considered acceptable, especially as this represented an external predictive check (i.e. the data derived from a study that was not included in model development or estimation). As seen with model‐predicted AUCss, individual predictions of T‐DM1 exposure metrics were similar for the TH3RESA PopPK and historical PopPK populations 11. In addition, given that there was no significant accumulation of T‐DM1 following repeated dosing 21, model‐predicted Cmax and Cmin at cycle 1 in TH3RESA were compared with that of steady‐state values reported previously 11, and were found to be comparable.
In Kaplan–Meier analysis, patients with higher model‐predicted Cmin at cycle 1 and AUCss (Q2–Q4) exhibited a numerically longer median OS and PFS (lower HR estimates) than patients in the lowest T‐DM1 exposure (Q1). A similar relationship was seen in the exposure–response analyses of EMILIA data 6. Although the distribution of most covariates was comparable across T‐DM1 exposure quartiles, patients in the Q1 subgroup had a numerically higher tumour burden, AST and alkaline phosphatase, and were more likely to have an ECOG PS ≥1 relative to patients in the Q2–Q4 subgroups. As the survival differences across T‐DM1 exposure quartiles could have been influenced by disease‐related covariates, Cox proportional hazard modelling was used to adjust for these potentially confounding baseline covariates. However, after covariate adjustment, the apparent exposure–response trends between model‐predicted Cmin at cycle 1 and survival (OS or PFS) was maintained; the HRs for both OS and PFS decreased numerically with increasing model‐predicted Cmin at cycle 1. These trends were seen, regardless of whether the Cmin at cycle 1 was included in the model as either a categorical (quartile) or continuous variable. However, the trends in the covariate‐adjusted models were more shallow than those observed in the univariate Kaplan–Meier analyses. Moreover, model‐predicted Cmin at cycle 1 exhibited a stronger exposure–response trend than model‐predicted AUCss. In fact, in the Cox proportional hazard model in which AUCss was analysed as a continuous variable, the exposure–response relationship with OS was no longer statistically significant (P > 0.05) after covariate adjustment, suggesting that the selection of exposure metrics (Cmin at cycle 1 vs. AUCss) and imputation of exposure metrics (quartile vs. continuous) may have an impact on the interpretation of the exposure–response relationship.
ORRs in T‐DM1‐treated patients were higher than those observed in TPC‐treated patients. In the exposure–response analysis of ORR, ORR increased numerically with increasing T‐DM1 exposure. This exposure–response relationship was evident in models using either model‐predicted Cmin at cycle 1 or AUCss. Overall, the exposure–response relationships for ORR were consistent with the analyses of OS and PFS. For the exposure–response analyses of safety endpoints, irrespective of exposure metric (model‐predicted Cmax at cycle 1, Cmin at cycle 1 or AUCss), no exposure–response relationship was evident for grade ≥3 thrombocytopenia, grade ≥3 hepatotoxicity or any grade ≥3 adverse event, which is consistent with the exposure–response analyses of EMILIA study data 6.
With regard to study limitations, 13% of T‐DM1‐treated patients in TH3RESA did not have pharmacokinetic samples available for analysis. Although this is a potential source of bias, survival estimates were comparable for the pharmacokinetic‐evaluable population (median OS 23.7 months; median PFS 6.5 months) and the intent‐to‐treat population (median OS 22.7 months; median PFS 6.2 months) 8. The similarity in survival curves indicates that the subset of patients examined in the present analysis adequately represents all T‐DM1‐treated patients participating in TH3RESA (Figure S5). Another limitation is related to the examination of only single dose/dosage level of T‐DM1 (3.6 mg kg–1 q3w). In oncology, disease factors that have an impact on efficacy can affect exposure to monoclonal antibodies, with more advanced disease leading to reduced drug exposure and thus poorer efficacy 11, 22. Even with the application of correction methods, the impact of disease severity on treatment exposure may result in an overestimation of exposure–response relationships (i.e. an apparent steep exposure–response trend is observed when the true exposure–response relationship is flat) 23, 24. Although we could not rule out a causal relationship between exposure and efficacy with T‐DM1 3.6 mg kg–1 q3w in the present analysis, emerging evidence on the exposure–response relationships for tumour‐targeting biologics suggests that the observed trend for T‐DM1 is likely to be confounded, a consequence of the lack of covariate(s) that adequately capture disease severity; thus, the impact of disease severity might not have been fully adjusted by the methodologies applied in the current analysis.
Multiple methodologies have been used to assess the need for T‐DM1 dose optimization in patients with low exposure. In the unadjusted Cox proportional hazard analysis – despite T‐DM1‐treated patients in the Q1 subgroup (based on either model‐predicted Cmin at cycle 1 or AUCss) having numerically lower median OS than TPC‐treated patients – OS HRs for the comparison of the Q1 subgroup with TPC were not significant (stratification based on Cmin: 14.2 months vs. 15.8 months; HR, 1.14; 95% CI 0.83, 1.55; stratification based on AUCss: 14.0 months vs. 15.8 months; HR, 1.07; 95% CI 0.78, 1.47). After adjusting for covariates, the OS HRs for the comparison of the Q1 subgroup with TPC remained nonsignificant, with HRs decreasing slightly, regardless of whether the Q1 subgroup was based on model‐predicted Cmin at cycle 1 (0.89; 95% CI 0.64, 1.23) or AUCss (0.77; 95% CI 0.56, 1.08). Similarly, in a case‐matching analysis in which patients in the Q1 subgroup were matched to TPC‐treated patients using propensity scores, the OS HR based on model‐predicted Cmin at cycle 1 was 0.96 (95% CI 0.63, 1.47). Although these data suggest the opportunity for dose optimization in patients with low T‐DM1 exposure (Q1), identifying these patients a priori needs to be further evaluated. Collectively, these data suggest that T‐DM1 3.6 mg kg–1 q3w is unlikely to be detrimental to survival in patients with low T‐DM1 exposure (Q1), and could be considered as an additional treatment option for such patients.
In summary, the present PopPK analysis indicated that the pharmacokinetics of T‐DM1 in the TH3RESA study population were comparable with those observed in the population of patients with MBC used to inform the historical PopPK model. While we identified an apparent exposure–response relationship for efficacy, with inconsistent exposure–response trends observed across different exposure metrics, no relationship between exposure and any of the safety endpoints examined was found. Additionally, our results suggest that the approved T‐DM1 dose is unlikely to be detrimental to patients with low exposure as compared with TPC.
Competing Interests
S.‐C.C., A.Q., X.W., S.V., M.S., J.Y.J., S.G. and C.L. are salaried employees of Genentech, Inc. and own stock in F. Hoffmann‐La Roche. D.P., M.R. and J.F. are salaried employees of Metrum Research Group, which was contracted by Genentech, Inc. S.H. is an employee of KOEHLER‐eCLINICAL working on behalf of F. Hoffmann‐La Roche. A.S. is a salaried employee of, and owns stock in, F. Hoffmann‐La Roche.
The authors would like to thank Nataliya Chernyukhin for her contributions to data analysis and interpretation. The TH3RESA study was funded by F. Hoffmann‐La Roche/Genentech, Inc. Support for third‐party writing assistance was provided by Genentech, Inc.
Contributors
S.‐C.C., A.Q., J.F., J.Y.J., S.G. and C.L. contributed to study design, and data analysis and interpretation. D.P., M.R., M.S., S.H. and A.S. were involved in data analysis and interpretation. X.W. collected the data for this analysis. S.V. prepared the data for analysis. The first draft of this manuscript was written by S.‐C.C. and C.L., with all authors critically reviewing for content.
Supporting information
Figure S1 Visual predictive check of T‐DM1 serum concentration–time profile in TH3RESA determined using the historical T‐DM1 PopPK model. Dashed line and grey‐shaded area are simulated median and 90% prediction interval. Circles and errors bars are median and 90th percentiles of observed T‐DM1 serum concentration at Cmin (blue), end of infusion plus 15 min (purple) and end of infusion plus 2 h (green). Cmin, minimum concentration; PopPK, population pharmacokinetic; TH3RESA, A Study of Trastuzumab Emtansine in Comparison With Treatment of Physician's Choice in Patients With human epidermal growth factor receptor 2 (HER2)‐positive Breast Cancer Who Have Received at Least Two Prior Regimens of HER2‐directed Therapy; T‐DM1, trastuzumab emtansine
Figure S2 Logistic regression analysis of the relationship between any grade ≥3 adverse event and (A) Cmin at cycle 1; (B) AUCss; and (C) Cmax at cycle 1. Vertical ticks at each individual patient's exposure value represent whether the individual did (at 1) or did not (at 0) experience a grade ≥ 3 adverse event. Solid points represent the mean probability for each T‑DM1 exposure quartile (black) or the TPC arm (aqua). Error bars represent ±2 standard errors of the mean. Centred curves and shaded areas represent predicted values and 95% CIs of model‐predicted AE probability before (red) and after (blue) adjusting for covariates (ECOG PS and AST). AE, adverse event; AST, aspartate aminotransferase; AUCss, area under the concentration–time curve at steady state; CI, confidence interval; Cmax, maximum concentration; Cmin, minimum concentration; ECOG PS, Eastern Cooperative Oncology Group performance status; T‐DM1, trastuzumab emtansine; TPC, treatment of physician's choice
Figure S3 Logistic regression analysis of the relationship between grade ≥3 hepatotoxicity and (A) Cmin at cycle 1; (B) AUCss; and (C) Cmax at cycle 1. Vertical ticks at each individual patient's exposure value represent whether the individual did (at 1) or did not (at 0) experience grade ≥3 hepatotoxicity Solid points represent the mean probability for each T‑DM1 exposure quartile (black) or the TPC arm (aqua). Error bars represent ±2 standard errors of the mean. Centred curves and shaded areas represent predicted values and 95% CIs of model‐predicted AE probability before (red) and after (blue) adjusting for covariates (ECOG PS and AST). AE, adverse event; AST, aspartate aminotransferase; AUCss, area under the concentration–time curve at steady state; CI, confidence interval; Cmax, maximum concentration; Cmin, minimum concentration; ECOG PS, Eastern Cooperative Oncology Group performance status; T‐DM1, trastuzumab emtansine; TPC, treatment of physician's choice
Figure S4 Logistic regression analysis of the relationship between grade ≥3 thrombocytopenia and (A) Cmin at cycle 1; (B) AUCss; and (C) Cmax at cycle 1. Vertical ticks at each individual patient's exposure value represent whether the individual did (at 1) or did not (at 0) experience grade ≥3 thrombocytopenia. Solid points represent the mean probability for each T‑DM1 exposure quartile (black) or the TPC arm (aqua). Error bars represent ±2 standard errors of the mean. Centred curves and shaded areas represent predicted values and 95% CIs of model‐predicted AE probability before (red) and after (blue) adjusting for covariates (race, brain metastasis, alkaline phosphatase and ALT). AE, adverse event; ALT, alanine aminotransferase; AUCss, area under the concentration–time curve at steady state; CI, confidence interval; Cmax, maximum concentration; Cmin, minimum concentration; T‐DM1, trastuzumab emtansine; TPC, treatment of physician's choice
Figure S5 Kaplan–Meier curves for (A) OS and (B) PFS in all T‐DM1–treated patients in TH3RESA (n = 404) and the subset of pharmacokinetic‐evaluable T‐DM1–treated patients (n = 351). OS, overall survival; PFS, progression‐free survival; TH3RESA, A Study of Trastuzumab Emtansine in Comparison With Treatment of Physician's Choice in Patients With human epidermal growth factor receptor 2 (HER2)‐positive Breast Cancer Who Have Received at Least Two Prior Regimens of HER2‐directed Therapy
Table S1 Covariate values in the historical PopPK and TH3RESA PopPK datasets. PopPK, population pharmacokinetic; TH3RESA, A Study of Trastuzumab Emtansine in Comparison With Treatment of Physician's Choice in Patients With human epidermal growth factor receptor 2 (HER2)‐positive Breast Cancer Who Have Received at Least Two Prior Regimens of HER2‐directed Therapy
Table S2 Summary of baseline covariates in T‐DM1–treated patients by quartile of model‐predicted Cmin at cycle 1 and AUCss and in TPC‐treated patients. AUCss, area under the concentration–time curve at steady state; Cmin, minimum concentration; T‐DM1, trastuzumab emtansine; TPC, treatment of physician's choice
Table S3 Covariate summary before and after matching T‐DM1–treated patients in the lowest exposure quartile (Q1) based on model‐predicted Cmin at cycle 1. Cmin, minimum concentration; T‐DM1, trastuzumab emtansine
Chen, S.‐C. , Quartino, A. , Polhamus, D. , Riggs, M. , French, J. , Wang, X. , Vadhavkar, S. , Smitt, M. , Hoersch, S. , Strasak, A. , Jin, J. Y. , Girish, S. , and Li, C. (2017) Population pharmacokinetics and exposure–response of trastuzumab emtansine in advanced breast cancer previously treated with ≥2 HER2‐targeted regimens. Br J Clin Pharmacol, 83: 2767–2777. doi: 10.1111/bcp.13381.
References
- 1. Lewis Phillips GD, Li G, Dugger DL, Crocker LM, Parsons KL, Mai E, et al Targeting HER2‐positive breast cancer with trastuzumab‐DM1, an antibody‐cytotoxic drug conjugate. Cancer Res 2008; 68: 9280–9290. [DOI] [PubMed] [Google Scholar]
- 2. Junttila TT, Li G, Parsons K, Phillips GL, Sliwkowski MX. Trastuzumab‐DM1 (T‐DM1) retains all the mechanisms of action of trastuzumab and efficiently inhibits growth of lapatinib insensitive breast cancer. Breast Cancer Res Treat 2011; 128: 347–356. [DOI] [PubMed] [Google Scholar]
- 3. Barok M, Tanner M, Köninki K, Isola J. Trastuzumab‐DM1 is highly effective in preclinical models of HER2‐positive gastric cancer. Cancer Lett 2011; 306: 171–179. [DOI] [PubMed] [Google Scholar]
- 4. Krop IE, Beeram M, Modi S, Jones SF, Holden SN, Yu W, et al Phase I study of trastuzumab‐DM1, an HER2 antibody‐drug conjugate, given every 3 weeks to patients with HER2‐positive metastatic breast cancer. J Clin Oncol 2010; 28: 2698–2704. [DOI] [PubMed] [Google Scholar]
- 5. Verma S, Miles D, Gianni L, Krop IE, Welslau M, Baselga J, et al, EMILIA Study Group . Trastuzumab emtansine for HER2‐positive advanced breast cancer. N Engl J Med 2012; 367: 1783–1791 Erratum in N Engl J Med 2013;368:2442. [DOI] [PMC free article] [PubMed] [Google Scholar]
- 6. Wang J, Song P, Schrieber S, Liu Q, Xu Q, Blumenthal G, et al Exposure‐response relationship of T‐DM1: insight into dose optimization for patients with HER2‐positive metastatic breast cancer. Clin Pharmacol Ther 2013; 95: 558–564. [DOI] [PubMed] [Google Scholar]
- 7. The US FDA clinical pharmacology and biopharmaceutics review for KADCYLA (ado‐trastuzumab Emtansine, T‐DM1). Available at http://www.accessdata.fda.gov/drugsatfda_docs/nda/2013/125427Orig1s000ClinPharmR.pdf (last accessed July 2016)
- 8. Krop IE, Kim SB, González‐Martín A, LoRusso PM, Ferrero JM, Smitt M, et al, TH3RESA study collaborators . Trastuzumab emtansine versus treatment of physician's choice for pre‐treated HER2‐positive advanced breast cancer (TH3RESA): a randomised, open‐label, phase 3 trial. Lancet Oncol 2014; 15: 689–699. [DOI] [PubMed] [Google Scholar]
- 9. Dere R, Yi JH, Lei C, Saad OM, Huang C, Li Y, et al PK assays for antibody‐drug conjugates: case study with ado‐trastuzumab emtansine. Bioanalysis 2013; 5: 1025–1040. [DOI] [PubMed] [Google Scholar]
- 10. Bergstrand M, Karlsson MO. Handling data below the limit of quantification in mixed effect models. AAPS J 2009; 11: 371–380. [DOI] [PMC free article] [PubMed] [Google Scholar]
- 11. Lu D, Girish S, Gao Y, Wang B, Yi JH, Guardino E, et al Population pharmacokinetics of trastuzumab emtansine (T‐DM1), a HER2‐targeted antibody–drug conjugate, in patients with HER2‐positive metastatic breast cancer: clinical implications of the effect of covariates. Cancer Chemother Pharmacol 2014; 74: 399–410. [DOI] [PMC free article] [PubMed] [Google Scholar]
- 12. Eisenhauer EA, Therasse P, Bogaerts J, Schwartz LH, Sargent D, Ford R, et al New response evaluation criteria in solid tumours: revised RECIST guideline (version 1.1). Eur J Cancer 2009; 45: 228–247. [DOI] [PubMed] [Google Scholar]
- 13. Therasse P, Arbuck SG, Eisenhauer EA, Wanders J, Kaplan RS, Rubinstein L, et al New guidelines to evaluate the response to treatment in solid tumors. European Organization for Research and Treatment of cancer, National Cancer Institute of the United States, National Cancer Institute of Canada. J Natl Cancer Inst 2000; 92: 205–216. [DOI] [PubMed] [Google Scholar]
- 14. Yang J, Zhao H, Garnett C, Rahman A, Gobburu JV, Pierce W, et al The combination of exposure‐response and case‐control analyses in regulatory decision making. J Clin Pharmacol 2013; 53: 160–166. [DOI] [PubMed] [Google Scholar]
- 15. Rosenbaum PR, Rubin DB. The central role of the propensity score in observational studies for causal effects. Biometrika 1983; 70: 41–55. [Google Scholar]
- 16. Stuart EA. Matching methods for causal inference: a review and a look forward. Stat Sci 2010; 25: 1–21. [DOI] [PMC free article] [PubMed] [Google Scholar]
- 17. Ho D, Imai K, King G, Stuart E. Matching as nonparametric preprocessing for reducing model dependence in parametric causal inference. Political Analysis 2007; 15: 199–236. [Google Scholar]
- 18. Stuart EA, Green KM. Using full matching to estimate causal effects in nonexperimental studies: examining the relationship between adolescent marijuana use and adult outcomes. Dev Psychol 2008; 44: 395–406. [DOI] [PMC free article] [PubMed] [Google Scholar]
- 19. Southan C, Sharman JL, Benson HE, Faccenda E, Pawson AJ, Alexander SPH, et al The IUPHAR/BPS guide to pharmacology in 2016: towards curated quantitative interactions between 1300 protein targets and 6000 ligands. Nucleic Acids Res 2016; 44: D1054–D1068. [DOI] [PMC free article] [PubMed] [Google Scholar]
- 20. Alexander SPH, Fabbro D, Kelly E, Marrion N, Peters JA, Benson HE, et al The Concise Guide to PHARMACOLOGY 2015/16: Enzymes. Br J Pharmacol 2015; 172: 6024–6109. [DOI] [PMC free article] [PubMed] [Google Scholar]
- 21. Girish S, Gupta M, Wang B, Lu D, Krop IE, Vogel CL, et al Clinical pharmacology of trastuzumab emtansine (T‐DM1): an antibody‐drug conjugate in development for the treatment of HER2‐positive cancer. Cancer Chemother Pharmacol 2012; 69: 1229–1240. [DOI] [PMC free article] [PubMed] [Google Scholar]
- 22. Cosson VF, Ng VW, Lehle M, Lum BL. Population pharmacokinetics and exposure‐response analyses of trastuzumab in patients with advanced gastric or gastroesophageal junction cancer. Cancer Chemother Pharmacol 2014; 73: 737–747. [DOI] [PubMed] [Google Scholar]
- 23. Liu J, Wang Y, Zhao L. Assessment of exposure‐response (E‐R) and case‐control (C‐C) analyses in oncology using simulation based approach. Presented at the annual meeting of the American Conference of Pharmacometrics. October 4–7, 2015 (abstr: W‐34).
- 24. Wang Y. Special considerations for modeling exposure‐response for biologics. Presented at the annual meeting of the American Society for Clinical Pharmacology and Therapeutics. 8–12 March, 2016.
Associated Data
This section collects any data citations, data availability statements, or supplementary materials included in this article.
Supplementary Materials
Figure S1 Visual predictive check of T‐DM1 serum concentration–time profile in TH3RESA determined using the historical T‐DM1 PopPK model. Dashed line and grey‐shaded area are simulated median and 90% prediction interval. Circles and errors bars are median and 90th percentiles of observed T‐DM1 serum concentration at Cmin (blue), end of infusion plus 15 min (purple) and end of infusion plus 2 h (green). Cmin, minimum concentration; PopPK, population pharmacokinetic; TH3RESA, A Study of Trastuzumab Emtansine in Comparison With Treatment of Physician's Choice in Patients With human epidermal growth factor receptor 2 (HER2)‐positive Breast Cancer Who Have Received at Least Two Prior Regimens of HER2‐directed Therapy; T‐DM1, trastuzumab emtansine
Figure S2 Logistic regression analysis of the relationship between any grade ≥3 adverse event and (A) Cmin at cycle 1; (B) AUCss; and (C) Cmax at cycle 1. Vertical ticks at each individual patient's exposure value represent whether the individual did (at 1) or did not (at 0) experience a grade ≥ 3 adverse event. Solid points represent the mean probability for each T‑DM1 exposure quartile (black) or the TPC arm (aqua). Error bars represent ±2 standard errors of the mean. Centred curves and shaded areas represent predicted values and 95% CIs of model‐predicted AE probability before (red) and after (blue) adjusting for covariates (ECOG PS and AST). AE, adverse event; AST, aspartate aminotransferase; AUCss, area under the concentration–time curve at steady state; CI, confidence interval; Cmax, maximum concentration; Cmin, minimum concentration; ECOG PS, Eastern Cooperative Oncology Group performance status; T‐DM1, trastuzumab emtansine; TPC, treatment of physician's choice
Figure S3 Logistic regression analysis of the relationship between grade ≥3 hepatotoxicity and (A) Cmin at cycle 1; (B) AUCss; and (C) Cmax at cycle 1. Vertical ticks at each individual patient's exposure value represent whether the individual did (at 1) or did not (at 0) experience grade ≥3 hepatotoxicity Solid points represent the mean probability for each T‑DM1 exposure quartile (black) or the TPC arm (aqua). Error bars represent ±2 standard errors of the mean. Centred curves and shaded areas represent predicted values and 95% CIs of model‐predicted AE probability before (red) and after (blue) adjusting for covariates (ECOG PS and AST). AE, adverse event; AST, aspartate aminotransferase; AUCss, area under the concentration–time curve at steady state; CI, confidence interval; Cmax, maximum concentration; Cmin, minimum concentration; ECOG PS, Eastern Cooperative Oncology Group performance status; T‐DM1, trastuzumab emtansine; TPC, treatment of physician's choice
Figure S4 Logistic regression analysis of the relationship between grade ≥3 thrombocytopenia and (A) Cmin at cycle 1; (B) AUCss; and (C) Cmax at cycle 1. Vertical ticks at each individual patient's exposure value represent whether the individual did (at 1) or did not (at 0) experience grade ≥3 thrombocytopenia. Solid points represent the mean probability for each T‑DM1 exposure quartile (black) or the TPC arm (aqua). Error bars represent ±2 standard errors of the mean. Centred curves and shaded areas represent predicted values and 95% CIs of model‐predicted AE probability before (red) and after (blue) adjusting for covariates (race, brain metastasis, alkaline phosphatase and ALT). AE, adverse event; ALT, alanine aminotransferase; AUCss, area under the concentration–time curve at steady state; CI, confidence interval; Cmax, maximum concentration; Cmin, minimum concentration; T‐DM1, trastuzumab emtansine; TPC, treatment of physician's choice
Figure S5 Kaplan–Meier curves for (A) OS and (B) PFS in all T‐DM1–treated patients in TH3RESA (n = 404) and the subset of pharmacokinetic‐evaluable T‐DM1–treated patients (n = 351). OS, overall survival; PFS, progression‐free survival; TH3RESA, A Study of Trastuzumab Emtansine in Comparison With Treatment of Physician's Choice in Patients With human epidermal growth factor receptor 2 (HER2)‐positive Breast Cancer Who Have Received at Least Two Prior Regimens of HER2‐directed Therapy
Table S1 Covariate values in the historical PopPK and TH3RESA PopPK datasets. PopPK, population pharmacokinetic; TH3RESA, A Study of Trastuzumab Emtansine in Comparison With Treatment of Physician's Choice in Patients With human epidermal growth factor receptor 2 (HER2)‐positive Breast Cancer Who Have Received at Least Two Prior Regimens of HER2‐directed Therapy
Table S2 Summary of baseline covariates in T‐DM1–treated patients by quartile of model‐predicted Cmin at cycle 1 and AUCss and in TPC‐treated patients. AUCss, area under the concentration–time curve at steady state; Cmin, minimum concentration; T‐DM1, trastuzumab emtansine; TPC, treatment of physician's choice
Table S3 Covariate summary before and after matching T‐DM1–treated patients in the lowest exposure quartile (Q1) based on model‐predicted Cmin at cycle 1. Cmin, minimum concentration; T‐DM1, trastuzumab emtansine