

Abstract
We present a composite procedure for the quantum‐chemical computation of spin–spin‐coupled 1H NMR spectra for general, flexible molecules in solution that is based on four main steps, namely conformer/rotamer ensemble (CRE) generation by the fast tight‐binding method GFN‐xTB and a newly developed search algorithm, computation of the relative free energies and NMR parameters, and solving the spin Hamiltonian. In this way the NMR‐specific nuclear permutation problem is solved, and the correct spin symmetries are obtained. Energies, shielding constants, and spin–spin couplings are computed at state‐of‐the‐art DFT levels with continuum solvation. A few (in)organic and transition‐metal complexes are presented, and very good, unprecedented agreement between the theoretical and experimental spectra was achieved. The approach is routinely applicable to systems with up to 100–150 atoms and may open new avenues for the detailed (conformational) structure elucidation of, for example, natural products or drug molecules.
Keywords: conformational analysis, density functional calculations, NMR spectroscopy, quantum chemistry, tight-binding method
Nuclear magnetic resonance (NMR) is the most important spectroscopic technique in chemistry. It combines very high resolution with an extremely rich information content about the local properties of atoms in molecules in terms of the geometric as well as electronic structure. The theoretical, quantum mechanical (QM) analysis of NMR experiments and the resulting spectra has a long history.1, 2 With modern linear‐response‐based quantum‐chemistry methods (e.g., density functional theory, DFT), the ab initio computation of the parameters in the NMR spin Hamiltonian, that is, the nuclear magnetic shielding constants (or the chemical shifts δ on a relative scale) and the indirect spin–spin coupling constants (J, SSCCs), has become quite routine3 (for recent mixed DFT/empirical approaches, see Ref. 4). With standard hybrid functional approximations, reasonable accuracies of about 0.1–0.3 ppm (for δ) and 0.5 Hz (for J) can be achieved for these second‐order properties of organic molecules.5, 6, 7, 8 Although these data can often be directly compared to experiment, until now, no fully automated procedure has been described that computes a properly averaged, fully coupled NMR spectrum entirely by quantum chemistry. To the best of our knowledge, such a composite scheme consisting of four more or less independent steps as illustrated in Figure 1 is proposed here for the first time (for related incomplete attempts, see Refs. 5, 9, and 10). From the very beginning, it was constructed with an eye on robustness and computational feasibility so that natural products with about 100 atoms can be treated and that spectra for systems with 40–70 atoms can be computed within hours on a standard quad‐core laptop computer.
Figure 1.
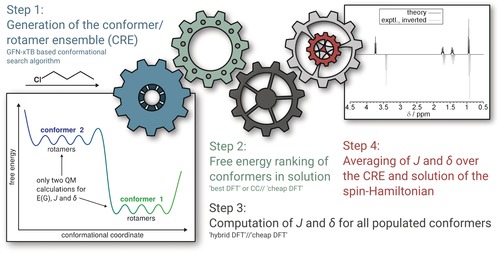
Composite procedure for the automated computation of NMR spectra.
For a given set of magnetic nuclei in a molecule with known shifts and coupling constants, the resulting spin Hamiltonian can be built exactly. In the following, we considered N nuclei with spin 1/2 (protons) exclusively but it should be noted that our approach is general, non‐empirical, and hence applicable to arbitrary nuclei and basically any molecule. The spin problem is of 2N (exponential) complexity but owing to the “near‐sightedness” of the SSCC (typically less than five covalent bonds), the full spin system can be separated, as demonstrated by Castillo and co‐workers.11 We applied a similar procedure based on overlapping fragments with so‐called buffer spins, which are included in the diagonalization of the spin Hamiltonian but do not contribute to the intensities (see the Supporting Information for a detailed discussion of this feature as well as the entire theoretical procedure). Our newly written anmr code can basically treat spin systems of arbitrary size for molecules with less than 12–14 significantly coupled spins per fragment (step 4 in Figure 1). The chemical shifts as well as the SSCCs were computed at a standard DFT hybrid level (PBE0) employing Jensen's special pcS and pcJ Gaussian AO basis sets,12 respectively, for these properties (step 3). For the here considered 1H NMR spectra, mostly J HH coupling constants are required, which are dominated by the Fermi contact term,5 and for reasons of computational efficiency, we restricted the computation to this term, which significantly sped up the calculations. The equilibrium geometries in these single‐point computations were taken from our robust low‐cost DFT composite procedure PBEh‐3c because many optimizations have to be conducted. The conformational energies were obtained at a sophisticated DFT level (step 2, after re‐optimization and pre‐ranking of initial structures), and all steps included a treatment of solvation effects by standard continuum models (see the Supporting Information for details). In standard notation the “best practice” level for the conformational free energies reads DSD‐BLYP‐D3/def2‐TZVPP+Gsolv [COSMO‐RS]+GRRHO [GFN‐xTB]//PBEh‐3c[DCOSMO‐RS].13 Most of the DFT computations reported herein (and all NMR parameter calculations) were conducted with the ORCA quantum‐chemistry code14 ((D)COSMO‐RS with TURBOMOLE15).
The crucial and thus far unsolved problem for the general prediction of NMR spectra is the thermally induced, nuclear permutation (and averaging) already mentioned by Bagno.5 Taking a Boltzmann average of NMR parameters computed for individual conformers, as suggested for example by Willoughby and co‐workers,10 is necessary but unfortunately insufficient to model real systems. As shown in Figure 1 (left inset), a thermally accessible ensemble of minimum‐energy structures generally consists of conformers as well as rotamers (conformer/rotamer ensemble, CRE). A conformer belongs to a set of stereoisomers, each of which is characterized by a distinct energy minimum.16 Rotamers arise from restricted bond rotation (or other low‐barrier motions such as inversion), leading to an interchange of nuclei but to minima with identical energies and NMR parameters. Rotamers contribute substantially to the molecular entropy, and the completeness of an ensemble can be checked by comparing the experimental and theoretical values (see the Supporting Information). Rotamers are of utmost importance here because they represent the rapid nuclei interchange (typically on a sub‐picosecond time scale) that leads to an average of NMR parameters on the much slower time scale of the experiment (for very slow, high‐barrier (>15–20 kcal mol−1) processes, additive signals for different species, termed “isomers” here, are observed). Not considering rotamers would yield totally wrong simulated spectra, for example, isolated methyl groups would not show single (singlet) signals and an ethyl group would not give rise to the expected simple quartet/triplet splitting (see below). Note that intermediate cases leading to line‐broadening effects are not considered, that is, our method works only for very slow and very fast nuclei exchange.
The key point of the present work was to automatically obtain a single set of CRE‐averaged and properly (dynamic) symmetry‐permuted NMR parameters entirely from quantum chemistry. This was achieved in steps 1–3 of the proposed composite scheme, in which first a CRE is computed explicitly with the help of the fast semi‐empirical tight‐binding quantum chemical method GFN‐xTB as implemented in the xtb code.17, 18 This method has already been successfully applied to various chemical problems19 and is absolutely essential here. For the CRE generation, a new composite algorithm consisting of normal mode following, “genetic” structure crossing, and long (1–2 ns) molecular dynamics (MD) based simulated annealing has been developed (see the Supporting Information). Various conformational search algorithms that partially exploit similar ideas have been proposed20 but most of them are applicable only to (bio)organic systems and employ only classical force fields, while rotamers are not considered explicitly. In addition to the conformer ensemble (which is also valuable for other spectroscopic methods, such as circular dichroism21), our new scheme non‐empirically provides information on chemical as well as magnetic equivalence and for which atom pairs J values have to be averaged. This requires hundreds to thousands of numerically very well converged full geometry optimizations and thus cannot be conducted routinely at any standard DFT level. Another feature of the new method is its generality as not only organic molecules but basically any molecular system can be treated (heavier nuclei require consideration of other relativistic effects in calculations of the NMR parameters; see Ref. 22).
In addition to the J/δ data, the relative free energies of each conformer (in the typical solvent CDCl3) are needed, which are converted into Boltzmann populations to weight the (rotamer‐averaged) J/δ values (step 2). Many parts of the above procedure are run in parallel such that the total wall time from a Lewis structure to the predicted spectrum for a molecule with 50 atoms is only a few hours. Normally, the DFT calculations represent the computational bottleneck while the calculation of the final spectrum takes only a few seconds to minutes (the CRE generation is of intermediate computational effort).
Note that widely used software such as ACDlabs30a or a common web‐based NMR simulation tool (“NMR predict”)30b estimate J/δ values by empirical (incremental) schemes, and do not properly average (e.g., methyl and ethyl groups are recognized by cheminformatics). This approach may sometimes work but it is not general, does not accurately describe fundamental stereochemical problems (see below), and completely fails for unusual organometallic compounds, for example. Solely conducting MD simulations and taking a few snapshots for the DFT‐based NMR parameter calculation as proposed by Kwan and Liu23 (see also Ref. 24) does not solve the problem either because a proper average cannot be obtained in this way with reasonable effort, and furthermore, somewhat higher but still thermally accessible barriers (5–10 kcal mol−1) are very difficult to overcome. A very important “side product” of our procedure is that in case of a reasonable coincidence of experimental and theoretical spectra, knowledge of the dominantly contributing conformers under the measurement conditions is obtained.
Herein, we did not comprehensively evaluate the performance of our method across large parts of chemistry but simply want to show some key examples demonstrating versatile applicability. Experimental spectra, which are shown with negative intensity in the plots for better visual comparison, were taken from various sources25 and were typically recorded in CDCl3 as the solvent at 1H resonance frequencies of 300–500 MHz. The theoretical spectra employ Lorentzian line shapes for each calculated transition, with a full width at half maximum of 0.8–1.5 Hz depending on the quality of the experimental data. Conformers with a computed population of >4 % at T=298 K were taken into account, and exchangeable protons (OH, COOH) were excluded from the calculations.
As an introductory example to illustrate the above‐described challenges, we considered the amino acid valine. According to the conformational analysis, only two conformers of the zwitterionic form are populated at 298 K in H2O (68 and 32 % weight, respectively). Their individual spectra are shown in Figure 2 along with the one referring to the proper J/δ CRE average and the spectrum of a single rotamer (conformer 1). The plot includes the result of the simulation obtained by “NMR predict” and the experimental spectrum measured in D2O/buffer (where the zwitterionic form is prevalent according to pK a estimates).
Figure 2.
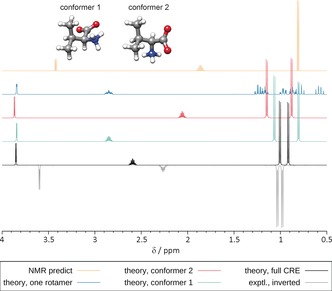
Experimental and calculated 1H NMR spectra of valine (500 MHz, D2O).
It is clearly seen that only the proper CRE average yields a simulated spectrum that is in good agreement with experiment while the single rotamer spectrum is totally off and contains too many signals. The non‐equivalence of the two methyl groups that is due to the neighboring chiral center (two doublets) is correctly reproduced by our approach (but not in the simulation according to www.nmrdb.org). Notable are the substantially different chemical shifts of the two conformers, yielding a better agreement with the experiment when averaged.
As a textbook example for a stereochemically interesting transition‐metal complex, we considered the structure of Cp2TiS5, which is reminiscent of cyclohexane. In the equilibrium geometry, the S5 unit is closer to one Cp ring than to the other. This creates two inequivalent rings, which furthermore have five inequivalent protons each. Hence, calculation of a single rotamer yields ten separated proton signals (two superimposed on each other) with the complex multiplet structures shown in the upper part of Figure 3.
Figure 3.
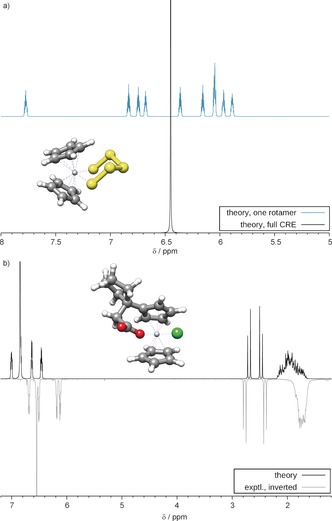
a) Computed 1H NMR spectra of Cp2TiS5 (400 MHz, CDCl3). Top: spectrum for one rotamer, bottom: CRE‐averaged spectrum, showing a singlet as observed experimentally at elevated temperatures (T c=361 K26). b) Comparison of experimental27 and theoretical 1H NMR spectra (300 MHz, CDCl3) of a substituted titanocene complex.
Owing to the generality of the GFN‐xTB method, the CRE was properly generated also for this relatively complicated case where S5 inversion as well as Cp rotation take place, and all rotamers were obtained even though both processes are not simple single bond rotations. The resulting spectrum obtained for 10 protons with the same chemical shift (singlet) is in full agreement with the measured high‐temperature spectrum.26 Note that information about the special properties of Cp rings in metallocenes (very low rotational barrier) had not been entered in the computations by any means. Figure 3 b contains an example of a substituted titanocene27 in which only one Cp ring can rotate while the other, restricted one contains further flexible groups. This case is also challenging for any CRE‐generating method because a certain inherent rigidity is required such that the observed inequivalence of the CH2 signals (two doublets) is retained. As can be seen, the simulated spectrum from the average over five conformers fits well to the experimental one even in subtle details.
As an example for a large spin system with many overlapping multiplets, which is often observed for natural products, we discuss the spectrum of adrenosterone. Only one conformer is significantly populated so that the observed errors can be entirely attributed to the calculated NMR parameters (and indirectly to the effect of the DFT structure and the treatment of solvation). The system contains 24 protons, which were grouped into eight fragments with 2 to 14 spins (including buffer spins) with our default settings. As shown in the Supporting Information, changing the maximum number of spins per fragment in the range of 10 to 14 results in an insignificant loss of accuracy, indicating the reliability of our spin‐fragmentation procedure also for complex couplings. Although the match between theory and experiment is not perfect mainly owing to errors of 0.1–0.2 ppm in relative shifts, the signals could be easily assigned. Again, the “NMR predict” result is much worse than the fully QM‐computed spectrum (Figure 4). As shown in the Supporting Information, the quality of our treatment is sufficient to distinguish diastereomers (inverted methyl groups), which is important in practice.
Figure 4.
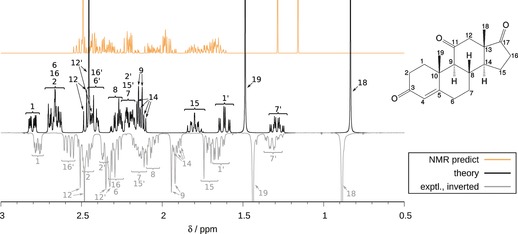
Experimental and calculated 1H NMR spectra of adrenosterone (500 MHz, CDCl3), including a mapping of experimental and theoretical multiplets based on the experimental assignment.25
Vitamin D2 (ergocalciferol) is a large, flexible molecule (73 atoms, 44 protons) and requires an extensive conformational analysis owing to a high density of structures (91 GFN‐xTB minima within a 3 kcal mol−1 energy window). After DFT refinement, there still remained six conformers within our 4 % population threshold (ranging from 6 to 44 %). The observed very good agreement between theory and experiment (Figure 5 a), enabling the direct assignment of even complex multiplet patterns, was very encouraging. Furthermore, it demonstrates the high accuracy of the computed free conformational energies, which was estimated to be on the order of ±0.2–0.3 kcal mol−1 for weakly polar systems. The 14 fragment spectrum calculation for 44 nuclei (corresponding to about 1013 spin‐product functions) took a few minutes of computation time, while the DFT calculations for all conformers including the NMR parameters ran overnight on a quad‐core laptop.
Figure 5.
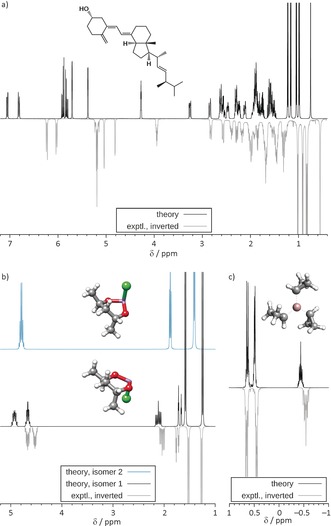
Experimental and calculated 1H NMR spectra of a) vitamin D2 (500 MHz, CDCl3); b) 2‐chloroform‐trans‐4,6‐dimethyl‐1,3,2‐dioxarsenane (300 MHz, in CS2, derived from peak list); and c) tricyclopropylgallium (300 MHz, in benzene, derived from peak list).
Figure 5 b contains an example of a conceivable high‐barrier inversion process at an arsenic atom leading to isomers with spectra that are just to be added. As can be seen from the comparison of both calculated spectra, only the lower‐energy isomer 1 (preferred by 11.3 kcal mol−1 and consisting of two conformers with populations of 7 and 93 %) fits almost perfectly to the experiment, yielding two inequivalent methyl group signals. Note, that the GFN‐xTB‐based CRE search procedure can handle such unusual ring systems without any problem.
As an example for an electron‐deficient main‐group system, we show spectra for tricyclopropylgallium in Figure 5 c. Here, one issue is to properly orient the three cyclopropyl groups around the metal center and to resolve their chemical equivalence. The simulation shown is based on two conformations with populations of 6 and 94 %, respectively, with the dominating species depicted in Figure 5 c. Again, the agreement between theory and experiment is excellent.
As a challenging case for any conformational search procedure, we discuss the spectrum of the macrocycle nonactin (Figure 6). The dynamic pseudo‐symmetry of the molecule (only two chemically non‐equivalent methyl signals are observed) is also a hard test for our spin‐symmetry permutation algorithm. With 116 atoms and 48 protons, this example is quite large for a QM approach but typical for many drug molecules and routinely doable with our procedure. Interestingly, only a single dominantly contributing conformer was eventually found (the 3D structure shown in the inset), indicating relatively little flexibility. The sensitivity of the simulated spectrum to the underlying CRE was demonstrated by comparison to the one resulting from the preferred GFN‐xTB conformer. As can be seen, only the simulation employing the accurately DFT‐reranked CRE agrees very well with the experiment, while the high‐energy conformer spectrum (about 2.5 kcal mol−1 above the lowest at the DFT level) shows inaccurate shifts as well as wrong multiplet splittings. Further spectra (1‐chlorobutane, 4‐phenylmorpholine, methylcyclohexane, strychnine, α‐ionone, guaiol, d‐sucrose) with similarly good mutual agreement between theory and experiment are provided in the Supporting Information.
Figure 6.
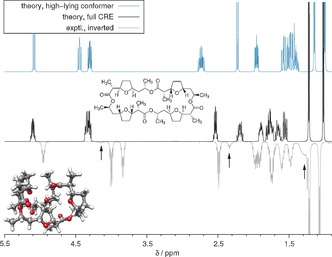
Experimental and calculated 1H NMR spectra of nonactin (500 MHz, in CDCl3). The conformer ensemble consists of three dominating species with populations of 7, 9, and 81 %. The top spectrum refers to a C 2‐symmetric conformer that does not contribute but is lowest in the GFN‐xTB ensemble. Impurities are indicated by arrows. The signals appearing at around 4.3 ppm in the simulation are an overlay of two bands found experimentally at 3.8 and 4.0 ppm, respectively.
In conclusion, we have presented a routinely applicable composite procedure for the quantum‐chemical computation of spin–spin‐coupled 1H NMR spectra for general (flexible) molecules in solution. This procedure is based on four main steps, namely conformer/rotamer ensemble generation, computation of relative free energies and NMR parameters, and solution of the (fragmented) spin Hamiltonian for the spectrum, which can be directly compared to experiment. A prerequisite for the success of this scheme (and the reason for why such a full approach had never been used before) was the automatic generation of a reasonable conformer/rotamer ensemble by the fast tight‐binding method GFN‐xTB. In this way, the nuclear permutation problem is solved, and correct thermally induced spin symmetries including subtle stereochemical details are generated. For a few organic molecules, two transition‐metal complexes, as well as two inorganic main‐group systems, very good, unprecedented agreement between the theoretical and experimental spectra was obtained.
The largest sources of error are the computed chemical shifts (DFT errors as well as neglect of zero‐point effects/vibrational averaging28), sometimes leading to an interchange of close signals. Nevertheless, these imperfections are generally small enough to allow for unambiguous spectral assignments. Furthermore, inaccurate free solvation energies can result in wrong conformer populations, which, in turn, adversely affect the quality of the average (see Ref. 29 for a recent COSMO‐RS study of conformational energies). However, the observed and partially unexpected strong dependence of the NMR parameters on details of the molecular conformation is a strong point of the approach, thereby enabling in‐depth combined theory/experiment‐based structure elucidation. A remaining (rare) problem concerns cases where the GFN‐xTB energy surface is inaccurate, leading to very large conformer spaces that have to be reevaluated by sophisticated quantum‐chemistry methods (see the example of d‐sucrose in the Supporting Information). In such cases, the likelihood that dominant conformers are missing (which must not happen) is large, and we are currently working on improving the semi‐empirical method to remedy this deficiency. The accuracy of the computed 1H NMR spin–spin couplings, even with including only the Fermi contact term, was found to be sufficient, which is in agreement with previous observations.
The shown examples demonstrate the potential of the approach, which should already be applicable to systems with up to 100–150 atoms. By improving the underlying quantum chemistry (better GFN‐xTB method, double‐hybrid functional based shifts), systematically improved theoretical spectra are to be expected, which cannot be generated with existing empirical models. Easy‐to‐use computer codes for all calculation steps in Figure 1 can be obtained from the corresponding author upon request.18 Another research direction is the application of the newly developed conformer generation algorithm to problems of circular dichroism as well as for the computation of molecular entropies. Although similar information can also be obtained experimentally by 2D NMR spectroscopy, the present work may pave the way for complementary quantum‐chemistry‐assisted NMR studies of natural products, drug molecules, or even small proteins to reveal subtle conformational details.
Conflict of interest
The authors declare no conflict of interest.
Supporting information
As a service to our authors and readers, this journal provides supporting information supplied by the authors. Such materials are peer reviewed and may be re‐organized for online delivery, but are not copy‐edited or typeset. Technical support issues arising from supporting information (other than missing files) should be addressed to the authors.
Supplementary
Acknowledgements
This work was supported by the German Research Foundation (DFG) through a Leibniz prize to S.G. We thank S. Nozinovic for help with the experimental spectra, E. Caldeweyher, F. Bohle, and M. Bursch for initial tests of parts of the computational modules, and Dr. A. Goeller (Bayer AG) for discussions and providing a “real‐life” conformational benchmark. S.G. thanks Prof. S. Peyerimhoff and Prof. H. Dreeskamp for helpful comments and longstanding support of this work.
S. Grimme, C. Bannwarth, S. Dohm, A. Hansen, J. Pisarek, P. Pracht, J. Seibert, F. Neese, Angew. Chem. Int. Ed. 2017, 56, 14763.
References
- 1. Pople J. A., Schneider W. G., Bernstein H. J., High-Resolution Nuclear Magnetic Resonance, McGraw-Hill, New York, 1959. [Google Scholar]
- 2. Günther H., NMR Spectroscopy—Basic Principles, Concepts and Applications in Chemistry , 3rd ed., Wiley-VCH, Weinheim, 2013. [Google Scholar]
- 3. Helgaker T., Jaszunski M., Ruud K., Chem. Rev. 1999, 99, 293–352; [DOI] [PubMed] [Google Scholar]; Helgaker T., Jaszunski M., Pecul M., Prog. Nucl. Magn. Reson. Spectrosc. 2008, 53, 249–268; [Google Scholar]; Mühl M., van Mourik T., WIREs Comput. Mol. Sci. 2011, 1, 634–647; [Google Scholar]; Lodewyk M. W., Siebert M. R., Tantillo D. J., Chem. Rev. 2012, 112, 1839–1862. [DOI] [PubMed] [Google Scholar]
- 4. Xin D., Sader C. A., Chaudhary O., Jones P.-J., Wagner K., Tautermann C. S., Yang Z., Busacca C. A., Saraceno R. A., Fandrick K. R., Gonnella N. C., Horspool K., Hansen G., Senanayake C. H., J. Org. Chem. 2017, 82, 5135–5145; [DOI] [PubMed] [Google Scholar]; Kutateladze A. G., Mukhina O. A., J. Org. Chem. 2015, 80, 5218–5225. [DOI] [PubMed] [Google Scholar]
- 5. Bagno A., Chem. Eur. J. 2001, 7, 1652–1661. [DOI] [PubMed] [Google Scholar]
- 6. Teale A. M., Lutnas O. B., Helgaker T., Tozer D. J., Gauss J., J. Chem. Phys. 2013, 138, 024111. [DOI] [PubMed] [Google Scholar]
- 7. Flaig D., Maurer M., Hanni M., Braunger K., Kick L., Thubauville M., Ochsenfeld C., J. Chem. Theory Comput. 2014, 10, 572–578. [DOI] [PubMed] [Google Scholar]
- 8. Benassi E., J. Comput. Chem. 2017, 38, 87–92. [DOI] [PubMed] [Google Scholar]
- 9. Abraham R., Mobli M., Modelling 1H-NMR Spectra of Organic Compounds: Theory, Applications and NMR Prediction Software, Wiley, Chichester, 2008. [Google Scholar]
- 10. Willoughby P. H., Jansma M. J., Hoye T. R., Nat. Protoc. 2014, 9, 643–660. [DOI] [PubMed] [Google Scholar]
- 11. Castillo A. M., Patiny L., Wist J., J. Magn. Reson. 2011, 209, 123–130. [DOI] [PubMed] [Google Scholar]
- 12. Adamo C., Barone V., J. Chem. Phys. 1999, 110, 6158–6170; [Google Scholar]; Jensen F., Theor. Chem. Acc. 2010, 126, 371; [Google Scholar]; Jensen F., J. Chem. Theory Comput. 2008, 4, 719; [DOI] [PubMed] [Google Scholar]; Helgaker T., Jaszunski M., Swider P., J. Org. Chem. 2016, 81, 11496–11500. [DOI] [PubMed] [Google Scholar]
- 13. Kozuch S., Gruzman D., Martin J. M. L., J. Phys. Chem. C 2010, 114, 20801–20808; [Google Scholar]; Grimme S., Brandenburg J. G., Bannwarth C., Hansen A., J. Chem. Phys. 2015, 143, 054107; [DOI] [PubMed] [Google Scholar]; Klamt A., Schüürmann G., J. Chem. Soc. Perkin Trans. 2 1993, 799–805; [Google Scholar]; Eckert F., Klamt A., AiChE J. 2002, 48, 369; [Google Scholar]; Sinnecker S., Rajendran A., Klamt A., Diedenhofen M., Neese F., J. Phys. Chem. A 2006, 110, 2235–2245; [DOI] [PubMed] [Google Scholar]; Weigend F., Ahlrichs R., Phys. Chem. Chem. Phys. 2005, 7, 3297–3305. [DOI] [PubMed] [Google Scholar]
- 14.F. Neese, ORCA—An Ab Initio, DFT and Semiempirical electronic structure package, Ver. 4.0.1, Max Planck Institute for Chemical Energy Conversion, Mülheim, Germany, 2017;; Neese F., WIREs Comput. Mol. Sci. 2012, 2, 73–78. [Google Scholar]
- 15. TURBOMOLE 7.2, Universität Karlsruhe and Forschungszentrum Karlsruhe GmbH, Karlsruhe, Germany, 2017, http://www.turbomole.com.
- 16.IUPAC Gold Book, see http://goldbook.iupac.org/html/C/C01262.html and http://goldbook.iupac.org/html/R/R05407.html.
- 17. Grimme S., Bannwarth C., Shushkov P., J. Chem. Theory Comput. 2017, 13, 1989–2009. [DOI] [PubMed] [Google Scholar]
- 18.S. Grimme, xtb, a tight-binding quantum chemistry code for large molecules, University of Bonn, 2017. The program and additional codes for the conformational search and the computation of NMR spectra (anmr) can be obtained for academic use upon request (xtb@thch.uni-bonn.de).
- 19. Ásgeirsson V., Bauer C. A., Grimme S., Chem. Sci. 2017, 8, 4879–4895; [DOI] [PMC free article] [PubMed] [Google Scholar]; P. Pracht, C. A. Bauer, S. Grimme, J. Comput. Chem 2017, DOI: https://doi.org/10.1002/jcc.24922; [DOI] [PubMed]; M. Bursch, S. Grimme, Inorg. Chem 2017, DOI: https://doi.org/10.1021/acs.inorgchem.7b01950; [DOI] [PubMed]; Ye K.-Y., Bursch M., Qu Z.-W., Daniliuc C. G., Grimme S., Kehr G., Erker G., Chem. Commun. 2017, 53, 633–635. [DOI] [PubMed] [Google Scholar]
- 20. Kolossváry I., Guida W. C., J. Am. Chem. Soc. 1996, 118, 5011–5019; [Google Scholar]; Kamachi T., Yoshizawa K., J. Chem. Inf. Model. 2016, 56, 347–353; [DOI] [PubMed] [Google Scholar]; Tsujishita H., Hirono S., J. Comput.-Aided Mol. Des. 1997, 11, 305–315; [DOI] [PubMed] [Google Scholar]; Shim J., A. D. MacKerell, Jr. , MedChemComm 2011, 2, 356–370; [DOI] [PMC free article] [PubMed] [Google Scholar]; Jones G., Willett P., Glen R. C., J. Comput.-Aided Mol. Des. 1995, 9, 532–549; [DOI] [PubMed] [Google Scholar]; Vainio M. J., Johnson M. S., J. Chem. Inf. Model. 2007, 47, 2462–2474. [DOI] [PubMed] [Google Scholar]
- 21. Pescitelli G., Di Bari L., Berova N., Chem. Soc. Rev. 2011, 40, 4603–4625. [DOI] [PubMed] [Google Scholar]
- 22.“NMR Parameters of Transition Metal Complexes”: Kaupp M., Bühl M. in Computational Inorganic and Bioinorganic Chemistry (in Encyclopedia of Inorganic Chemistry) (Eds.: E. Solomon, R. B. King, R. A. Scott), Wiley, Chichester, 2009, pp. 91–108. [Google Scholar]
- 23. Kwan E. E., Liu R. Y., J. Chem. Theory Comput. 2015, 11, 5083–5089. [DOI] [PubMed] [Google Scholar]
- 24. Dracinsky M., Möller H. M., Exner T. E., J. Chem. Theory Comput. 2013, 9, 3806–3815. [DOI] [PubMed] [Google Scholar]
- 25.SDBSWeb, http://sdbs.db.aist.go.jp (National Institute of Advanced Industrial Science and Technology). Data are available as peak lists and are converted into spectra as for the theoretical data with the same line width. This is indicated by adding the term “derived from peak list” in the text.; Biological Magnetic Resonance Data Bank, http://www.bmrb.wisc.edu/metabolomics; S. Nozinovic, NMR laboratory of the chemical institutes, University of Bonn.
- 26. Shaver A., McCall J. M., Organometallics 1984, 3, 1823–1829. [Google Scholar]
- 27. Gansäuer A., Winkler I., Worgull D., Franke D., Lauterbach T., Okkel A., Nieger M., Organometallics 2008, 27, 5699–5707. [Google Scholar]
- 28. Ruud K., Astrand P.-O., Taylor P. R., J. Am. Chem. Soc. 2001, 123, 4826–4833. [DOI] [PubMed] [Google Scholar]
- 29. Pung A., Leito I., J. Phys. Chem. A 2017, 121, 6823–6829. Note that only low-level, non-dispersion-corrected DFT neglecting RRHO contributions was used in this study, which may partially explain the observed errors in the computed conformational populations.28820591 [Google Scholar]
- 30.
- 30a. http://www.acdlabs.com;
- 30b. http://www.nmrdb.org.
Associated Data
This section collects any data citations, data availability statements, or supplementary materials included in this article.
Supplementary Materials
As a service to our authors and readers, this journal provides supporting information supplied by the authors. Such materials are peer reviewed and may be re‐organized for online delivery, but are not copy‐edited or typeset. Technical support issues arising from supporting information (other than missing files) should be addressed to the authors.
Supplementary