

Abstract
Aims
To investigate the efficacy and safety of alirocumab in participants with type 2 (T2D) or type 1 diabetes (T1D) treated with insulin who have elevated LDL cholesterol levels despite maximally tolerated statin therapy.
Methods
Participants at high cardiovascular risk with T2D (n = 441) or T1D (n = 76) and LDL cholesterol levels ≥1.8 mmol/L (≥70 mg/dL) were randomized 2:1 to alirocumab:placebo administered subcutaneously every 2 weeks, for 24 weeks' double‐blind treatment. Alirocumab‐treated participants received 75 mg every 2 weeks, with blinded dose increase to 150 mg every 2 weeks at week 12 if week 8 LDL cholesterol levels were ≥1.8 mmol/L. Primary endpoints were percentage change in calculated LDL cholesterol from baseline to week 24, and safety assessments.
Results
Alirocumab reduced LDL cholesterol from baseline to week 24 by a mean ± standard error of 49.0% ± 2.7% and 47.8% ± 6.5% vs placebo (both P < .0001) in participants with T2D and T1D, respectively. Significant reductions were observed in non‐HDL cholesterol (P < .0001), apolipoprotein B (P < .0001) and lipoprotein (a) (P ≤ .0039). At week 24, 76.4% and 70.2% of the alirocumab group achieved LDL cholesterol <1.8 mmol/L in the T2D and T1D populations (P < .0001), respectively. Glycated haemoglobin and fasting plasma glucose levels remained stable for the study duration. Treatment‐emergent adverse events were observed in 64.5% of alirocumab‐ vs 64.1% of placebo‐treated individuals (overall population).
Conclusions
Alirocumab produced significant LDL cholesterol reductions in participants with insulin‐treated diabetes regardless of diabetes type, and was generally well tolerated. Concomitant administration of alirocumab and insulin did not raise any safety concerns (NCT02585778).
Keywords: cardiovascular disease, clinical trial, lipid‐lowering therapy, type 1 diabetes, type 2 diabetes
1. INTRODUCTION
Dyslipidaemia is a major risk factor for macrovascular complications in both type 1 diabetes mellitus (T1D) and type 2 diabetes mellitus (T2D).1, 2 In T2D, the development of dyslipidaemia, typically characterized by elevated levels of non‐HDL cholesterol and triglycerides (TGs) and reduced levels of HDL cholesterol, is associated with insulin resistance in most cases.3, 4 By contrast, well‐controlled individuals with T1D can have a normal lipid profile, with lower TG and LDL cholesterol levels and HDL cholesterol levels in the upper normal range or even slightly elevated2, 5; however, in the presence of poor glycaemic control, the profile of dyslipidaemia in individuals with T1D may resemble that observed with T2D.4
Standard‐of‐care LDL cholesterol‐lowering by statins, and in combination with ezetimibe, has been shown to lead to significant reductions in cardiovascular events in individuals with diabetes.6, 7, 8 Current guidelines generally recommend targeting an LDL cholesterol goal of <1.8 mmol/L (<70 mg/dL), or even <1.3 mmol/L (<50 mg/dL), and/or a reduction of ≥50% from baseline in patients with T2D or T1D considered to be at high or very high cardiovascular risk.5, 9, 10 Despite such strong recommendations, a significant proportion of individuals with diabetes do not reach target LDL cholesterol levels in real‐life studies,11, 12, 13 and are therefore exposed to significant residual risk of cardiovascular events.
Alirocumab, a monoclonal antibody that binds to proprotein convertase subtilisin/kexin type 9 (PCSK9), has been shown to have similar efficacy and safety in individuals with and without diabetes in post hoc analyses.14, 15, 16 Some theoretical considerations have been raised with regard to the use of PCSK9 inhibitors in individuals with diabetes.17, 18, 19 Specifically, these include the safety of the concomitant administration of 2 injectable agents (alirocumab, a monoclonal antibody, and insulin, a biological agent). The potential for the effects of alirocumab on glycaemic control and change in antidiabetic medication use, as well as immunogenicity in individuals with T2D and T1D, also warrants further investigation.
The phase IIIb ODYSSEY DM‐INSULIN study therefore sought to characterize the efficacy and safety of alirocumab in insulin‐treated individuals with T1D or T2D at high cardiovascular risk not reaching LDL cholesterol goals, despite maximum tolerated statin therapy, with or without other lipid‐lowering therapies (LLTs).
2. MATERIALS AND METHODS
2.1. Study design
ODYSSEY DM‐INSULIN was a phase IIIb, randomized, double‐blind, placebo‐controlled, parallel‐group, multicentre trial, conducted at 103 sites in 10 countries (Austria, Belgium, France, Germany, Italy, the Netherlands, Spain, Switzerland, the UK, and the USA) and designed to evaluate the efficacy and safety of alirocumab in insulin‐treated people with hypercholesterolaemia and at high cardiovascular risk (a complete list of study sites and investigators is available in the Supporting Information, Text S1). Trial design and rationale have been published previously.20
The study was conducted in accordance with the Declaration of Helsinki and the International Conference on Harmonization Guidelines for Good Clinical Practice. The institutional review board or independent ethics committee at each study centre approved the study protocol, and written informed consent was obtained from each participant. The trial was registered with clinicaltrials.gov (Clinical trial reg. no. NCT02585778).
2.2. Study population
The study population comprised people with insulin‐treated T2D or T1D and established atherosclerotic cardiovascular disease and/or at least 1 additional cardiovascular risk factor, who had LDL cholesterol levels ≥1.8 mmol/L (≥70 mg/dL) despite stable maximally tolerated doses of statin with or without other LLTs. Individuals with statin intolerance (therefore not taking statins) were also eligible for study enrolment. Detailed inclusion and exclusion criteria are available in the Supporting Information, Text S2.
2.3. Study procedures
Briefly, the study consisted of a screening period of up to 3 weeks and a double‐blind treatment period of 24 weeks, followed by a safety observation period of 8 weeks. Participants were on a stable diet for glucose and lipid management, and received treatment for diabetes in accordance with local/regional standards of care.
Eligible participants were randomized to alirocumab or placebo (2:1, respectively), administered subcutaneously as a 1‐mL solution every 2 weeks via a prefilled pen device, with stratification by diabetes type. Alirocumab was administered at a starting dose of 75 mg every 2 weeks, with blinded dose increase to 150 mg every 2 weeks (also 1 mL) at week 12 if week 8 LDL cholesterol levels were ≥1.8 mmol/L (≥70 mg/dL). Statins and other LLTs remained stable throughout the entire duration of the study.
2.4. Endpoints and assessments
The primary efficacy endpoint was the percent change in calculated LDL cholesterol from baseline to week 24. Primary safety endpoints were assessed (up to week 32) through treatment‐emergent adverse event (TEAE) reports, laboratory data, product complaints, and vital signs (including height, weight, blood pressure and heart rate). Adverse events (AEs) of special interest, prespecified in the study protocol, are detailed in the Supporting Information, Text S3. Treatment acceptability was assessed in participants who self‐injected, using a 22‐item validated patient‐reported Injection‐Treatment Acceptance Questionnaire (I‐TAQ).21 Anti‐alirocumab antibodies were measured at the time of randomization and at weeks 12 and 24.22 Persistent antidrug antibodies were defined as at least 2 consecutive post‐baseline samples with positive antidrug antibodies separated by at least a 12‐week period. Neutralizing antidrug antibodies are defined as those that inhibit labelled PCSK9:alirocumab binding in an in vitro immunosorbent assay; however, this does not necessarily translate to a clinical effect.22 A complete list of all endpoints and assessments, as well as further details on study methods, is given in the Supporting Information, Table S1 and Text S3.
2.5. Statistical analysis
The primary efficacy endpoint was evaluated in the intention‐to‐treat population; missing data were accounted for using a mixed effects model with a repeated measures approach,23, 24 using all available post‐baseline data within the analysis windows (weeks 8‐24). Further details on the determination of sample size and statistical analysis of efficacy and safety endpoints are given in the Supporting Information, Text S3.
3. RESULTS
3.1. Participants
In total, 441 participants with T2D and 76 with T1D were randomized 2:1 to receive alirocumab or placebo; of these, 469 (90.7%) completed the study on study treatment (Figure 1).
Figure 1.
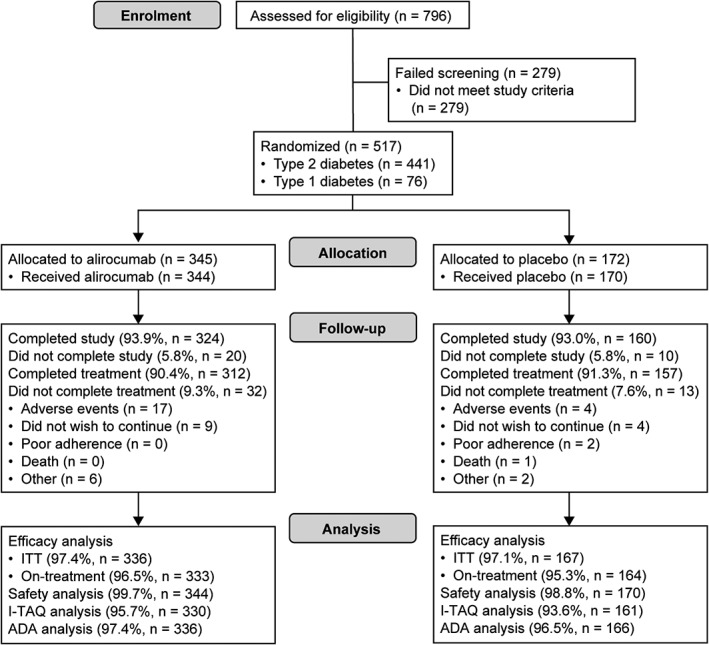
Participant flow diagram. ADA, antidrug antibody; ITT, intention‐to‐treat
Baseline characteristics were generally well balanced between the treatment groups for both the T2D and T1D populations (Table 1). For those with T2D, imbalances in the alirocumab group compared with the placebo group included a higher proportion of participants receiving ezetimibe (15.3% vs 6.8%) and a higher proportion receiving high‐intensity statin (39.2% vs 27.4%). For those with T1D, imbalances in the alirocumab group compared with the placebo group included a higher proportion of participants receiving metformin in addition to insulin (15.7% vs 0%) and a lower proportion of men (56.9% vs 68.0%); in addition, mean calculated LDL cholesterol was higher in the alirocumab group compared with the placebo group (3.3 vs 2.9 mmol/L). The mean duration of study drug exposure was 23 weeks among those included in the safety analysis (344 participants in the alirocumab group and 170 participants in the placebo group; Figure 1). Further baseline characteristics are detailed in Table S2, Supporting Information. In addition, the reasons for taking a lower statin dose than the maximum for participants on statin therapy, and the reasons for not taking statin for those who are statin‐intolerant, are given in Table S3, Supporting Information. Overall, only 22.6% of participants randomized to alirocumab required a dose increase from 75 to 150 mg every 2 weeks from week 12; this included 20.2% of participants with T2D and 36.7% of those with T1D.
Table 1.
Baseline characteristics (randomized population)
| T2D | T1D | |||
|---|---|---|---|---|
| Alirocumab (n = 294) |
Placebo (n = 147) |
Alirocumab (n = 51) |
Placebo (n = 25) |
|
| Mean (s.d.) age, years | 63.9 (8.9) | 64.0 (9.4) | 54.9 (10.1) | 58.5 (7.8) |
| Age group, n (%) | ||||
| <65 years | 143 (48.6) | 73 (49.7) | 42 (82.4) | 19 (76.0) |
| ≥65 to <75 years | 126 (42.9) | 55 (37.4) | 8 (15.7) | 6 (24.0) |
| ≥75 years | 25 (8.5) | 19 (12.9) | 1 (2.0) | 0 |
| Male, n (%) | 161 (54.8) | 78 (53.1) | 29 (56.9) | 17 (68.0) |
| Race, n (%) | ||||
| White | 259 (88.1) | 135 (91.8) | 50 (98.0) | 24 (96.0) |
| Black | 27 (9.2) | 7 (4.8) | 1 (2.0) | 0 |
| Asian/Oriental | 7 (2.4) | 3 (2.0) | 0 | 0 |
| Other | 1 (0.3) | 2 (1.4) | 0 | 1 (4.0) |
| Ethnicity, n (%) | ||||
| Hispanic or Latino | 13 (4.4) | 8 (5.4) | 1 (2.0) | 0 |
| Not Hispanic or Latino | 280 (95.2) | 138 (93.9) | 50 (98.0) | 25 (100) |
| Not reported/unknown | 1 (0.3) | 1 (0.7) | 0 | 0 |
| Mean (s.d.) BMI, kg/m2 | 32.6 (4.8) | 32.7 (5.5) | 30.6 (6.3) | 28.7 (4.8) |
| Mean (s.d.) HbA1c, % | 7.5 (1.0) | 7.5 (1.0) | 7.8 (1.0) | 7.7 (0.8) |
| Mean (s.d.) HbA1c, mmol/mol | 58.6 (10.5) | 58.9 (11.1) | 62.2 (10.3) | 60.4 (8.5) |
| HbA1c <7% (<53 mmol/mol), n (%) | 94 (32.0) | 47 (32.0) | 10 (19.6) | 4 (16.0) |
| Mean (s.d.) FPG | ||||
| mmol/L | 8.5 (2.8) | 8.5 (2.9) | 9.6 (3.9) | 9.2 (4.2) |
| mg/dL | 153.6 (50.3) | 152.6 (51.8) | 172.8 (69.7) | 166.5 (75.6) |
| ASCVD, n (%) | 119 (40.5) | 58 (39.5) | 11 (21.6) | 5 (20.0) |
| CHDa | 102 (34.7) | 51 (34.7) | 9 (17.6) | 3 (12.0) |
| No ASCVD + additional CV risk factors, n (%) | 175 (59.5) | 89 (60.5) | 40 (78.4) | 20 (80.0) |
| Micro‐/macro‐albuminuria, CKD and/or retinopathy | 73 (41.7) | 31 (34.8) | 22 (55.0) | 12 (60.0) |
| ≥3 additional CV risk factorsb | 102 (58.3) | 45 (50.6) | 17 (42.5) | 10 (50.0) |
| Median (Q1:Q3) duration of diabetes, years | 15.4 (10.9:21.5) | 16.5 (12.0:21.5) | 34.6 (22.3:43.6) | 36.6 (27.6:43.4) |
| Median (Q1:Q3) duration of insulin use, years | 5.6 (2.8:11.3) | 6.6 (2.9:12.3) | 34.6 (21.6:42.6) | 36.6 (27.6:43.4) |
| Current smoker, n (%) | 38 (12.9) | 15 (10.2) | 10 (19.6) | 3 (12.0) |
| Mean (s.d.) systolic blood pressure, mm Hg | 131.7 (16.1) | 132.4 (15.5) | 129.9 (14.5) | 126.5 (15.5) |
| Mean (s.d.) diastolic blood pressure, mm Hg | 76.0 (9.2) | 75.1 (8.2) | 74.7 (9.8) | 69.5 (8.5) |
| Mean (s.d.) eGFR, mL/min/1.73 m2 | 74.0 (24.3) | 76.4 (24.8) | 83.9 (23.9) | 74.6 (18.3) |
| CKDc, n (%) | 62 (21.1) | 25 (17.0) | 6 (11.8) | 4 (16.0) |
| Baseline lipids | ||||
| Mean (s.d.) calculated LDL cholesterol | ||||
| mmol/L | 2.9 (0.9) | 2.8 (1.0) | 3.3 (1.5) | 2.9 (0.8) |
| mg/dL | 110.8 (36.5) | 109.6 (39.1) | 126.4 (58.2) | 110.2 (31.2) |
| Mean (s.d.) measured LDL cholesterol | ||||
| mmol/L | 2.9 (0.9) | 2.9 (1.0) | 3.3 (1.5) | 2.8 (0.8) |
| mg/dL | 112.1 (34.3) | 110.5 (37.4) | 127.7 (58.1) | 109.8 (31.4) |
| Mean (s.d.) ApoB, mg/dL | 97.0 (24.7) | 96.2 (26.8) | 99.7 (35.6) | 87.0 (21.0) |
| Mean (s.d.) non‐HDL cholesterol | ||||
| mmol/L | 3.7 (1.1) | 3.8 (1.3) | 3.9 (1.6) | 3.4 (0.9) |
| mg/dL | 144.7 (42.6) | 144.9 (48.5) | 150.2 (62.9) | 130.7 (34.2) |
| Total cholesterol | ||||
| mmol/L | 4.9 (1.1) | 4.9 (1.2) | 5.3 (1.7) | 5.1 (0.9) |
| mg/dL | 190.2 (42.4) | 189.9 (47.6) | 205.1 (65.1) | 195.2 (36.0) |
| Median (Q1:Q3) TGs | ||||
| mmol/L | 1.7 (1.2:2.3) | 1.7 (1.2:2.6) | 1.2 (0.9:1.5) | 1.1 (0.8:1.5) |
| mg/dL | 146.0 (108.0:205.0) | 153.0 (105.0:231.0) | 105.0 (79.0:136.0) | 99.0 (66.0:130.0) |
| Mean (s.d.) HDL cholesterol | ||||
| mmol/L | 1.2 (0.3) | 1.2 (0.3) | 1.4 (0.4) | 1.7 (0.5) |
| mg/dL | 45.5 (12.5) | 44.9 (13.2) | 54.9 (13.7) | 64.4 (17.4) |
| Median (Q1:Q3) Lp(a), mg/dL | 16.0 (5.0:55.0) | 14.0 (5.0:38.0) | 17.0 (6.0:28.0) | 12.0 (4.0:37.0) |
| Mean (s.d.) ApoC‐III, mg/dL | 11.2 (4.5) | 11.4 (4.9) | 8.9 (3.6) | 8.8 (2.6) |
| Median (Q1:Q3) TG‐rich lipoprotein cholesterol | ||||
| mmol/L | 0.8 (0.5:1.0) | 0.7 (0.5:1.1) | 0.5 (0.4:0.7) | 0.6 (0.4:0.7) |
| mg/dL | 29.0 (21.0:40.0) | 29.0 (19.0:41.0) | 21.0 (15.0:29.0) | 21.0 (15.0:26.0) |
| Mean (s.d.) LDL particle number, nmol/L | 1355.5 (391.6) | 1373.0 (414.0) | 1383.4 (589.5) | 1104.2 (385.8) |
| Mean (s.d.) LDL particle size, nm | 20.6 (0.6) | 20.5 (0.6) | 21.0 (0.7) | 21.0 (0.5) |
| Mean (s.d.) free PCSK9, ng/mL | 251.1 (85.4) | 251.4 (87.1) | 212.1 (62.6) | 202.3 (83.0) |
| Mean (s.d.) total PCSK9, ng/mL | 532.1 (163.9) | 516.4 (156.3) | 523.6 (133.0) | 485.4 (180.1) |
| Concomitant lipid‐lowering therapy, n (%) | ||||
| Any statin | 222 (75.5) | 113 (76.9) | 36 (70.6) | 16 (64.0) |
| Statin intensityd , e | ||||
| Highf | 87 (39.2) | 31 (27.4) | 15 (41.7) | 7 (43.8) |
| Moderatef | 123 (55.4) | 77 (68.1) | 20 (55.6) | 8 (50.0) |
| Lowf | 11 (5.0) | 3 (2.7) | 1 (2.8) | 1 (6.3) |
| Statin monotherapy | 174 (59.2) | 88 (59.9) | 31 (60.8) | 12 (48.0) |
| Any other LLTs (other than statin) | 78 (26.5) | 33 (22.4) | 7 (13.7) | 7 (28.0) |
| Cholesterol absorption inhibitor (ezetimibe) | 45 (15.3) | 10 (6.8) | 2 (3.9) | 3 (12.0) |
| Statin intoleranceg, n (%) | 72 (24.5) | 33 (22.4)h | 15 (29.4) | 9 (36.0) |
| Concomitant antihyperglycaemic drugs, n (%) | ||||
| Insulin | 293 (99.7)i | 146 (99.3)i | 51 (100.0) | 25 (100.0) |
| Any other antihyperglycaemic drugs | 202 (68.7) | 110 (74.8) | 8 (15.7) | 1 (4.0) |
| Biguanides (metformin) | 172 (58.5) | 83 (56.5) | 8 (15.7) | 0 |
| Median (Q1:Q3) total daily insulin dosej | ||||
| IU | 51.5 (31.4:80.0) | 49.5 (30.0:80.0) | 62.9 (44.1:85.0) | 48.6 (32.4:69.1) |
| IU/kg | 0.6 (0.4:0.9) | 0.6 (0.3:0.8) | 0.7 (0.6:0.9) | 0.5 (0.5:0.7) |
Abbreviations: Apo‐CIII, apolipoprotein C‐III; ASCVD, atherosclerotic cardiovascular disease; BMI, body mass index; CHD, coronary heart disease; CKD, chronic kidney disease; CV, cardiovascular; eGFR, estimated glomerular filtration rate.
CHD defined as history of acute myocardial infarction, silent myocardial infarction, unstable angina, coronary revascularization procedure, or clinically significant CHD diagnosed by invasive or non‐invasive testing.
CV risk factors (in addition to diabetes and hypercholesterolaemia) included hypertension, current smoker, age ≥45 years (men) or ≥55 years (women), history of micro‐/macroalbuminuria or diabetic retinopathy, family history of premature CHD, low levels of HDL cholesterol, or documented CKD.
Defined as eGFR ≥15 to <60 mL/min/1.73 m2.
For patients who are currently taking statin.
High‐intensity statin: atorvastatin 40 to 80 mg, rosuvastatin 20 to 40 mg, or simvastatin 80 mg daily. Moderate‐intensity statin: atorvastatin 10 to 20 mg, rosuvastatin 5 to 10 mg, simvastatin 20 to 40 mg, pravastatin 40 to 80 mg, lovastatin 40 mg, fluvastatin 80 mg, or pitvastatin 2 to 4 mg daily. Low‐intensity statin: simvastatin 10 mg, pravastatin 10 to 20 mg, lovastatin 20 mg, fluvastatin 20 to 40 mg, or pitavastatin 1 mg daily. Participants receiving more than one intensity of statin were counted in the highest intensity level.
Percentage of patients receiving any statin.
Number of participants not currently taking statin who are statin‐intolerant based on medical history, as reported by investigator.
One participant was not receiving statin therapy at randomization, but not classified as statin‐intolerant based on medical history.
One participant in the alirocumab group and one participant in the placebo group were not receiving insulin at the time of randomization, and they remained without insulin treatment for the duration of the trial.
Intention‐to‐treat population.
3.2. Primary efficacy endpoint in the overall population
For the primary efficacy endpoint in the overall population, the least squares (LS) mean (standard error [s.e.]) percentage change in calculated LDL cholesterol levels from baseline to week 24 was −50.1% (1.9%) for alirocumab and −1.3% (2.4%) for placebo, with a difference between groups of −48.8% (2.5%; P < .0001).
3.3. Alirocumab efficacy in participants with T2D
For the primary efficacy endpoint in participants with T2D, the LS mean (s.e.) percentage change in calculated LDL cholesterol levels from baseline to week 24 was −48.2% (1.6%) for alirocumab and +0.8% (2.2%) for placebo, with a difference between groups of −49.0% (2.7%; P < .0001 [Table 2]). Subgroup analyses showed that the efficacy of alirocumab was similar regardless of moderate chronic kidney disease, age, duration of diabetes, baseline glycated haemoglobin (HbA1c), history of atherosclerotic cardiovascular disease, and other subgroups (Table S4, Supporting Information). LDL cholesterol reductions in the alirocumab group were consistent from weeks 8 to 24 (Figure 2). Alirocumab resulted in significant reductions from baseline to week 24 (difference vs placebo) in levels of non‐HDL cholesterol (−38.7%; P < .0001), apolipoprotein B (ApoB; −36.7%; P < .0001), total cholesterol (−27.6%; P < .0001) and lipoprotein (a) (Lp[a]; −18.4%; P < .0001), as well as a significant increase in HDL cholesterol (difference vs placebo 4.4%; P < .01 [Table 2]). At week 24, the proportion of participants achieving LDL cholesterol <1.8 mmol/L (<70 mg/dL) was 76.4% in the alirocumab group and 7.4% in the placebo group (P < .0001), and the proportion of individuals attaining LDL cholesterol of <1.3 mmol/L (<50 mg/dL) was 50.7% in the alirocumab group and 2.7% in the placebo group (P < .0001; Table S5, Supporting Information). In addition, 70.9% of the alirocumab group and 13.8% of the placebo group attained non‐HDL cholesterol <2.6 mmol/L (<100 mg/dL; P < .0001 [Table S5, Supporting Information]). Reductions from baseline to week 24 (difference vs placebo) in TG levels (−5.7%) were also observed, although were not significant (P = .0902 [Table 2]). Reductions (difference vs placebo) in LDL particle number (−40.2%; P < .0001) and LDL particle size (−2.5%; P < .0001) at week 24 were observed, although significance was nominal because of the hierarchical testing procedure used (Table 2). Alirocumab resulted in reductions from baseline to week 24 (difference vs placebo) in apolipoprotein C‐III (−10.0%) and TG‐rich lipoprotein cholesterol (−18.6% [Table S6, Supporting Information]). The results of other efficacy endpoints are shown in Table S6, Supporting Information.
Table 2.
Primary and selected key secondary efficacy endpoints according to treatment randomization (intention‐to‐treat analysis)
| T2D | T1D | |||||
|---|---|---|---|---|---|---|
| Alirocumab (n = 287) |
Placebo (n = 142) |
Difference vs placebo, % [95% CI], P |
Alirocumab (n = 49) |
Placebo (n = 25) |
Difference vs placebo, % [95% CI], P |
|
| Mean (s.d.) calculated LDL cholesterol | ||||||
| Baseline | ||||||
| mmol/L | 2.9 (0.9) | 2.8 (1.0) | 3.2 (1.2) | 2.9 (0.8) | ||
| mg/dL | 110.3 (35.9) | 109.5 (38.7) | 122.5 (47.8) | 110.2 (31.2) | ||
| Week 24 | ||||||
| mmol/L | 1.4 (0.9) | 2.8 (1.0) | 1.4 (0.9) | 2.6 (0.8) | ||
| mg/dL | 55.1 (33.7) | 107.3 (37.0) | 55.9 (33.5) | 101.8 (31.8) | ||
| LS mean (s.e.) primary endpoint: % change from baseline to week 24 | −48.2 (1.6) | 0.8 (2.2) | −49.0 (2.7)[−54.4 to −43.6], <.0001 | −51.8 (3.7) | −3.9 (5.3) | −47.8 (6.5)[−60.7 to −35.0], <.0001 |
| Selected key secondary efficacy endpoints | ||||||
| % change from baseline, mean (s.e.) | ||||||
| Calculated LDL cholesterol (week 12) | −48.8 (1.4) | 1.4 (2.1) | −50.2 (2.5)[−55.2 to −45.3], <.0001 | −49.4 (3.5) | −4.5 (5.0) | −44.8 (6.1)[−56.9 to −32.8], <.0001 |
| Non‐HDL cholesterol (week 24) | −37.9 (1.4) | 0.7 (2.0) | −38.7 (2.4)[−43.4 to −33.9], <.0001 | −45.9 (3.3) | −3.2 (4.8) | −42.7 (5.8)[−54.2 to −31.3], <.0001 |
| ApoB (week 24) | −33.4 (1.3) | 3.3 (1.7) | −36.7 (2.1)[−40.9 to −32.5], <.0001 | −39.4 (3.0) | −0.4 (4.3) | −39.0 (5.3)[−49.4 to −28.7], <.0001 |
| Total cholesterol (week 24) | −26.8 (1.0) | 0.8 (1.5) | −27.6 (1.8)[−31.2 to −24.1], <.0001 | −29.9 (2.5) | −0.7 (3.6) | −29.2 (4.3)[−37.8 to −20.7], <.0001 |
| Lp(a) (week 24) | −19.0 (1.6) | −0.5 (2.2) | −18.4 (2.7)[−23.7 to −13.2], <.0001 | −23.0 (3.8) | −4.3 (5.3) | −18.7 (6.5)[−31.4 to −6.0], = .0039 |
| HDL cholesterol (week 24)a | 8.1 (1.0) | 3.7 (1.4) | 4.4 (1.7)[1.1 to 7.7], <.01 | 11.2 (2.4) | 7.3 (3.5) | 3.9 (4.1)[−4.2 to 12.0], = .3434b |
| Triglycerides (week 24)a | −5.7 (2.0) | 0.0 (2.7) | −5.7 (3.4)[−12.3 to 0.9], = .0902b | −13.6 (4.7) | 1.9 (6.7) | −15.5 (8.1)[−31.4 to 0.4], = .056b |
| LDL particle numbers (week 24) | −38.3 (1.3) | 1.9 (1.9) | −40.2 (2.3)[−44.7 to −35.6], <.0001b | −44.4 (3.2) | −4.4 (4.6) | −40.0 (5.6)[−51.0 to −28.9], <.0001b |
| LDL particle size (week 24) | −2.8 (0.1) | −0.3 (0.2) | −2.5 (0.2)[−2.9 to −2.0], <.0001b | −2.3 (0.3) | 0.8 (0.5) | −3.0 (0.6)[−4.2 to −1.9], <.0001b |
Abbreviations: CI, confidence interval; ITT, intention‐to‐treat.
Hierarchical testing terminated at the endpoint triglycerides in participants with T2D and at the endpoint HDL cholesterol in participants with T1D, therefore all subsequent statistical comparisons were not considered statistically significant.
P values for descriptive purposes only.
Figure 2.
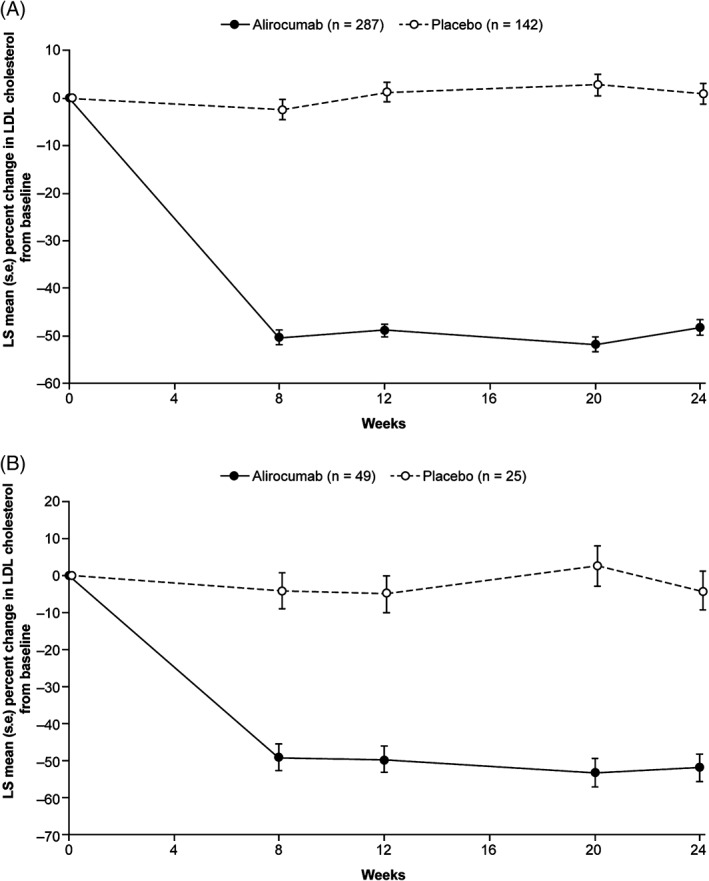
Percent change from baseline in LDL cholesterol over time per treatment randomization. A, Participants with T2D. B, Participants with T1D (intention‐to‐treat analysis)
3.4. Alirocumab efficacy in participants with T1D
For the primary efficacy endpoint in participants with T1D, the LS mean (s.e.) percentage change in LDL cholesterol concentrations from baseline to week 24 was −51.8% (3.7%) for alirocumab and −3.9% (5.3%) for placebo, with a difference between groups of −47.8% (6.5%; P < .0001 [Table 2]). Reductions in calculated LDL cholesterol over time for both alirocumab and placebo groups are shown in Figure 2. Although subgroup analyses were limited because of the small size of the T1D population, results were consistent across subgroups (Table S7, Supporting Information). Alirocumab produced significant reductions from baseline to week 24 (difference vs placebo) in levels of non‐HDL cholesterol (−42.7%), ApoB (−39.0%), total cholesterol (−29.2%) and Lp(a) (−18.7%; all P values <.0001 except for Lp[a] which was = .0039 [Table 2]). Alirocumab resulted in an increase in HDL cholesterol (difference vs placebo 3.9%), although this was not significant (P = .3434 [Table 2]). In addition, alirocumab resulted in a decrease in TG levels (difference vs placebo −15.5%, nominal P = .056). A reduction in LDL particle number (difference vs placebo) from baseline to week 24 of −40.0% was also observed (nominal P <.0001). Results of other efficacy endpoints were similar to those described for the T2D population above (Tables S5 and S6, Supporting Information).
3.5. Diabetes‐related endpoints
In the T2D population, the mean (standard deviation [s.d.]) absolute change from baseline in HbA1c at week 24 was 0.2% (0.7%) (2.0 [8.1] mmol/mol) and 0.1% (0.7%) (0.7 [7.2] mmol/mol) in the alirocumab and placebo groups, respectively. In the T1D population, mean (s.d.) absolute change from baseline in HbA1c at week 24 was 0.0% (0.6%) (−0.3 [6.6] mmol/mol) and −0.2% (0.4%) (−2.5 [4.0] mmol/mol) in the alirocumab and placebo groups, respectively. The mean (s.d.) absolute change in fasting plasma glucose (FPG) from baseline to week 24 for the alirocumab and placebo groups was 9.5 (61.8) mg/dL and 10.0 (47.0) mg/dL for the T2D population, respectively, and 9.5 (93.8) mg/dL and 14.6 (75.9) mg/dL for the T1D population. The absolute values for HbA1c and FPG over time are shown in Figures S1 and S2, Supporting Information. The total daily insulin dose and number of antihyperglycaemic drugs did not change over time in either the T2D or T1D population (Figures S3 and S4, Supporting Information).
3.6. Safety and tolerability
The proportion of participants with at least 1 TEAE was similar between the alirocumab and placebo treatment groups, both for the overall population combining T2D and T1D (64.5% vs 64.1% [Table 3]), and for the separate T2D and T1D populations (66.9% vs 66.2% and 51.0% vs 52.0%, respectively [Table S8, Supporting Information]). One death from myocardial infarction, occurring 1 month after first administration of study treatment, was reported for an individual with T2D in the placebo group. For the overall population, treatment discontinuation because of a TEAE occurred in 17 participants (4.9%) in the alirocumab group and 4 participants (2.4%) in the placebo group (Table 3). TEAEs leading to discontinuation (those with more than 1 individual per treatment group at the preferred‐term level) were (alirocumab vs placebo group): headache (2 [0.6%] vs 0), cognitive disorder (2 [0.6%] vs 0), allergic dermatitis (2 [0.6%] vs 0) and myalgia (3 [0.9%] vs 2 [1.2%]; Table S9, Supporting Information). There were no reported cases of local injection site reactions meeting the predefined AEs of special interest criteria (ie, those allergic in nature requiring consultation) in either the T2D or T1D population (Table 3 and Table S8, Supporting Information). Local injection‐site reaction TEAEs were reported in 5 participants (1.7%) in the alirocumab group vs 5 participants (3.4%) in the placebo group for the T2D population; the occurrence in the T1D population was 2 participants (3.9%) vs 3 participants (12.0%), respectively. Most of the local injection‐site reactions were mild in intensity, with only 2 occurrences (1 each in the alirocumab and placebo group) of a moderate intensity. Other predefined AEs of special interest are shown in Table 3.
Table 3.
Summary of TEAEs for overall population (safety population)
| % (n) of participantsa | Alirocumab (n = 344) | Placebo (n = 170) |
|---|---|---|
| TEAEs | ||
| Any TEAE | 64.5 (222) | 64.1 (109) |
| Treatment‐emergent SAE | 9.0 (31) | 9.4 (16) |
| TEAEs leading to death | 0 | 0.6 (1) |
| TEAEs leading to treatment discontinuation | 4.9 (17) | 2.4 (4) |
| AEs of special interest | ||
| Allergic events requiring consultation with another physician | 1.5 (5) | 2.4 (4) |
| Local injection‐site reactions that are allergic in nature and require consultation with another physician | 0 | 0 |
| Pregnancy of female participant/partner of male participant | 0 | 0 |
| Symptomatic overdose (accidental or intentional) with study treatment | 0 | 0 |
| Neurological events requiring additional examination/procedures and/or consultation with a specialist | 0.3 (1) | 0.6 (1) |
| Neurocognitive events | 1.2 (4) | 0 |
| Increase in alanine aminotransferase | 0.6 (2) | 0.6 (1) |
| TEAEs occurring in ≥2% of participants (in any group) | ||
| Bronchitis | 2.6 (9) | 0.6 (1) |
| Pneumonia | 0.6 (2) | 2.4 (4) |
| Nasopharyngitis | 4.9 (17) | 5.3 (9) |
| Upper respiratory tract infection | 0.9 (3) | 2.4 (4) |
| Urinary tract infection | 4.4 (15) | 4.1 (7) |
| Influenza | 2.3 (8) | 2.9 (5) |
| Hyperglycaemia | 0.9 (3) | 2.4 (4) |
| Hypoglycaemia | 1.7 (6) | 2.4 (4) |
| Headache | 2.9 (10) | 2.4 (4) |
| Dizziness | 2.6 (9) | 1.2 (2) |
| Hypertension | 2.9 (10) | 2.9 (5) |
| Cough | 1.5 (5) | 2.9 (5) |
| Diarrhoea | 4.4 (15) | 4.1 (7) |
| Nausea | 2.3 (8) | 2.4 (4) |
| Arthralgia | 2.9 (10) | 1.8 (3) |
| Myalgia | 4.4 (15) | 1.8 (3) |
| Musculoskeletal pain | 1.2 (4) | 2.4 (4) |
| Pain in extremity | 1.7 (6) | 2.9 (5) |
| Fatigue | 2.0 (7) | 1.8 (3) |
| Oedema peripheral | 2.0 (7) | 0.6 (1) |
| Fall | 2.0 (7) | 1.8 (3) |
Abbreviations: TEAE, treatment‐emergent adverse event; SAE, serious adverse event.
Participants may be counted in more than one category.
For the T2D population, 3.2% of alirocumab and 0% of placebo‐treated participants had treatment‐emergent persistent antidrug antibodies with a low titre; for the T1D population, 2.1% of alirocumab‐ and 0% of placebo‐treated participants had treatment‐emergent persistent antidrug antibodies with a low titre. The proportion of participants in the alirocumab group at weeks 12 and 24 with neutralizing antidrug antibodies was 2.1% and 0.7% for the T2D population, and 0% and 2% for the T1D population, respectively. No neutralizing antidrug antibodies were observed in the placebo group.
3.7. Treatment acceptability
Participant‐reported acceptability of subcutaneous injection of study treatment was high (including high acceptance of treatment‐related side effects) and showed no significant difference between treatment arms in perceived efficacy, acceptance of side effects, injection self‐efficacy (confidence in self‐injection), injection convenience, or overall acceptance for either the T2D or T1D population (Table S10, Supporting Information).
4. DISCUSSION
This was the first trial with a PCSK9 inhibitor that specifically randomized individuals with insulin‐treated diabetes. Subanalyses in individuals with diabetes have previously been reported for PCSK9 inhibitors14, 16, 25; however, conclusions of those analyses were limited because of the non‐randomized nature of the subgroups that were assessed. In addition, in previous alirocumab ODYSSEY phase III trials, only a minority of participants with diabetes were receiving insulin, and very few had T1D.20 In the present study, where 40.1% of participants with T2D also had atherosclerotic cardiovascular disease and remaining participants had additional cardiovascular risk factors, the population of this study represents a group with very high risk of future cardiovascular events,2, 26 who had uncontrolled LDL cholesterol despite receiving maximally tolerated statin.
Alirocumab was shown to be superior in reducing LDL cholesterol levels vs placebo in insulin‐treated individuals with T2D or T1D at high cardiovascular risk. The magnitude of LDL cholesterol reduction at week 24 (49.0% and 47.8% vs placebo for the T2D and T1D populations, respectively) was consistent with that seen in previous ODYSSEY phase III studies with participants on background statin therapy. For example, a pooled analysis of the overall population of 8 ODYSSEY phase III trials showed that alirocumab reduced LDL cholesterol by 48.9% (vs 19.3% reduction for ezetimibe) and 48.6% (vs 4.2% increase for placebo) from baseline to week 24.27 In addition, a subanalysis of ODYSSEY COMBO II showed that alirocumab reduced LDL cholesterol by 49.1% (vs 18.4% reduction for ezetimibe) in participants with diabetes and by 51.2% (vs 21.8% reduction for ezetimibe) for participants without diabetes.16
A pooled analysis of 6 ODYSSEY phase III trials showed that an alirocumab dose increase to 150 mg every 2 weeks at week 12 was more likely in participants with higher baseline LDL cholesterol levels; the best single predictor of dose increase was a baseline LDL cholesterol level further from the prespecified goal of LDL cholesterol <1.8 mmol/L (<70 mg/dL).28 This could explain the observation in the present study that a greater proportion of alirocumab‐treated individuals with T1D required dose increase at week 12 compared with those with T2D, as the T1D group had a higher baseline LDL cholesterol level (126.4 mg/dL [3.3 mmol/L]) compared with the T2D group (110.8 mg/dL [2.9 mmol/L]).
A moderate reduction in TGs was observed with alirocumab treatment in both the T2D and T1D populations (small reductions also seen in previous trials),27 suggesting that inhibiting extracellular PCSK9 has a minor impact, if any, in the metabolism of TGs.
As statins have been found to be associated with an increased risk of diabetes,29, 30, 31 and because of reports linking PCSK9 to glucose homeostasis,17, 18, 19, 32, 33 there is an interest in the effect of PCSK9 inhibitors on measures of glycaemic control. Consistent with recent pooled analyses of 10 ODYSSEY phase III studies34 and 14 ODYSSEY phase II and III studies,15 which showed no effect of alirocumab on glycaemia in people with or without diabetes, in the present trial, changes in HbA1c and FPG levels were minimal in individuals with either T2D or T1D receiving insulin treatment for the 24‐week duration of the trial. Importantly, the total daily insulin dose and number of other antihyperglycaemic drugs were also unchanged for the duration of the study, providing further evidence that alirocumab did not affect glycaemic control. A lack of effect on glycaemic control has also been observed with another PCSK9 inhibitor35; however, the effect of PCSK9 inhibitors on glycaemic control in studies of longer duration (>2 years) needs to be studied.
A previous study suggested that PCSK9 may have a reduced role in ApoB catabolism in those with poorly controlled T2D (HbA1c >7%); the negative correlation between plasma PCSK9 and the fractional catabolic rate of LDL‐ApoB observed in the non‐diabetic group (R = −0.61, P = .002) was only observed in the T2D population in those with HbA1c ≤7% (R = −0.70, P = .08).36 In the present study, subgroup analyses showed an apparent reduction in placebo‐corrected LDL cholesterol percentage reduction in the T2D population with baseline HbA1c ≥9% vs lower HbA1c baseline values (Table S4, Supporting Information); however, this was attributable to an LDL cholesterol reduction of 13.2% observed in the placebo group with HbA1c ≥9%, whereas LDL cholesterol reductions were similar across baseline HbA1c levels in the alirocumab group.
In the present study, alirocumab was well tolerated, with similar proportions of participants with at least 1 TEAE in the alirocumab and placebo groups. In previous alirocumab trials, the frequency of injection‐site reactions in the overall patient population was generally found to be higher with alirocumab vs placebo or ezetimibe controls.37 In the present trial, in participants with T2D or T1D, the overall incidence of local injection‐site reactions was low relative to previous studies, with no greater incidence in the alirocumab group relative to placebo; these reactions were generally mild in nature. Previous subgroup analyses have shown that individuals with diabetes tend to have fewer injection‐site reactions than those without diabetes.15, 16 A higher proportion of participants discontinued treatment with alirocumab because of an AE compared with the placebo group; however, no pattern emerged when analysed at the preferred‐term level. The incidence of neurocognitive AEs (1.4% of alirocumab‐treated participants only in the T2D population) was similar to that shown in results from a pooled analysis of 14 phase II and III trials, which reported an incidence of 0.9% in the alirocumab group of the placebo‐controlled pool.37 The frequencies of treatment‐emergent persistent antidrug antibodies and neutralizing antibodies were similar to those reported previously from a pooled analysis of 10 phase III alirocumab trials, which demonstrated LDL cholesterol reductions that were maintained for the duration of the trials, regardless of antidrug antibody status.22
Uniquely for a PCSK9 inhibitor, we assessed participant acceptance of study drug injections using the validated I‐TAQ survey.21 Results of this survey indicated that participants were confident in their ability to inject themselves, that there were high levels of acceptance for the injectable study drug, and that there was no difference between treatment arms in the perceived frequency of side effects. These results are consistent with an early study investigating patient perspectives of possible injection devices for alirocumab administration.38
Limitations of this analysis include the relatively short treatment period for the assessment of potential interactions between alirocumab and insulin treatment and of any potential long‐term effects of alirocumab on glycaemic control. The proportion of participants with statin intolerance was higher than generally reported. This, although not a limitation per se, may be a consequence of inclusion criteria detailed above favouring preferential selection of participants with suboptimal statin use, and thereby statin intolerance.
In summary, the present study showed the feasibility of concomitant therapy with alirocumab and insulin, and showed that alirocumab produced significant LDL cholesterol reductions in individuals with both T2D and T1D receiving insulin treatment who were at high cardiovascular risk with hypercholesterolaemia, with no apparent effect on overall safety or measures of glycaemic control. Clinical cardiovascular events with alirocumab are assessed in the ongoing ODYSSEY OUTCOMES study (NCT01663402; ~18 000 individuals) that includes a subgroup analysis in the significant number of the trial population with diabetes.39 The effect of another PCSK9 inhibitor (evolocumab) was investigated in the FOURIER clinical outcomes study; a prespecified subanalysis in participants with diabetes has been recently reported.40
ORCID
Lawrence A. Leiter http://orcid.org/0000-0002-1040-6229
Stefano Del Prato http://orcid.org/0000-0002-5388-0270
Robert R. Henry http://orcid.org/0000-0002-4821-0117
Supporting information
Text S1. Study investigators and steering committee.
Text S2. Full inclusion and exclusion criteria.
Text S3. Methods.
Table S1. ODYSSEY DM‐INSULIN study endpoints.
Table S2. Further baseline characteristics (randomized population).
Table S3. Medical history of statin use for the type 2 and type 1 diabetes populations.
Table S4. Difference in percentage change from baseline to week 24 in calculated LDL‐C (alirocumab versus placebo) according to baseline subgroup for participants with type 2 diabetes.
Table S5. Proportion of participants attaining pre‐defined lipid goals at week 24 (on‐treatment population).
Table S6. Selected key secondary efficacy endpoints and other efficacy endpoints according to treatment randomization.
Table S7. Difference in percentage change from baseline to week 24 in calculated LDL‐C (alirocumab versus placebo) according to baseline subgroup for participants with type 1 diabetes.
Table S8. TEAEs and AEs of special interest for the type 2 and type 1 diabetes populations (safety population).
Table S9. TEAEs leading to treatment discontinuation for the overall population.
Table S10. Summary of I‐TAQ.
Figure S1. HbA1c levels over time per treatment group.
Figure S2. FPG levels over time per treatment group.
Figure S3. Total daily insulin dose over time per treatment group.
Figure S4. Number of antihyperglycaemic drugs over time per treatment group.
ACKNOWLEDGMENTS
The authors would like to thank the participants, their families, and all investigators involved in this study. The following people from the study sponsors reviewed and provided editorial comments on the manuscript: Lisa Aurand, Ameen Ghannam, Corinne Hanotin and Michael Howard (Sanofi), and Carol Hudson, Robert Pordy and Robert Sanchez (Regeneron Pharmaceuticals, Inc.). The sponsor was involved in the study design, collection, analysis and interpretation of data, as well as data checking of information provided in the manuscript. The authors had unrestricted access to study data, were responsible for all content and editorial decisions, and received no honoraria related to the development of this publication.
Conflict of interest
L. A. L. has received personal fees from Aegerion, grants and personal fees from Amgen, AstraZeneca, Eli Lilly and Company, Merck, Regeneron Pharmaceuticals, Inc. and Sanofi, and grants from Kowa and the Medicines Company, outside of this submitted work. B. C. has received research funding and personal fees from Sanofi and Regeneron Pharmaceuticals, Inc. during the conduct of the study, research funding from Pfizer, and honoraria from Amgen, AstraZeneca, Pierre Fabre, Janssen, Eli Lilly and Company, MSD (Merck & Co.), Novo Nordisk, Sanofi, and Takeda outside of this submitted work. D. M.‐W. has received speakers' bureau and consultant/advisory board fees from Amgen, AstraZeneca, Boehringer Ingelheim, MSD (Merck & Co.), Novartis, Novo Nordisk and Sanofi. H. M. C. has received grants, personal fees and non‐financial support from Sanofi and Regeneron Pharmaceuticals, Inc. during the conduct of this study, grants, personal fees and non‐financial support from Eli Lilly and Company, and grants from Roche Pharmaceuticals, Pfizer, Boehringer Ingelheim, AstraZeneca and Bayer, outside of this submitted work. S. D. P. has received research funding from Novartis Pharmaceuticals Co., MSD (Merck & Co.) and Novo Nordisk, and has been a consultant for or received honoraria from AstraZeneca, Boehringer Ingelheim, Eli Lilly and Company, GlaxoSmithKline, Janssen Pharmaceuticals, Laboratoires Servier, MSD (Merck & Co.), Novartis Pharmaceuticals Co., Novo Nordisk, Sanofi‐Aventis and Takeda Pharmaceuticals. F. J. T. has received speakers' bureau and consultant/advisory board fees from AstraZeneca, Amgen, Boehringer Ingelheim, Bristol‐Myers Squibb, Eli Lilly and Company, GlaxoSmithKline, Janssen Pharmaceuticals, MSD (Merck & Co.), Novartis Pharmaceuticals Co., Novo Nordisk and Sanofi‐Aventis. K. K. R. has received personal fees (data safety monitoring board) from AbbVie Inc., consultant fees/honoraria from Aegerion, Algorithm, Amgen, AstraZeneca, Boehringer Ingelheim, Cerenis, Eli Lilly and Company, Ionis Pharmaceuticals, Kowa, the Medicines Company, MSD (Merck & Co.), Novartis, Pfizer, Regeneron Pharmaceuticals, Inc., Reservlogix, Sanofi and Takeda, and research grants from Kowa, Pfizer and Regeneron Pharmaceuticals, Inc. M. B.‐B. and C. D. are employees of and shareholders in Sanofi. J. M. is an employee of IviData Stats, contracted to Sanofi. R. S. is an employee of and shareholder in Regeneron Pharmaceuticals, Inc. R. R. H. has received research funding from Eli Lilly and Company, Fuji Chemicals, Hitachi, Lexicon, Novo Nordisk, Pfizer and Viacyte, and has been a consultant and advisory panel member for Alere Inc., AstraZeneca, Boehringer Ingelheim, Bristol‐Myers Squibb, Elcelyx, Intarcia, Ionis, Janssen/Johnson & Johnson and Sanofi‐Aventis.
The authors were fully responsible for all content and editorial decisions, were involved in all stages of manuscript development, and have approved the final version.
Author contributions
L. A. L., B. C., D. M.‐W., H. M. C., S. D. P., F. J. T., M. B.‐B., C. D., J. M., R. S. and R. R. H. contributed to the study design or concept and the analysis and interpretation of the data, and critically reviewed and edited the manuscript. In addition, B. C., S. D. P. and F. J. T. were investigators who contributed to the data acquisition. All authors approved the final version. All authors had full access to the study data and were responsible for the final decision to submit the manuscript. L. A. L. is the guarantor of this work and, as such, takes full responsibility for the integrity of the data and the accuracy of the data analysis.
Leiter LA, Cariou B, Müller‐Wieland D, et al. Efficacy and safety of alirocumab in insulin‐treated individuals with type 1 or type 2 diabetes and high cardiovascular risk: The ODYSSEY DM‐INSULIN randomized trial. Diabetes Obes Metab. 2017;19:1781–1792. https://doi.org/10.1111/dom.13114
Funding information This study was funded by Sanofi and Regeneron Pharmaceuticals, Inc. Medical writing assistance and editorial support, under the direction of the authors, were provided by Rachel Dunn, PhD, and Rob Campbell, PhD, of Prime (Knutsford, UK) funded by Sanofi and Regeneron Pharmaceuticals, Inc., according to Good Publication Practice guidelines (link).
REFERENCES
- 1. de Ferranti SD, de Boer IH, Fonseca V, et al. Type 1 diabetes mellitus and cardiovascular disease: a scientific statement from the American Heart Association and American Diabetes Association. Circulation. 2014;130:1110–1130. [DOI] [PubMed] [Google Scholar]
- 2. Rydén L, Grant PJ, Anker SD, et al. ESC Guidelines on diabetes, pre‐diabetes, and cardiovascular diseases developed in collaboration with the EASD: the Task Force on diabetes, pre‐diabetes, and cardiovascular diseases of the European Society of Cardiology (ESC) and developed in collaboration with the European Association for the Study of Diabetes (EASD). Eur Heart J. 2013;34:3035–3087. [DOI] [PubMed] [Google Scholar]
- 3. Mooradian AD. Dyslipidemia in type 2 diabetes mellitus. Nat Clin Pract Endocrinol Metab. 2009;5:150–159. [DOI] [PubMed] [Google Scholar]
- 4. Feingold KR, Grunfeld C. Diabetes and Dyslipidemia. In: De Groot LJ, Chrousos G, Dungan K, et al., eds. Endotext: South Dartmouth, MA: MDText.com Inc; 2000. [Google Scholar]
- 5. Catapano AL, Graham I, De Backer G, et al. 2016 ESC/EAS Guidelines for the Management of Dyslipidaemias. Eur Heart J. 2016;37:2999–3058. [DOI] [PubMed] [Google Scholar]
- 6. Cholesterol Treatment Trialists' Collaborators , Kearney PM, Blackwell L, et al. Efficacy of cholesterol‐lowering therapy in 18,686 people with diabetes in 14 randomised trials of statins: a meta‐analysis. Lancet. 2008;371:117–125. [DOI] [PubMed] [Google Scholar]
- 7. Cannon CP, Blazing MA, Giugliano RP, et al. Ezetimibe added to statin therapy after acute coronary syndromes. N Engl J Med. 2015;372:2387–2397. [DOI] [PubMed] [Google Scholar]
- 8. Colhoun HM, Betteridge DJ, Durrington PN, et al. Primary prevention of cardiovascular disease with atorvastatin in type 2 diabetes in the Collaborative Atorvastatin Diabetes Study (CARDS): multicentre randomised placebo‐controlled trial. Lancet. 2004;364:685–696. [DOI] [PubMed] [Google Scholar]
- 9. Jacobson TA, Ito MK, Maki KC, et al. National lipid association recommendations for patient‐centered management of dyslipidemia: part 1 — full report. J Clin Lipidol. 2015;9:129–169. [DOI] [PubMed] [Google Scholar]
- 10. American Diabetes Association . 9. Cardiovascular disease and risk management. Diabetes Care. 2017;40:S75–S87. [DOI] [PubMed] [Google Scholar]
- 11. Wong ND, Chuang J, Zhao Y, Rosenblit PD. Residual dyslipidemia according to low‐density lipoprotein cholesterol, non‐high‐density lipoprotein cholesterol, and apolipoprotein B among statin‐treated US adults: National Health and Nutrition Examination Survey 2009‐2010. J Clin Lipidol. 2015;9:525–532. [DOI] [PubMed] [Google Scholar]
- 12. Leiter LA, Lundman P, da Silva PM, et al. Persistent lipid abnormalities in statin‐treated patients with diabetes mellitus in Europe and Canada: results of the Dyslipidaemia International Study. Diabet Med. 2011;28:1343–1351. [DOI] [PubMed] [Google Scholar]
- 13. Kotseva K, Wood D, De Backer G, et al. EUROASPIRE III: a survey on the lifestyle, risk factors and use of cardioprotective drug therapies in coronary patients from 22 European countries. Eur J Cardiovasc Prev Rehabil. 2009;16:121–137. [DOI] [PubMed] [Google Scholar]
- 14. Robinson JG, Farnier M, Krempf M, et al. Efficacy and safety of alirocumab in reducing lipids and cardiovascular events. N Engl J Med. 2015;372:1489–1499. [DOI] [PubMed] [Google Scholar]
- 15. Leiter L, Tinahones FJ, Karalis D, et al. Alirocumab safety in individuals with and without diabetes mellitus: pooled data from 14 ODYSSEY trials. J Am Coll Cardiol. 2017;69:1674. [DOI] [PMC free article] [PubMed] [Google Scholar]
- 16. Leiter LA, Zamorano JL, Bujas‐Bobanovic M, et al. Lipid‐lowering efficacy and safety of alirocumab in patients with or without diabetes: a sub‐analysis of ODYSSEY COMBO II. Diabetes Obes Metab. 2017;19:989–996. [DOI] [PMC free article] [PubMed] [Google Scholar]
- 17. Schmidt AF, Swerdlow DI, Holmes MV, et al. PCSK9 genetic variants and risk of type 2 diabetes: a mendelian randomisation study. Lancet Diabetes Endocrinol. 2017;5:97–105. [DOI] [PMC free article] [PubMed] [Google Scholar]
- 18. Ference BA, Robinson JG, Brook RD, et al. Variation in PCSK9 and HMGCR and risk of cardiovascular disease and diabetes. N Engl J Med. 2016;375:2144–2153. [DOI] [PubMed] [Google Scholar]
- 19. Lotta LA, Sharp SJ, Burgess S, et al. Association between low‐density lipoprotein cholesterol‐lowering genetic variants and risk of type 2 diabetes: a meta‐analysis. JAMA. 2016;316:1383–1391. [DOI] [PMC free article] [PubMed] [Google Scholar]
- 20. Cariou B, Leiter LA, Müller‐Wieland D, et al. Efficacy and safety of alirocumab in insulin‐treated patients with type 1 or type 2 diabetes and high cardiovascular risk: rationale and design of the ODYSSEY DM‐INSULIN trial. Diabetes Metab. 2017. https://doi.org/10.1016/j.diabet.2017.01.004 [Epub ahead of print]. [DOI] [PubMed] [Google Scholar]
- 21. Tatlock S, Arbuckle R, Sanchez R, et al. Psychometric evaluation of a treatment acceptance measure for use in patients receiving treatment via subcutaneous injection. Value Health. 2017;20:430–440. [DOI] [PubMed] [Google Scholar]
- 22. Roth EM, Goldberg AC, Catapano AL, et al. Antidrug antibodies in patients treated with alirocumab. N Engl J Med. 2017;376:1589–1590. [DOI] [PubMed] [Google Scholar]
- 23. Siddiqui O, Hung HM, O'Neill R. MMRM vs. LOCF: a comprehensive comparison based on simulation study and 25 NDA datasets. J Biopharm Stat. 2009;19:227–246. [DOI] [PubMed] [Google Scholar]
- 24. National Research Council . The Prevention and Treatment of Missing Data in Clinical Trials. Washington, DC: The National Academies Press; 2010. [PubMed] [Google Scholar]
- 25. Sattar N, Preiss D, Robinson JG, et al. Lipid‐lowering efficacy of the PCSK9 inhibitor evolocumab (AMG 145) in patients with type 2 diabetes: a meta‐analysis of individual patient data. Lancet Diabetes Endocrinol. 2016;4:403–410. [DOI] [PubMed] [Google Scholar]
- 26. Navar AM, Steen D, Wojdyla D, et al. Recurrent cardiovascular event rates in a contemporary cohort of 829,498 adults with atherosclerotic cardiovascular disease. J Am Coll Cardiol. 2017;69:59. [Google Scholar]
- 27. Farnier M, Gaudet D, Valcheva V, Minini P, Miller K, Cariou B. Efficacy of alirocumab in high cardiovascular risk populations with or without heterozygous familial hypercholesterolemia: pooled analysis of eight ODYSSEY phase 3 clinical program trials. Int J Cardiol. 2016;223:750–757. [DOI] [PubMed] [Google Scholar]
- 28. Kastelein JJ, Kereiakes DJ, Cannon CP, et al. Effect of alirocumab dose increase on LDL lowering and lipid goal attainment in patients with dyslipidemia. Coron Artery Dis. 2017;28:190–197. [DOI] [PMC free article] [PubMed] [Google Scholar]
- 29. Ridker PM, Pradhan A, MacFadyen JG, Libby P, Glynn RJ. Cardiovascular benefits and diabetes risks of statin therapy in primary prevention: an analysis from the JUPITER trial. Lancet. 2012;380:565–571. [DOI] [PMC free article] [PubMed] [Google Scholar]
- 30. Sattar N, Preiss D, Murray HM, et al. Statins and risk of incident diabetes: a collaborative meta‐analysis of randomised statin trials. Lancet. 2010;375:735–742. [DOI] [PubMed] [Google Scholar]
- 31. Preiss D, Seshasai SR, Welsh P, et al. Risk of incident diabetes with intensive‐dose compared with moderate‐dose statin therapy: a meta‐analysis. JAMA. 2011;305:2556–2564. [DOI] [PubMed] [Google Scholar]
- 32. Langhi C, Le May C, Gmyr V, et al. PCSK9 is expressed in pancreatic delta‐cells and does not alter insulin secretion. Biochem Biophys Res Commun. 2009;390:1288–1293. [DOI] [PubMed] [Google Scholar]
- 33. Cariou B, Si‐Tayeb K, Le May C. Role of PCSK9 beyond liver involvement. Curr Opin Lipidol. 2015;26:155–161. [DOI] [PubMed] [Google Scholar]
- 34. Colhoun HM, Ginsberg HN, Robinson JG, et al. No effect of PCSK9 inhibitor alirocumab on the incidence of diabetes in a pooled analysis from 10 ODYSSEY phase 3 studies. Eur Heart J. 2016;37:2981–2989. [DOI] [PMC free article] [PubMed] [Google Scholar]
- 35. Blom DJ, Koren MJ, Roth E, et al. Evaluation of the efficacy, safety and glycaemic effects of evolocumab (AMG 145) in hypercholesterolaemic patients stratified by glycaemic status and metabolic syndrome. Diabetes Obes Metab. 2017;19:98–107. [DOI] [PubMed] [Google Scholar]
- 36. Vergès B, Duvillard L, Brindisi MC, et al. Lack of association between plasma PCSK9 and LDL‐apoB100 catabolism in patients with uncontrolled type 2 diabetes. Atherosclerosis. 2011;219:342–348. [DOI] [PubMed] [Google Scholar]
- 37. Jones PH, Bays HE, Chaudhari U, et al. Safety of alirocumab (a PCSK9 monoclonal antibody) from 14 randomized trials. Am J Cardiol. 2016;118:1805–1811. [DOI] [PubMed] [Google Scholar]
- 38. Roth EM, Bujas‐Bobanovic M, Louie MJ, Cariou B. Patient and physician perspectives on mode of administration of the PCSK9 monoclonal antibody alirocumab, an injectable medication to lower LDL‐C levels. Clin Ther. 2015;37:1945–1954.e6. [DOI] [PubMed] [Google Scholar]
- 39. Schwartz GG, Bessac L, Berdan LG, et al. Effect of alirocumab, a monoclonal antibody to PCSK9, on long‐term cardiovascular outcomes following acute coronary syndromes: rationale and design of the ODYSSEY outcomes trial. Am Heart J. 2014;168:682–689. [DOI] [PubMed] [Google Scholar]
- 40. Sabatine MS, Leiter LA, Wiviott SD, et al. Cardiovascular safety and efficacy of the PCSK9 inhibitor evolocumab in patients with and without diabetes and the effect of evolocumab on glycaemia and risk of new‐onset diabetes: a prespecified analysis of the FOURIER randomised controlled trial. Lancet Diabetes Endocrinol. 2017. https://doi.org/10.1016/S2213-8587(17)30313-3 [Epub ahead of print]. [DOI] [PubMed] [Google Scholar]
Associated Data
This section collects any data citations, data availability statements, or supplementary materials included in this article.
Supplementary Materials
Text S1. Study investigators and steering committee.
Text S2. Full inclusion and exclusion criteria.
Text S3. Methods.
Table S1. ODYSSEY DM‐INSULIN study endpoints.
Table S2. Further baseline characteristics (randomized population).
Table S3. Medical history of statin use for the type 2 and type 1 diabetes populations.
Table S4. Difference in percentage change from baseline to week 24 in calculated LDL‐C (alirocumab versus placebo) according to baseline subgroup for participants with type 2 diabetes.
Table S5. Proportion of participants attaining pre‐defined lipid goals at week 24 (on‐treatment population).
Table S6. Selected key secondary efficacy endpoints and other efficacy endpoints according to treatment randomization.
Table S7. Difference in percentage change from baseline to week 24 in calculated LDL‐C (alirocumab versus placebo) according to baseline subgroup for participants with type 1 diabetes.
Table S8. TEAEs and AEs of special interest for the type 2 and type 1 diabetes populations (safety population).
Table S9. TEAEs leading to treatment discontinuation for the overall population.
Table S10. Summary of I‐TAQ.
Figure S1. HbA1c levels over time per treatment group.
Figure S2. FPG levels over time per treatment group.
Figure S3. Total daily insulin dose over time per treatment group.
Figure S4. Number of antihyperglycaemic drugs over time per treatment group.