

Abstract
Objective
It has been proposed that the thalamocortical system is an important site of action of hallucinogenic drugs and an essential component of the neural correlates of consciousness. Hallucinogenic drugs such as LSD can be used to induce profoundly altered states of consciousness, and it is thus of interest to test the effects of these drugs on this system.
Method
100 μg LSD was administrated orally to 20 healthy participants prior to fMRI assessment. Whole brain thalamic functional connectivity was measured using ROI‐to‐ROI and ROI‐to‐voxel approaches. Correlation analyses were used to explore relationships between thalamic connectivity to regions involved in auditory and visual hallucinations and subjective ratings on auditory and visual drug effects.
Results
LSD caused significant alterations in all dimensions of the 5D‐ASC scale and significantly increased thalamic functional connectivity to various cortical regions. Furthermore, LSD‐induced functional connectivity measures between the thalamus and the right fusiform gyrus and insula correlated significantly with subjective auditory and visual drug effects.
Conclusion
Hallucinogenic drug effects might be provoked by facilitations of cortical excitability via thalamocortical interactions. Our findings have implications for the understanding of the mechanism of action of hallucinogenic drugs and provide further insight into the role of the 5‐HT 2A‐receptor in altered states of consciousness.
Keywords: hallucinogens, psychedelics, fMRI, functional connectivity, thalamus
Significant outcomes.
This fMRI study demonstrated widespread increases in functional connectivity after the administration of LSD to healthy subjects
These alterations correlated with characteristic auditory and visual drug effects
Whole brain voxel‐wise global correlation analysis revealed LSD‐induced increases in functional connectivity in thalamus and striatum
Limitations.
Relatively small sample size
No dose‐response data provided
Ratings on subjective drug effects did not correspond to the duration of the MRI scan exclusively
Introduction
Substances known as hallucinogenic drugs are of interest for their specific effects on the mind 1, 2, as well as their potential therapeutic use (e.g. 3, 4, 5). These substances alter the human psyche in a profound way, including alterations in cognition, emotions and perception, which are unique among psychoactive drugs 1, 2, 6. Investigations of the neural correlates of these altered states of consciousness might provide insight into the mechanisms underlying these distinctive effects. For empirical and theoretical reasons, it has been proposed that the thalamus is an important site of action for hallucinogenic drugs 7. An important model suggested that hallucinogens disrupt thalamic gating of external and internal signals, leading to increased passage of information across the cortex 8. Several neuroimaging studies indicated that hallucinogenic drugs affect thalamic glucose metabolism and blood flow 9, 10, 11, 12, while other evidence reveals that hallucinogens, which mainly act as 5HT2A receptor agonists 13, 14, induce cortical activation via binding on thalamic 5HT2A‐receptors with consecutive release of glutamate in the cortex 15, 16, 17. Features of increased thalamocortical resting‐state functional connectivity (rFC) after the administration of psilocybin 18 and LSD 19 have been reported, but not yet investigated in detail.
The thalamocortical system has also been closely associated with consciousness. Along with the reticular formation, the thalamus seems to be the only region in the brain where small lesions can lead to loss of consciousness 20. Neuroimaging studies found reduced thalamocortical rFC in patients in vegetative states, and this was restored after recovery 21. The thalamus was also found to be the common site of action of at least eight different anaesthetics 22. More specifically, it has been shown that unconsciousness induced by the anaesthetic dexmedetomidine was associated with decreased rFC between the thalamus and the default mode network 23. It is particularly interesting that, after recovery from unconsciousness, thalamocortical connectivity was the only measure that was restored. Moreover, reduced rFC between the thalamus and various cortical regions was reported after administration of the anaesthetic propofol; again, connectivity was restored after recovery 24. Similar results were found in a PET study using two other anaesthetics 25. These observations (and other reasons) have given rise to several theories stating that the thalamocortical system is an essential component for regulating consciousness 22, 26, 27. Hallucinogens such as LSD can be used to induce profoundly altered states of consciousness, and it is thus of interest to test the effects of these drugs on a system that has been so closely associated with consciousness.
Aims of the study
This study sought to investigate the acute brain effects of LSD in healthy participants, using a placebo‐controlled design. Resting‐state fMRI was used to investigate the effects of 100 μg orally administered LSD on thalamic rFC. We further tested the relationship between thalamic rFC measures and subjective LSD effects on ratings of visual and auditory changes. Our hypothesis was that LSD would increase thalamocortical connectivity relative to placebo and that this effect would be associated with the subjective LSD‐induced visual and auditory alterations.
Material and methods
We used a randomised, placebo‐controlled, double‐blind cross‐over design and a washout period of at least 7 days between the two study sessions. Each participant completed two study sessions. The study was approved by the Ethics Committee for Northwest/Central Switzerland (EKNZ) and by the Federal Office of Public Health. Experiments were undertaken with the understanding and written consent of each subject. The study was registered at clinicaltrials.gov prior to study start (NCT02308969). Placebo and LSD were administered orally at 9:00 am. The MRI scan took place at 11:30 am (starting 2.5 h after administration of placebo and LSD), taking into account the time to peak effects of oral LSD 1, 6, 28.
Participants
Twenty‐four participants completed the study. Due to our quality assurance criteria (cumulative head motion of >2 mm translation or >2° rotation or considerable MRI image artefacts), we had to exclude four subjects, resulting in a final sample of 20 participants (10 male, 10 female; mean age 32.4 ± 10.9 years; range: 25–60 years, all right‐handed and all but one with university education). The lifetime drug use of the 20 included subjects is shown in Table S1. None of the participants tested positive for any drug (including tetrahydrocannabinol) in the screening or test session. No serious adverse reactions or events occurred during the whole period of the study in any of the participants.
Assessments of subjective drug effects and plasma levels
Subjective effects of LSD were measured 3 h after administration of placebo or LSD, using the five dimensions of altered states of consciousness (5D‐ASC) scale. The 5D‐ASC was designed to measure altered states of consciousness via visual analogue scales and is well validated 29. Subjects were asked to retrospectively rate subjective effects as the administration of LSD and placebo. Blood was collected into lithium heparin tubes 2 and 3 h after administration of LSD and placebo respectively. Blood samples were immediately centrifuged, and plasma was rapidly stored at −20°C until analysis. LSD concentrations in plasma were determined using a validated liquid chromatography–tandem mass spectrometry method 28.
Image acquisition and preprocessing
Scanning was conducted on a three Tesla MRI system (Magnetom Prisma, Siemens Healthcare, Erlangen, Germany), using a 20‐channel phased array radio frequency head coil. Functional MRI acquisition was based on an interleaved T2*‐weighted echo planar imaging sequence, with 35 axial slices with a slice thickness of 3.5 mm, a 0.5‐mm interslice gap, a field‐of‐view of 224 × 224 cm2 and an in‐plane image matrix size of 64 × 64 – resulting in 3.5 × 3.5 × 3.5 mm3 resolution. To restrict motion, each participants head was fixed using two foam wedges. The corresponding repetition time was 1.8 s, echo time 28 ms and bandwidth = 2442 Hz/pixel. Subjects were asked to close their eyes and not to fall asleep. In total, 300 volumes were acquired (including five dummy scan volumes to ensure signal stabilisation).
Processing was performed using SPM12 (http://www.fil.ion.ucl.ac.uk/spm/) and the CONN functional connectivity toolbox 16.b (http://www.nitrc.org/projects/conn) 30. Five dummy scans were excluded from any further processing, and the remaining volumes were quality checked for severe head motion and image artefacts. Subjects with cumulative head motion of >2 mm translation or >2° rotation were excluded. We further tested for differences in head motion between drug and placebo sessions. Mean composite motion (a measure for scan‐to‐scan movement) was 0.15 ± 0.11 mm (mean ± SD) for the LSD condition and 0.13 ± 0.07 mm (mean ± SD) for the placebo condition. There were no significant differences between conditions (t = 1.10, P = 0.29; paired t test, two tailed). Additionally, mean and maximum movement was aggregated across all six motion parameters and compared between conditions. Again, no significant differences were found (mean movement: t = −0.85, P = 0.42; maximal movement: t = 1.60, P = 0.13; paired t test, two tailed).
All volumes were slice time corrected, realigned, co‐registered to the preprocessed T1‐weighted structural volume, normalised into a standard stereotactic space (Montreal Neurological Institute) and smoothed with a 5 mm full width at half maximum Gaussian kernel. Noise correction included scrubbing 31 with a global signal threshold of z > 3 and a composite subject motion threshold of >0.5 mm using ART as implemented in CONN, linear regression of the six motion parameters, of the effects of each condition, and the white matter and cerebrospinal fluid signals, using individual tissue masks obtained from the T1‐weighted structural images. The resulting functional images were band‐pass filtered (0.008 < f < 0.09 Hz).
Thalamic resting‐state functional connectivity analysis
Three functional connectivity analyses were performed: (i) an ROI‐to‐ROI (region of interest) analysis using the left and right thalamus as separate sources and ROIs covering the whole brain as targets, (ii) a ROI‐to‐voxel analysis using the combined ROIs of the the left and right thalamus as the source and voxels covering the whole brain as targets, (iii) lastly, global rFC was assessed by a global correlation analysis. Global correlation is a data‐driven, whole brain measure for network centrality, calculated by the averaged correlation coefficients of each voxel to each other voxel of the brain 30.
For all analysis, structural ROIs were defined according to areas of the Harvard–Oxford atlas for cortical and subcortical structures and the automated anatomical labelling atlas for the cerebellum. For analysis i), rFC was assessed using separate ROIs for the left and the right thalamus; for analysis ii), a combined ROI for the left and right thalamus was used. Targets of analysis i) were a set of 130 ROIs covering the whole brain as targets (see Supporting Information for more details). Time courses were compared using bivariate correlations. Effects of the drug and the placebo condition were estimated using two‐tailed one‐sample t tests. Differences between conditions were assessed using two‐tailed paired t tests. Results were corrected for multiple comparisons across all ROI pairs (2 × 130), and all voxels, respectively, using false discovery rate (FDR) procedures. Results were considered significant at a threshold of P < 0.05 (FDR) for ROI‐to‐ROI‐analysis. For voxel‐based analysis ii) and iii), cluster size correction (P < 0.05, FDR) based on a cluster‐forming threshold of P < 0.05, FDR was applied.
Relation with drug plasma concentrations and subjective effect ratings and connectivity
Subsequently, individual plasma levels of LSD, individual subjective ratings on visual and auditory hallucinations and levels of vigilance were correlated (Pearson′s r) with individual FC measures for the contrast LSD > placebo.
Ratings on the 5‐ASC major dimensions ‘visionary restructuralization’ and ‘auditory alterations’ (the main scales for sensory alterations) were correlated with rFC measures between the thalamus and regions known to be involved in auditory and visual hallucinations respectively 32. Masks were defined according to the Harvard–Oxford atlas for cortical and subcortical structures and the automated anatomical labelling atlas for the cerebellum. Masks of these meta‐analytically 32 identified regions (for visual hallucinations: right and left lingual gyrus, right cuneus, right cerebellum, right middle occipital gyrus and right fusiform gyrus; for auditory hallucinations: right and left superior temporal gyrus, right and left insula, right inferior frontal gyrus and right precentral gyrus) were used to extract significant clusters obtained in analysis ii) (cluster size corrected at P < 0.05, FDR, based on a cluster‐forming threshold of P < 0.05, FDR). RFC measures between the bilateral thalamus and ROIs (six for the analysis of visual drug effects and six for the analysis of auditory drug effects) were correlated with individual ratings on the 5‐ASC major dimensions ‘visionary restructuralization’ and ‘auditory alterations’ respectively. Results of each analysis were corrected for multiple comparisons (FDR). Significance was assumed at P < 0.05, FDR (two tailed).
Furthermore, rFC measures obtained in analysis ii) (mean of all significant voxels) were correlated with plasma levels of LSD obtained directly before the MRI scan (2 h after administration), because resting‐state measures were the first sequence in our protocol. Plasma levels were also correlated with rFC measures between the thalamus and ROIs found to be significantly associated with subjective drugs. Statistical significance was assumed at P < 0.05 (two tailed).
As alterations in thalamocortical rFC between conditions might be due to differences in vigilance between conditions 33, 34, 35, results of rFC analyses (mean connectivity across all significant voxels in ROI‐to‐voxel analysis, mean of all significant voxels in global correlation analysis, rFC between thalamus and right insula/fusiform gyrus) for the LSD > placebo contrast were correlated with ratings on the item ‘I felt sleepy’ of the 5D‐ASC (tenth item of the questionnaire) assessed under both conditions (placebo condition: mean 12 ± SD 20.7%; LSD condition: mean 21.3 ± SD 29.1%).
Calculations were performed using spss version 23.00 (IBM). Additional Methods and Materials are provided in the Supporting Information.
Results
Plasma levels and subjective drug effects
Plasma concentrations of LSD were 0.0 ± 0.0 ng/ml (mean ± SD) at baseline, 1.3 ± 0.6 ng/ml (mean ± SD) at 2 h after administration (directly before the MRI scan) and 1.1 ± 0.5 ng/ml (mean ± SD) at 3 h after administration. Plasma concentrations of LSD after administration of placebo were 0.0 ± 0.0 ng/ml (mean ± SD) at all time points. LSD caused subjective alterations in all lower‐order scales of the 5D‐ASC measured 3 h after administration, directly after the MRI scan (see Fig. 1). All ratings were significantly increased compared with placebo (P < 0.01).
Figure 1.
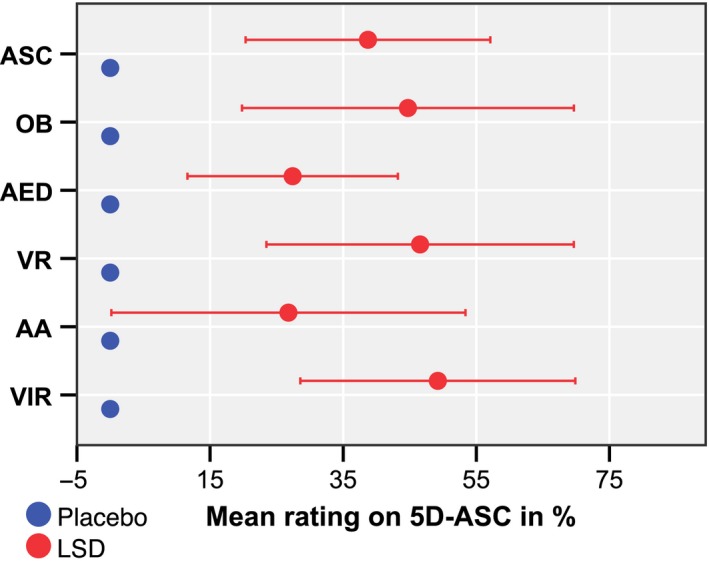
Effects of LSD 3 h after administration measured with the major dimensions of the 5D‐ASC. The graph shows the mean of the ratings in per cent of the visual analogue scale (ASC, altered states of consciousness total score; OB, oceanic boundlessness; AED, anxious ego dissolution; VR, visionary restructuralization; AA, auditory alterations; VIR, reduction of vigilance). Error bars indicate ± 1 standard deviation. [Colour figure can be viewed at wileyonlinelibrary.com]
Functional connectivity analysis
ROI‐to‐ROI analysis showed significantly increased rFC between the thalamus and regions distributed across the whole brain under LSD, relative to placebo (all P < 0.05, FDR). Overall rFC between the left and right thalamus and 104 of 130 investigated regions was increased. Decreased connectivity was found in one case between the left thalamus and vermis 10 (see Fig. 2a). For detailed results, see Table S2. Similar patterns were observed for the right and the left thalamus (see Figure S1).
Figure 2.
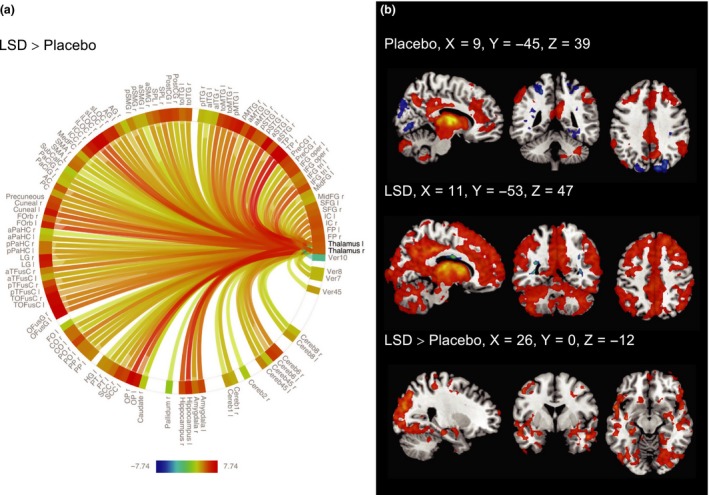
(a) Connectome ring showing the results of the ROI‐to‐ROI‐analysis using the right and left thalamus as separate sources and ROIs covering the whole brain as targets (Table S2 for ROI‐labels). LSD significantly increased rFC between the left or right thalamus and 104 of 130 investigated ROIs relative to placebo. Results were very similar for the right and left thalamus ROI (Figure S1). Results are corrected for multiple comparisons (P < 0.05, FDR) across all ROI‐pairs (2 × 130). The colour bar represents the t value. (b) ROI‐to‐voxel rFC analysis for the combined thalamus ROI. Positive rFC is shown in red, negative rFC is shown in blue (P < 0.05, cluster size FDR‐corrected on the basis of a cluster‐forming threshold of P < 0.05, FDR). Right is right side of the brain. [Colour figure can be viewed at wileyonlinelibrary.com]
The results obtained in the ROI‐to‐ROI analysis were further investigated using a ROI‐to‐voxel approach with the bilateral thalamus as the region of interest. Under the placebo condition, we observed connectivity patterns which were consistent with previous findings 23. LSD significantly increased rFC relative to placebo across various regions, with pronounced clusters in the occipital lobe. The results are shown in Fig. 2b; for detailed results, see Table S3.
Global correlation analysis showed increased network centrality in a cluster (841 voxels, P < 0.000001, FDR) comprising the left and the right thalamus (266 voxels, and 262 voxels respectively), the left and right caudate (103 and 2 voxels respectively) and the right putamen (41 voxels). A second cluster (186 voxels, P < 0.000001, FDR) comprised the left caudate (58 voxels), the left putamen (48 voxels) and the left pallidum (8 voxels). Results are shown in Fig. 3.
Figure 3.
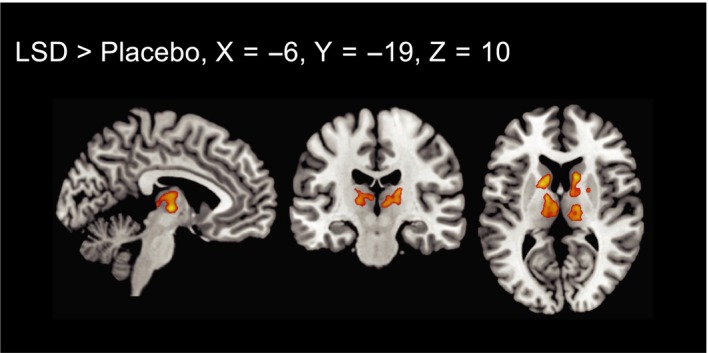
Voxel‐to‐voxel global correlation analysis (P < 0.05, cluster size FDR‐corrected on the basis of a voxel‐threshold of 0.05 FDR‐corrected). Right is right side of the brain. [Colour figure can be viewed at wileyonlinelibrary.com]
Relation of thalamocortical connectivity to drug plasma levels and subjective effect ratings
Plasma levels of LSD did not significantly correlate with thalamocortical rFC measures derived in ROI‐to‐voxel analysis ii) (r = 0.19, P = 0.42).
RFC measures between the thalamus and the right fusiform gyrus correlated significantly with ratings on the ‘visionary restructuralization’ scale (r = 0.66, P = 0.008, FDR) and connectivity measures between the thalamus and the right insula correlated significantly with ratings on the ‘auditory alterations’ scale (r = 0.60, P = 0.021, FDR). Results are shown in Fig. 4. No significant correlations were found between these rFC measures and plasma levels of LSD (thalamus‐right fusiform gyrus: r = 0.42, P = 0.07; thalamus‐right insula: r = 0.16, P = 0.49).
Figure 4.
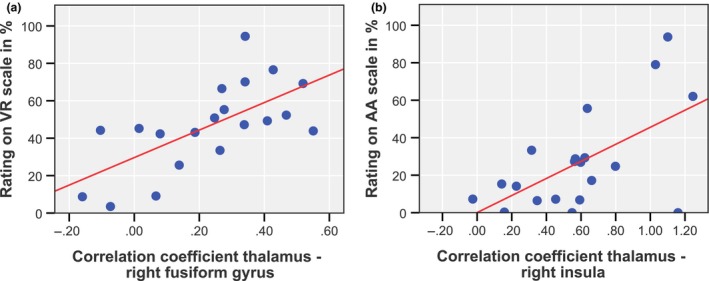
Correlations between acute LSD‐induced thalamic rFC measures and subjective ratings on the (a) ‘visionary restructuralization’ (VR) and (b) ‘auditory alterations’ (AA) scales. [Colour figure can be viewed at wileyonlinelibrary.com]
The 5D‐ASC item ‘I felt sleepy’ obtained under the drug and the placebo condition did not significantly correlate with any of the investigated rFC measures (see Table S4).
Discussion
In this study, we have investigated the acute effect of LSD on thalamic resting‐state FC in healthy subjects. Our key finding was that LSD induced globally increased thalamocortical rFC compared with placebo. Subjective drug effect ratings on ‘visionary restructuralization’ and ‘auditory alterations’ correlated significantly with rFC measures between the thalamus and the right fusiform gyrus and insula, two regions known to be involved in visual and auditory hallucinations respectively 32. No significant correlations were found between these measures and LSD plasma levels, which is in line with previous findings on correlations of LSD plasma exposure with subjective drug effects (see 36 and discussion therein). Global correlation analysis indicated that the bilateral thalamus and parts of the basal ganglia showed significantly increased network centrality after LSD administration compared with placebo.
The notion that the thalamus might be a crucial site of action of hallucinogens has been under debate for years 7, 8. One important model proposed that hallucinogenic drugs disrupt thalamic gating and thalamocortical functioning, which was compared with alterations in psychosis 8. In this notion, both states are characterised by a deficit in filter or gate internal and external stimuli, leading to increased input to the cortex. Previous neuroimaging studies reported diverging effects of psilocybin, mescaline and DMT on the thalamus. Using different imaging modalities, such as SPECT, PET and fMRI, glucose metabolism and blood flow were found to be decreased 9, 10, 11, unchanged 37, 38 or increased 12 in this studies. Consistently with our findings, a recent fMRI study reported increased global functional connectivity of thalamic subdivisions after the administration of LSD 19. In contrast with our results, this study additionally reported increased global functional connectivity of several cortical regions. As these authors used a ROI‐to‐ROI approach, they might be capable to detect alterations in rFC more sensitively than our approach (using an ROI‐to‐voxel approach in combination with a conservative threshold).
Functional significance of increased thalamocortical connectivity
The classical notion of the thalamus as a mere relay for sensory information has been revised. The cortex and thalamus form a complex system of extensive and reciprocal connections, capable of generating oscillatory rhythms 39. Corticothalamocortical pathways are thought to serve integration and transfer of information between cortical regions, possibly via synchronisation 40. Activities of the thalamocortical system are also reflected in rFC measured with rsfMRI. Thalamocortical rFC was shown to be in relatively good aggreement with the known anatomy 41, and specific connectivity was observed between the thalamic subdivions and known resting‐state networks 42. Although some links have been described, the relationship between electrophysiological measures and rsfMRI connectivity is still a matter of debate. Associations between connectivity measured by local field potentials and BOLD rFC have been described for a visual thalamocortical network 43, with the highest association between BOLD connectivity and fluctuations in low frequencies (<20 Hz), particularly pronounced for the alpha band. The same study also found that low‐frequency oscillations, especially alpha bands, modulated gamma activity within regions of the network, a phenomenon known as cross‐frequency coupling. Cross‐frequency coupling (CFC; i.e. the modulation of a frequency band by another frequency band) is a relatively new field of interest, and is thought to be important for large‐scale integration of local activity via regulation of local high‐frequency activity 44. CFC has also been described for frontal 45 and parietal 46 thalamocortical systems. A recent causality analysis reported that thalamic activity drives CFC within the thalamocortical system 47. As regards function, thalamocortical interactions via CFC have been implicated in memory formation 48 and memory retrieval 49. Once again, one of those studies found that the thalamus was the source of the signal 49.
Potential mechanisms of increased thalamocortical rFC under LSD exposure and relationship to subjective drug effects
Taken together, the available electrophysiological data suggest that thalamocortical resting‐state FC best corresponds to fluctuations in low frequencies. While slow frequencies are thought to serve large‐scale interactions, gamma frequencies represent local processing 50. The observed increase in thalamocortical rFC under LSD exposure might thus represent large‐scale interactions via slow frequencies changes, which might facilitate local cortical excitability, possibly via CFC. It can be speculated that this mechanism is actually driven by signals of thalamic origin 47. This model could explain correlations between thalamocortical connectivity and auditory and visual alterations observed in our study. Interestingly, it has already been proposed that synchronised thalamocortical oscillations independent of sensory input may underlie hallucinations 51. Our findings could potentially explain various other effects induced by LSD, some of which have also been proposed to be associated with dysfunction of the thalamocortical system, including synthesthesia via coupling of qualitatively different sensory regions 52 or dream‐like states 53. However, we restricted our analysis to auditory and visual drug effects, to limit multiple comparisons.
A specific site of action for the observed effects of LSD on thalamocortical connectivity might lie in the reticular nucleus, a thin shell of inhibitory, GABAergic neurons surrounding the dorsal thalamus. The reticular nucleus has also already been proposed as a key element in the action of hallucinogenic drugs 7 and in neural correlates of consciousness 22, 26. LSD mainly acts by activation of serotonin 5‐HT2A‐receptors 7, which are expressed in all nuclei of the thalamus 54, including the reticular nucleus 55. Several studies have indicated that 5‐HT2A‐receptors often activate inhibitory GABA neurons 7, and this has also been specifically shown for the reticular nucleus 55. The reticular nucleus is known to be involved in thalamic oscillations and manipulation of this system might probably alter synchronised thalamic activity 56. The thalamus is also part of the cortico‐basal‐ganglia‐thalamo‐cortical circuitry. Besides its involvement in motor function, this circuitry has also been implicated in other functions like emotions and cognition. The striatum (comprised of caudate and putamen) is the main input structure of the basal ganglia and receives afferents from various cortical regions 57. Output nuclei of the basal ganglia mainly project to the thalamus which then projects back to the cortex 57. Like in the thalamus, 5HT2A‐receptors are expressed in the basal ganglia 54 and involvement of this circuitry in the mechanism of action of hallucinogenic drugs has already been suspected 8. Global correlation analysis in this study revealed significantly increased global rFC of the striatum after the administration of LSD. This observation could suggest that the whole cortico‐basal‐ganglia‐thalamo‐cortical circuitry is involved in changes in rFC induced by LSD.
The thalamus and the thalamocortical system have been proposed as an important neural correlate of consciousness 22, 26, 27, a view that is supported by various empirical findings (see Introduction and Ward, 2011, for an overview). What is critical to these models is the capacity of the thalamocortical system to integrate information via its ubiquitous connections and its ability to exhibit synchronised activity. These features are believed to serve the integration of different sensations (such as perception and memory) within one unified experience, which is one of the phenomenological core features of consciousness. One prominent model, the dynamic core theory, was formulated by Edelman and Tonini 27. The dynamic core represents a cluster of coherent neural activity that integrates fractured activity of cortical regions via synchronisation, but which changes over time, corresponding to different states of consciousness. Although not necessarily restricted to it, the dynamic core essentially involves the thalamocortical system. A second and more detailed model in terms of neurophysiology was introduced by Llinás et al. 26. According to this model, consciousness experience is based on coherent oscillations (~40 Hz) in the thalamocortical system. Thalamocortical loops arising from specific thalamic nuclei are thereby thought to carry the ‘content’ (e.g. sensory information), while the interaction with non‐specific loops allows fusion into a single consciousness experience. It is remarkable that we found widespread alterations caused by a drug known for its potency to alter consciousness in a system that has been closely linked to consciousness itself. Given the framework of the models referred to, our findings might be interpreted as recruitment of data that is usually suppressed data, which enters consciousness by re‐entry into the thalamocortical system.
Our study has several limitations. We do not provide dose‐response data and used a moderate dose of 100 μg LSD in a relatively small sample of 20 subjects. The treatment assignment was unavoidably unblinded due to the obvious psychoactive effects of LSD. Moreover, the MRI environment might have influenced the subjective drug effects. We do not provide a causality analysis of the thalamocortical interaction and restricted our analysis to auditory and visual drug effects, to limit multiple comparisons. Thalamocortical connectivity was investigated for both thalamic hemispheres; however, it should be kept in mind that the time courses of these structures are also correlated. Furthermore, 5D‐ASC major dimensions ‘visionary restructuralization’ and ‘auditory alterations’ are not specific for hallucinations, but also comprise other drug effects. Ratings on the 5D‐ASC did cover the whole period as administration of placebo and LSD and thus did not correspond to the duration of the MRI scan exclusively. We did not specifically assess sleepiness during the fMRI but used an item of the 5D‐ASC which covered the whole period since administration of placebo and LSD. In comparison with previous investigations of thalamocortical connectivity after administration of a hallucinogenic drug 18, 19, the strengths of our study are the documentation of plasma LSD concentrations, the absence of significant differences in head movement between conditions and a larger, sex‐balanced and almost hallucinogen‐naïve sample (only two subjects had had used a hallucinogen before, both on only one occasion).
Declaration of interest
The authors declare no competing interests.
Supporting information
Figure S1. Connectome ring showing the results of the ROI‐to‐ROI‐analysis using the right (a) and left (b) thalamus as sources and ROIs covering the whole brain as targets (see Table S2 for ROI labels). Results are corrected for multiple comparisons across all ROI‐pairs (P < 0.05, FDR). The colour bar represents the t value.
Table S1. Cumulative lifetime use by the included subjects of legal and illicit drugs.
Table S2. Results of the ROI‐to‐ROI analysis using the right and left thalamus as seeds and ROIs covering the whole brain as targets. Results are corrected for multiple comparisons across all ROI‐pairs (2 × 130, P < 0.05, FDR).
Table S3. Results of the ROI‐to‐voxel using the bilateral thalamus as seed (cluster‐size corrected (P < 0.05, FDR) on the basis of a cluster‐forming threshold of P < 0.05, FDR).
Table S4. Correlation between functional connectivity measures and the tenth item (“I felt sleepy”) of the 5D‐ASC.
Acknowledgement
The authors would like to express their thanks to Sarah Longhi MD for helpful comments on the manuscript. This work was supported by the Swiss National Science Foundation (grant no. 320030_170249 to ML).
Müller F, Lenz C, Dolder P, Lang U, Schmidt A, Liechti M, Borgwardt S. Increased thalamic resting‐state connectivity as a core driver of LSD‐induced hallucinations.
References
- 1. Schmid Y, Enzler F, Gasser P et al. Acute effects of lysergic acid diethylamide in healthy subjects. Biol Psychiatry 2015;78:544–53. [DOI] [PubMed] [Google Scholar]
- 2. Carhart‐Harris RL, Kaelen M, Bolstridge M et al. The paradoxical psychological effects of lysergic acid diethylamide (LSD). Psychol Med 2016;46:1379–1390. [DOI] [PubMed] [Google Scholar]
- 3. Grob CS, Danforth AL, Chopra GS et al. Pilot study of psilocybin treatment for anxiety in patients with advanced‐stage cancer. Arch Gen Psychiatry 2011;68:71–8. [DOI] [PubMed] [Google Scholar]
- 4. Gasser P, Kirchner K, Passie T. LSD‐assisted psychotherapy for anxiety associated with a life‐threatening disease: a qualitative study of acute and sustained subjective effects. J Psychopharmacol 2015;29:57–68. [DOI] [PubMed] [Google Scholar]
- 5. Carhart‐Harris RL, Bolstridge M, Rucker J et al. Psilocybin with psychological support for treatment‐resistant depression: an open‐label feasibility study. Lancet Psychiatry 2016;3:619–27. [DOI] [PubMed] [Google Scholar]
- 6. Dolder PC, Schmid Y, Muller F, Borgwardt S, Liechti ME. LSD acutely impairs fear recognition and enhances emotional empathy and sociality. Neuropsychopharmacology 2016;41:2638–46. [DOI] [PMC free article] [PubMed] [Google Scholar]
- 7. Nichols DE. Psychedelics. Pharmacol Rev 2016;68:264–355. [DOI] [PMC free article] [PubMed] [Google Scholar]
- 8. Geyer MA, Vollenweider FX. Serotonin research: contributions to understanding psychoses. Trends Pharmacol Sci 2008;29:445–53. [DOI] [PubMed] [Google Scholar]
- 9. Hermle L, Gouzoulis‐Mayfrank E, Spitzer M. Blood flow and cerebral laterality in the mescaline model of psychosis. Pharmacopsychiatry 1998;31(Suppl 2):85–91. [DOI] [PubMed] [Google Scholar]
- 10. Gouzoulis‐Mayfrank E, Schreckenberger M, Sabri O et al. Neurometabolic effects of psilocybin, 3,4‐methylenedioxyethylamphetamine (MDE) and d‐methamphetamine in healthy volunteers. A double‐blind, placebo‐controlled PET study with [18F]FDG. Neuropsychopharmacology 1999;20:565–81. [DOI] [PubMed] [Google Scholar]
- 11. Carhart‐Harris RL, Erritzoe D, Williams T et al. Neural correlates of the psychedelic state as determined by fMRI studies with psilocybin. Proc Natl Acad Sci USA 2012;109:2138–43. [DOI] [PMC free article] [PubMed] [Google Scholar]
- 12. Vollenweider FX, Leenders KL, Scharfetter C, Maguire P, Stadelmann O, Angst J. Positron emission tomography and fluorodeoxyglucose studies of metabolic hyperfrontality and psychopathology in the psilocybin model of psychosis. Neuropsychopharmacology 1997;16:357–72. [DOI] [PubMed] [Google Scholar]
- 13. Vollenweider FX, Vollenweider‐Scherpenhuyzen MF, Babler A, Vogel H, Hell D. Psilocybin induces schizophrenia‐like psychosis in humans via a serotonin‐2 agonist action. NeuroReport 1998;9:3897–902. [DOI] [PubMed] [Google Scholar]
- 14. Preller KH, Herdener M, Pokorny T et al. The fabric of meaning and subjective effects in LSD‐induced states depend on serotonin 2A receptor activation. Curr Biol 2017;27:451–7. [DOI] [PubMed] [Google Scholar]
- 15. Scruggs JL, Patel S, Bubser M, Deutch AY. DOI‐Induced activation of the cortex: dependence on 5‐HT2A heteroreceptors on thalamocortical glutamatergic neurons. J Neurosci 2000;20:8846–52. [DOI] [PMC free article] [PubMed] [Google Scholar]
- 16. Scruggs JL, Schmidt D, Deutch AY. The hallucinogen 1‐[2,5‐dimethoxy‐4‐iodophenyl]‐2‐aminopropane (DOI) increases cortical extracellular glutamate levels in rats. Neurosci Lett 2003;346:137–40. [DOI] [PubMed] [Google Scholar]
- 17. Marek GJ, Wright RA, Gewirtz JC, Schoepp DD. A major role for thalamocortical afferents in serotonergic hallucinogen receptor function in the rat neocortex. Neuroscience 2001;105:379–92. [DOI] [PubMed] [Google Scholar]
- 18. Carhart‐Harris RL, Leech R, Erritzoe D et al. Functional connectivity measures after psilocybin inform a novel hypothesis of early psychosis. Schizophr Bull 2013;39:1343–51. [DOI] [PMC free article] [PubMed] [Google Scholar]
- 19. Tagliazucchi E, Roseman L, Kaelen M et al. Increased global functional connectivity correlates with LSD‐induced ego dissolution. Curr Biol 2016;26:1043–50. [DOI] [PubMed] [Google Scholar]
- 20. Bogen JE. On the neurophysiology of consciousness: I. An overview. Conscious Cogn 1995;4:52–62. [DOI] [PubMed] [Google Scholar]
- 21. Laureys S, Faymonville ME, Luxen A, Lamy M, Franck G, Maquet P. Restoration of thalamocortical connectivity after recovery from persistent vegetative state. Lancet 2000;355:1790–1. [DOI] [PubMed] [Google Scholar]
- 22. Ward LM. The thalamic dynamic core theory of conscious experience. Conscious Cogn 2011;20:464–86. [DOI] [PubMed] [Google Scholar]
- 23. Akeju O, Loggia ML, Catana C et al. Disruption of thalamic functional connectivity is a neural correlate of dexmedetomidine‐induced unconsciousness. eLife 2014;3:e04499. [DOI] [PMC free article] [PubMed] [Google Scholar]
- 24. Liu X, Lauer KK, Ward BD, Li SJ, Hudetz AG. Differential effects of deep sedation with propofol on the specific and nonspecific thalamocortical systems: a functional magnetic resonance imaging study. Anesthesiology 2013;118:59–69. [DOI] [PMC free article] [PubMed] [Google Scholar]
- 25. White NS, Alkire MT. Impaired thalamocortical connectivity in humans during general‐anesthetic‐induced unconsciousness. NeuroImage 2003;19:402–11. [DOI] [PubMed] [Google Scholar]
- 26. Llinas R, Ribary U, Contreras D, Pedroarena C. The neuronal basis for consciousness. Philos Trans R Soc Lond B Biol Sci 1998;353:1841–9. [DOI] [PMC free article] [PubMed] [Google Scholar]
- 27. Tononi G, Edelman GM. Consciousness and complexity. Science 1998;282:1846–51. [DOI] [PubMed] [Google Scholar]
- 28. Dolder PC, Schmid Y, Haschke M, Rentsch KM, Liechti ME. Pharmacokinetics and concentration‐effect relationship of oral LSD in humans. Int J Neuropsychopharmacol 2015;19:1–7. [DOI] [PMC free article] [PubMed] [Google Scholar]
- 29. Studerus E, Gamma A, Vollenweider FX. Psychometric evaluation of the altered states of consciousness rating scale (OAV). PLoS ONE 2010;5:e12412. [DOI] [PMC free article] [PubMed] [Google Scholar]
- 30. Whitfield‐Gabrieli S, Nieto‐Castanon A. Conn: a functional connectivity toolbox for correlated and anticorrelated brain networks. Brain Connectivity 2012;2:125–41. [DOI] [PubMed] [Google Scholar]
- 31. Power JD, Mitra A, Laumann TO, Snyder AZ, Schlaggar BL, Petersen SE. Methods to detect, characterize, and remove motion artifact in resting state fMRI. NeuroImage 2014;84:320–41. [DOI] [PMC free article] [PubMed] [Google Scholar]
- 32. Zmigrod L, Garrison JR, Carr J, Simons JS. The neural mechanisms of hallucinations: A quantitative meta‐analysis of neuroimaging studies. Neurosci Biobehav Rev 2016;69:113–23. [DOI] [PubMed] [Google Scholar]
- 33. Spoormaker VI, Schroter MS, Gleiser PM et al. Development of a large‐scale functional brain network during human non‐rapid eye movement sleep. J Neurosci 2010;30:11379–87. [DOI] [PMC free article] [PubMed] [Google Scholar]
- 34. Tagliazucchi E, Laufs H. Decoding wakefulness levels from typical fMRI resting‐state data reveals reliable drifts between wakefulness and sleep. Neuron 2014;82:695–708. [DOI] [PubMed] [Google Scholar]
- 35. Tagliazucchi E, von Wegner F, Morzelewski A, Borisov S, Jahnke K, Laufs H. Automatic sleep staging using fMRI functional connectivity data. NeuroImage 2012;63:63–72. [DOI] [PubMed] [Google Scholar]
- 36. Liechti ME, Dolder PC, Schmid Y. Alterations of consciousness and mystical‐type experiences after acute LSD in humans. Psychopharmacology 2016;234:1499–1510. [DOI] [PMC free article] [PubMed] [Google Scholar]
- 37. Riba J, Romero S, Grasa E, Mena E, Carrio I, Barbanoj MJ. Increased frontal and paralimbic activation following ayahuasca, the pan‐Amazonian inebriant. Psychopharmacology 2006;186:93–8. [DOI] [PubMed] [Google Scholar]
- 38. Carhart‐Harris RL, Muthukumaraswamy S, Roseman L et al. Neural correlates of the LSD experience revealed by multimodal neuroimaging. Proc Natl Acad Sci USA 2016;113:4853–8. [DOI] [PMC free article] [PubMed] [Google Scholar]
- 39. Jones E. The Thalamus. 2nd edn New York: Cambridge University Press; 2007. [Google Scholar]
- 40. Saalmann YB. Intralaminar and medial thalamic influence on cortical synchrony, information transmission and cognition. Front Syst Neurosci 2014;8:83. [DOI] [PMC free article] [PubMed] [Google Scholar]
- 41. Hale JR, Mayhew SD, Mullinger KJ et al. Comparison of functional thalamic segmentation from seed‐based analysis and ICA. NeuroImage 2015;114:448–65. [DOI] [PubMed] [Google Scholar]
- 42. Yuan R, Di X, Taylor PA, Gohel S, Tsai YH, Biswal BB. Functional topography of the thalamocortical system in human. Brain Struct Funct 2016;221:1971–84. [DOI] [PMC free article] [PubMed] [Google Scholar]
- 43. Wang L, Saalmann YB, Pinsk MA, Arcaro MJ, Kastner S. Electrophysiological low‐frequency coherence and cross‐frequency coupling contribute to BOLD connectivity. Neuron 2012;76:1010–20. [DOI] [PMC free article] [PubMed] [Google Scholar]
- 44. Canolty RT, Knight RT. The functional role of cross‐frequency coupling. Trends Cogn Sci 2010;14:506–15. [DOI] [PMC free article] [PubMed] [Google Scholar]
- 45. Fitzgerald TH, Valentin A, Selway R, Richardson MP. Cross‐frequency coupling within and between the human thalamus and neocortex. Front Human Neurosci 2013;7:84. [DOI] [PMC free article] [PubMed] [Google Scholar]
- 46. Roux F, Wibral M, Singer W, Aru J, Uhlhaas PJ. The phase of thalamic alpha activity modulates cortical gamma‐band activity: evidence from resting‐state MEG recordings. J Neurosci 2013;33:17827–35. [DOI] [PMC free article] [PubMed] [Google Scholar]
- 47. Malekmohammadi M, Elias WJ, Pouratian N. Human thalamus regulates cortical activity via spatially specific and structurally constrained phase‐amplitude coupling. Cereb Cortex 2015;25:1618–28. [DOI] [PMC free article] [PubMed] [Google Scholar]
- 48. Sweeney‐Reed CM, Zaehle T, Voges J et al. Corticothalamic phase synchrony and cross‐frequency coupling predict human memory formation. eLife 2014;3:e05352. [DOI] [PMC free article] [PubMed] [Google Scholar]
- 49. Staudigl T, Zaehle T, Voges J et al. Memory signals from the thalamus: early thalamocortical phase synchronization entrains gamma oscillations during long‐term memory retrieval. Neuropsychologia 2012;50:3519–27. [DOI] [PubMed] [Google Scholar]
- 50. Siegel M, Donner TH, Engel AK. Spectral fingerprints of large‐scale neuronal interactions. Nat Rev Neurosci 2012;13:121–34. [DOI] [PubMed] [Google Scholar]
- 51. Behrendt RP. Hallucinations: synchronisation of thalamocortical gamma oscillations underconstrained by sensory input. Conscious Cogn 2003;12:413–51. [DOI] [PubMed] [Google Scholar]
- 52. Schweizer TA, Li Z, Fischer CE et al. From the thalamus with love: a rare window into the locus of emotional synesthesia. Neurology 2013;81:509–10. [DOI] [PubMed] [Google Scholar]
- 53. Llinas RR, Pare D. Of dreaming and wakefulness. Neuroscience 1991;44:521–35. [DOI] [PubMed] [Google Scholar]
- 54. Cornea‐Hebert V, Riad M, Wu C, Singh SK, Descarries L. Cellular and subcellular distribution of the serotonin 5‐HT2A receptor in the central nervous system of adult rat. J Comp Neurol 1999;409:187–209. [DOI] [PubMed] [Google Scholar]
- 55. Goitia B, Rivero‐Echeto MC, Weisstaub NV et al. Modulation of GABA release from the thalamic reticular nucleus by cocaine and caffeine: role of serotonin receptors. J Neurochem 2016;136:526–35. [DOI] [PMC free article] [PubMed] [Google Scholar]
- 56. Fogerson PM, Huguenard JR. Tapping the brakes: cellular and synaptic mechanisms that regulate thalamic oscillations. Neuron 2016;92:687–704. [DOI] [PMC free article] [PubMed] [Google Scholar]
- 57. Lanciego JL, Luquin N, Obeso JA. Functional neuroanatomy of the basal ganglia. Cold Spring Harb Perspect Med 2012;2:a009621. [DOI] [PMC free article] [PubMed] [Google Scholar]
Associated Data
This section collects any data citations, data availability statements, or supplementary materials included in this article.
Supplementary Materials
Figure S1. Connectome ring showing the results of the ROI‐to‐ROI‐analysis using the right (a) and left (b) thalamus as sources and ROIs covering the whole brain as targets (see Table S2 for ROI labels). Results are corrected for multiple comparisons across all ROI‐pairs (P < 0.05, FDR). The colour bar represents the t value.
Table S1. Cumulative lifetime use by the included subjects of legal and illicit drugs.
Table S2. Results of the ROI‐to‐ROI analysis using the right and left thalamus as seeds and ROIs covering the whole brain as targets. Results are corrected for multiple comparisons across all ROI‐pairs (2 × 130, P < 0.05, FDR).
Table S3. Results of the ROI‐to‐voxel using the bilateral thalamus as seed (cluster‐size corrected (P < 0.05, FDR) on the basis of a cluster‐forming threshold of P < 0.05, FDR).
Table S4. Correlation between functional connectivity measures and the tenth item (“I felt sleepy”) of the 5D‐ASC.