Figure 95.

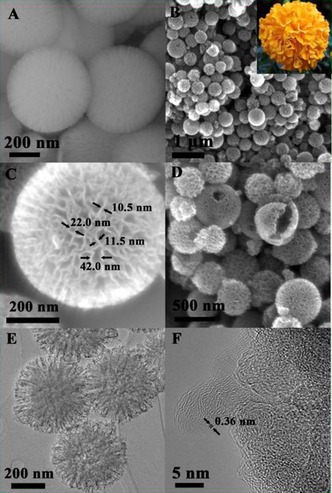
SEM images of a) DFNS‐NH2 (FSS) and b–d) HCCSg1.0 and e, f) TEM images of HCCSg1.0. Reprinted with permission from Ref. 121. Copyright 2015 Elsevier B.V.

SEM images of a) DFNS‐NH2 (FSS) and b–d) HCCSg1.0 and e, f) TEM images of HCCSg1.0. Reprinted with permission from Ref. 121. Copyright 2015 Elsevier B.V.