

Abstract
Alternative cell sources, such as three‐dimensional organoids and induced pluripotent stem cell–derived cells, might provide a potentially effective approach for both drug development applications and clinical transplantation. For example, the development of cell sources for liver cell–based therapy has been increasingly needed, and liver transplantation is performed for the treatment for patients with severe end‐stage liver disease. Differentiated liver cells and three‐dimensional organoids are expected to provide new cell sources for tissue models and revolutionary clinical therapies. However, conventional experimental methods confirming the expression levels of liver‐specific lineage markers cannot provide complete information regarding the differentiation status or degree of similarity between liver and differentiated cell sources. Therefore, in this study, to overcome several issues associated with the assessment of differentiated liver cells and organoids, we developed a liver‐specific gene expression panel (LiGEP) algorithm that presents the degree of liver similarity as a “percentage.” We demonstrated that the percentage calculated using the LiGEP algorithm was correlated with the developmental stages of in vivo liver tissues in mice, suggesting that LiGEP can correctly predict developmental stages. Moreover, three‐dimensional cultured HepaRG cells and human pluripotent stem cell–derived hepatocyte‐like cells showed liver similarity scores of 59.14% and 32%, respectively, although general liver‐specific markers were detected. Conclusion: Our study describes a quantitative and predictive model for differentiated samples, particularly liver‐specific cells or organoids; and this model can be further expanded to various tissue‐specific organoids; our LiGEP can provide useful information and insights regarding the differentiation status of in vitro liver models. (Hepatology 2017;66:1662–1674).
Abbreviations
- CYP3A4
cytochrome P450 3A4
- 3D
three‐dimensional
- FPKM
fragments per kilobase million
- hESC
human embryonic stem cell
- HLC
hepatocyte‐like cell
- hPSC
human pluripotent stem cell
- iPSC
induced pluripotent stem cell
- LiGEP
liver‐specific gene expression panel
- NPC
neural progenitor cell
- RNA‐seq
RNA‐sequencing
- TCGA
The Cancer Genome Atlas
The key technology to make three‐dimensional (3D) constructions consists of a spheroid culture system with cell aggregation, a coculture system, and extracellular matrix components or, alternatively, a differentiation system derived from human pluripotent stem cells (hPSCs), such as embryonic stem cells (ESCs) or induced PSCs (iPSCs).1 Because the 3D construction models more closely mimic the culture environment and structural complexity of human organs,2, 3, 4, 5 3D tissue‐like structures and 2D tissue‐specific cells will likely be a successful future model for disease modeling and drug screening in pharmacological and toxicological industries.5, 6 Most importantly, various organoids generated from patient‐derived iPSCs can be applied to drug screening models for degenerative conditions, such as cystic kidney and liver fibrosis diseases; and hepatocyte 3D culture models or iPSC‐derived differentiated cells may reduce the need for animal studies.4
In the transplantation of iPSC‐derived hepatocytes into mice, angiogenesis occurs in mouse tissue, and albumin secretion occurs. Thus, the liver organoid is an applicable resource for replacement therapy and is useful material for the treatment of liver disease.7, 8 To develop a liver mimic, the liver organoid matures by coculture with human umbilical vein endothelial cells and mesenchymal stem cells and by growth factor and extracellular matrix gel embedding. The maturation steps exhibit cell movement and self‐organized 3D tissue.9, 10 However, liver organoid models generated by hepatocyte 3D culture and cell differentiation from iPSCs cannot fully describe the architecture of liver organs. Generally, to assess the maturation or differentiation status of hepatocyte 3D cultures or iPSC‐derived hepatocytes, liver‐specific lineage markers are tested by PCR, western blot analysis, and immunocytochemical analysis. Additionally, microarray analysis comparing the liver organoid to the liver is used for a comparative analysis of gene expression patterns.11, 12 However, the gene expression patterns and levels of liver‐specific lineage markers are difficult to use to distinguish the maturation or differentiation level of hepatocyte 3D cultures or iPSC‐derived hepatocytes.
Recently, the development of next‐generation sequencing technology and associated analysis tools supports the interpretation of life sciences using genomics. Large‐scale transcriptome analysis has been used to study the expression patterns of whole coding genes in several tissues and organs. This study could provide information on molecular networks and tissue‐specific protein expression profiles.13, 14, 15 Using the transcriptome, computational network analysis was developed to predict lineage specifiers in stem cell subpopulations, and whole‐genome transcription data were used to predict the stages of ESC differentiation.16, 17 However, there are no reports of quantification methods for specific organ differentiation by hepatocyte 3D culture or iPSC‐derived differentiation.
Therefore, in this study, we developed an algorithm based on RNA‐sequencing (RNA‐Seq) analysis to assess the differentiation or maturation status of in vitro–differentiated hepatocytes or hepatocyte 3D cultured cells and to overcome a technical limitation for the validation of differentiation. To develop the analytical algorithm, we screened 93 liver‐specific genes (i.e., a liver‐specific gene expression panel [LiGEP]) through RNA‐Seq analysis of 20 organ‐derived tissues. The findings were validated using the Human Protein Atlas database and a quantitative real‐time PCR analysis of complementary DNA from human vital organs. In addition, we developed an analytical algorithm to calculate the liver similarity (percentage) of hPSC‐derived hepatocyte‐like cells (hPSC‐HLCs) or hepatocyte 3D cultured cells compared with human livers and performed an accuracy test for the LiGEP algorithm with 730 normal samples derived from The Cancer Genome Atlas (TCGA) database. Finally, for the LiGEP algorithm, we suggested the possibility of a “differentiation indicator” in several stages of the mouse liver and obtained scores of 59% and 32% liver similarity in HepaRG 3D cultures and hPSC‐HLCs, respectively. Thus, application of the LiGEP algorithm can provide an exact liver similarity percentage to researchers and will be a promising resource for the generation of high‐quality liver cells or tissues, such as organoids. In addition, the algorithm could be used for the generation of various human tissue‐specific cells and organoids.
Materials and Methods
SELECTION AND VALIDATION OF LIVER‐SPECIFIC EXPRESSED GENES
To construct the LiGEP, we selected liver‐specific genes included in the top 2.5% expression‐ranked genes in the RNA‐Seq data of the total human liver after statistical analysis (Wilcoxon signed‐rank test). A one‐sample Wilcoxon signed‐rank test per candidate gene was performed for comparisons between liver and other tissues as follows. Let represent the fragments per kilobase million (FPKM) values of the th gene vector with N nonliver tissues, and is the FPKM value for the th gene in liver tissue. Although these raw FPKM vectors appear to not be normally distributed, they are not transformed to a normal distribution. A nonparametric method, the Wilcoxon signed‐rank test, was used because new test samples have raw FPKM values and cannot satisfy the assumption of normality. ( ) is lower than the FPKM values of liver tissue ( ). Let represent the median of . We performed the Wilcoxon signed‐rank test for the null hypothesis at the level of significance. If the P value was less than the null hypothesis was rejected in favor of the alternative hypothesis, . Among genes with P values <0.05, we selected genes with a 4‐fold change between liver and nonliver tissues, which ultimately resulted in 118 genes. This script was performed using a custom Perl and R script. In addition, to validate the liver‐specific expression profiles of 118 genes in more detail, we used a public database (Human Protein Atlas) that provided transcriptomes of 32 tissues (122 individuals) based on RNA‐Seq data. A comparison analysis with liver‐specific genes from the Human Protein Atlas revealed that 114 genes overlapped. We subsequently experimentally validated these 114 genes using quantitative RT‐PCR with complementary DNA from eight tissues (brain, heart, kidney, liver, lung, colon, small intestine, and stomach) and identified 93 liver‐specific genes.
LiGEP ALGORITHM
Testing of unknown samples requires criteria for determining whether a given sample is a liver sample. These criteria were defined based on significantly differential expression between liver and nonliver samples. Because the number of samples was small, a nonparametric analysis was performed using 1 liver and 18 nonliver expression data sets for the above 93 liver‐specific genes. Because we were interested in genes highly expressed in liver, we performed a one‐sided Wilcoxon signed‐rank test with the alternative hypothesis that , where is the th gene vector that has nonliver tissue expression data, is the liver expression data, and is the median of for each th gene ( ). As a result of the statistical test, the confidence interval was calculated for every th LiGEP gene, where was the level of significance. The upper bound of each gene's confidence interval was used as criterion for strict classification. The Walsh average is required to calculate the confidence interval of the Wilcoxon test. The arithmetic mean of two samples out of numeric data sets was calculated, this was repeated for all possible cases, and arithmetic means were sorted. is the th sorted Walsh average and the upper bound of the confidence interval, where is denoted as , and a round‐up constant. When , denoted as the th gene expression of an unknown sample, is higher than , it is considered similar to the expression in liver. For greater simplicity, we denote that . If is positive, the test sample is close to liver; otherwise, it is not. This is expressed as and by using the indicator function. Among all 93 LiGEP genes, genes with a positive value of were counted, and then a percentage was calculated as follows. To determine whether an unknown sample was liver, to calculate the similarity between liver and unknown samples, we obtained the Jaccard distance of the binary data from the indicator function. To determine the similarity between the liver and the unknown sample, we set the count for each case of the indicator function of liver and unknown as , and . Finally, the LiGEP algorithm score of the th gene of the unknown sample was calculated as follows.
CELL CULTURES
HepaRG (Biopredic International, France) and HepG2 cells were cultured in Williams E medium:GlutaMAX (Invitrogen, Carlsbad, CA) and Dulbecco's modified Eagle's medium supplemented with 10% fetal bovine serum and 1% penicillin/streptomycin, respectively. All cultures were maintained in a sterile environment at 37°C with 95% air and 5% CO2. Details of the 2D and 3D culture methods used for HepaRG cells are provided in the Supporting Information. The hESC cell line H9 (WiCell Research Institute, Madison, WI) and human iPSCs generated from fibroblasts as described18 were maintained on Matrigel (BD Biosciences, San Jose, CA)–coated dishes in mTeSR 1 medium (STEMCELL Technologies, Temecula, CA).19
Results
OUTLINE OF STEPS FOR THE DEVELOPMENT OF A LIVER SIMILARITY PREDICTION SYSTEM
To construct an analytical pipeline and algorithm for liver cells and tissues using RNA‐Seq analysis, Fig. 1 shows the complete flowchart for the development of the analytical method. Our experimental strategy included the following steps: (1) RNA‐Seq analysis with total RNA from 20 tissues purchased from Clontech and screening for liver‐specific genes compared with 18 nonliver tissues, (2) validation of candidate genes through the public Human Protein Atlas database and quantitative RT‐PCR analysis, (3) development of the LiGEP algorithm to measure the liver similarity of hPSC‐HLCs and HepaRG 3D cultures, and (4) validation of the LiGEP algorithm using normal tissues (730 normal tissues). The LiGEP algorithm calculates the liver similarity compared with human liver and suggests the differentiation or maturation status of hPSC‐HLCs and hepatocyte 3D cultures.
Figure 1.
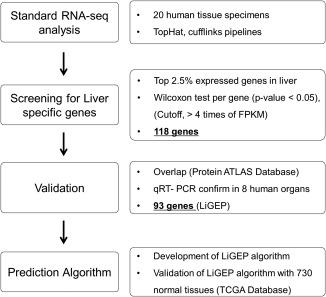
A workflow for developing the LiGEP. (1) Standard RNA‐seq analysis and selection of liver‐specific genes. RNA‐seq analysis with total RNA from 20 tissues purchased from Clontech and screening liver‐specific genes compared with 18 nonliver tissues through TopHat‐cufflinks pipelines. (2) Validation. Validation of candidate genes using the public database of Human Protein Atlas and quantitative RT‐PCR analysis. (3) LiGEP algorithm. Construction of LiGEP algorithm to measure the liver similarity of liver organoids and 3D culture and validation of LiGEP algorithm with normal tissues (730 normal tissues).
CONSTRUCTION OF THE LiGEP
In this study, we constructed a quantitative prediction system to provide the differentiation or maturation status of hPSC‐HLCs and hepatocyte 3D cultures to researchers. First, to separate genes with liver‐specific expression, we produced RNA‐Seq data for RNA from 20 human tissues (bone, brain cerebellum, whole brain, colon, fetal brain, fetal liver, heart, kidney, lung, liver, placenta, prostate, skeletal muscle, small intestine, spinal, spleen, stomach, testis, thymus, and uterus) and performed an RNA‐Seq data analysis pipeline (TopHat‐Cufflinks) for the construction of liver‐specific gene expression profiles in 20 tissues. To narrow down the candidate liver‐specific genes, we examined genes that were overexpressed in the top 2.5% in liver tissue compared with other tissues. Targeting approximately 630 genes, we performed a statistical analysis of each gene to assess whether the expression was significantly increased compared with the expression in other tissues (one‐sample Wilcoxon signed‐rank test, P < 0.05; see Materials and Methods)20 and identified 118 genes. After validation of these 118 genes using quantitative RT‐PCR and a public database (Human Protein Atlas; see Materials and Methods), we finally identified 93 liver‐specific genes (Supporting Fig. S1) that formed the LiGEP (Supporting Table S3).
To assess whether the LiGEP represented a liver‐specific gene panel, we performed multidimensional scaling plot analysis and observed that the LiGEP expression pattern was clearly distinguished from all other 18 tissues, except fetal liver (Fig. 2A). Moreover, the LiGEP heat map revealed liver specificity in our results and the Human Protein Atlas (Fig. 2B,C). Concordantly, the expression patterns of the LiGEP in the liver had poor correlations with the RNA‐Seq results of 32 tissues provided by the Human Protein Atlas (Fig. 2D).
Figure 2.
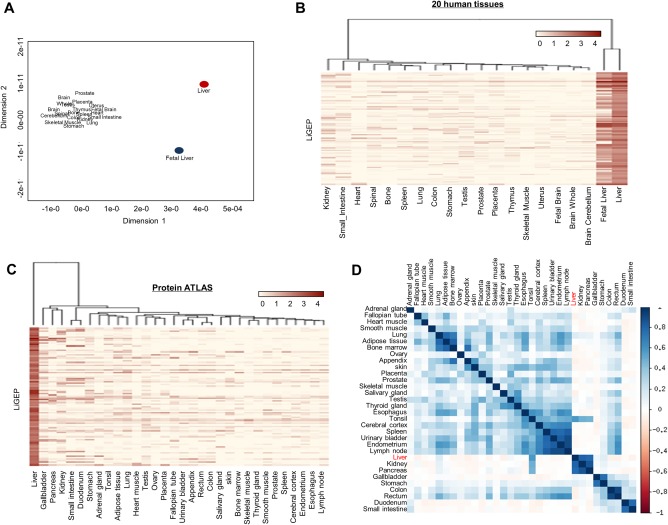
Construction and characterization of LiGEP. (A) A multidimensional scaling plot analysis was performed with RNA‐Seq results of LiGEP in 20 human tissues. The liver and other tissues are clearly separated in two major sections. The x axis represents the human tissues, and the y axis shows the 93 LiGEP genes. (B,C) A heat map representing the gene expression level of LiGEP in 20 (in‐house) and 32 (Human Protein Atlas) tissues. Tissues with similar FPKM values (log10[FPKM +1]) were clustered. (D) Correlation plot of LiGEP in the Human Protein Atlas data. The x and y axes describe the names of human tissues.
Next, to analyze the biological function of the LiGEP, functional enrichment analysis was performed using Ingenuity Pathway Analysis (Fig. 3). The canonical pathway analysis revealed that genes related to lipid metabolism (farnesoid X receptor/retinoid X receptor activation, liver X receptor/retinoid X receptor activation) and early injury response (acute‐phase response, coagulation system, prothrombin activation, and complement system) were significantly regulated (Fig. 3A; Supporting Table S4). The disease and function analyses revealed that the focused genes were associated with liver function, such as liver lesion (30 genes), steroid metabolism (22 genes), and xenobiotic metabolism (9 genes) (Fig. 3B). The gene network related to liver function was analyzed (Fig. 3C). Genes such as cytochrome P450 2E1 (CYP2E1), CYP2C9, SLCO1B1, and APOA/B were interactively regulated among liver lesions, steroid metabolism, and xenobiotic metabolism. Therefore, we suggested that 93 genes in the LiGEP reflected liver functions.
Figure 3.
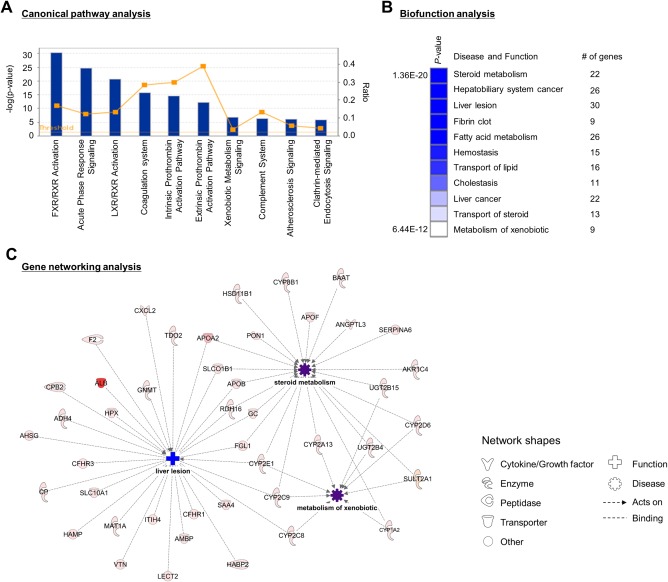
Functional enrichment analysis of LiGEP from the Ingenuity Pathway Knowledge Base. (A) Canonical pathway analysis. Representative canonical pathways are depicted as a histogram. The P value associated with the pathways is a measure of the significance with respect to the pathways for the imported data set and a reference set of molecules involved in a given pathway. The orange line indicates the threshold of significance (P < 0.05). (B) Disease and biofunction analysis. The top regulated disease and biofunction are selected, and the significance is displayed with a heat map. (C) Gene networking analysis. Each gene was matched to human homolog proteins, and the human genes are represented in the networking map. The expression intensity of the focused genes is colored in red. The predicted diseases and functions are displayed in blue and purple, respectively. Abbreviations: FXR, farnesoid X receptor; LXR, liver X receptor; RXR, retinoid X receptor.
LiGEP ALGORITHM
Popular known liver‐specific markers, such as albumin, alpha‐1‐antitrypsin, glutathione S‐transferases A1 and A2, and CYP3A4, are routinely used for validation of differentiated liver cells through quantitative RT‐PCR or western blot analysis.11, 12 However, these biochemical results have limitations for evaluating differentiation status given that these liver‐specific markers are also expressed in other tissues. Additionally, the expression levels of these markers alone cannot explain liver similarity as a numerical value. To overcome these problems, we designed the LiGEP algorithm to predict similarity with the liver organ. The algorithm can calculate the differentiation or maturation status of hPSC‐HLCs and hepatocyte 3D cultured cells. The potential application of the LiGEP algorithm involves providing a liver similarity score (“percentage”) of hPSC‐HLCs or hepatocyte 3D cultured cells compared with human adult liver. In other words, the LiGEP algorithm is an analytical system for evaluating liver similarity through the LiGEP algorithm of hPSC‐HLCs or hepatocyte 3D cultured cells after RNA‐Seq analysis. The liver similarity score ranges from 0 to 1 (0%‐100%). This algorithm can easily calculate the liver similarity of hPSC‐HLCs or hepatocyte 3D cultured cells compared with human liver and can be applied to various tissue‐specific cells or organoids. Thus, this report describes the differentiation status and the degree of similarity between livers and differentiated liver cells as a “percentage” of similarity through transcriptome analysis using RNA‐Seq technology. According to this concept, we can declare a “liver” when the LiGEP algorithm score of an unknown sample is 100%. In addition, the program can suggest the condition of an unknown sample to the researcher. However, given the differences between individuals and to adjust for the conditions of the liver, we admit false probability using P value calculations (P < 0.05).
ACCURACY TEST OF THE LiGEP ALGORITHM
To examine the accuracy of the LiGEP algorithm, we assessed its sensitivity and specificity using RNA‐Seq data from 730 samples across 15 normal solid tissues provided from the TCGA public database (Supporting Table S5). Figure 4A shows that the LiGEP algorithm could clearly distinguish a liver and a nonliver. In particular, in 50 normal liver samples, the LiGEP algorithm score exhibited >98% liver similarity, but we observed a low percentage in nonliver tissues (680 samples) (Fig. 4A; Supporting Table S5). Additionally, the results of 730 normal samples assessed using the LiGEP algorithm exhibited 99% sensitivity and 88% specificity (P < 2.2 × 10⁻¹⁶). Therefore, we suggest that the LiGEP algorithm has high accuracy to distinguish between liver and nonliver and may be used to calculate the liver similarity of in vitro hPSC‐HLCs or hepatocyte 3D cultures.
Figure 4.
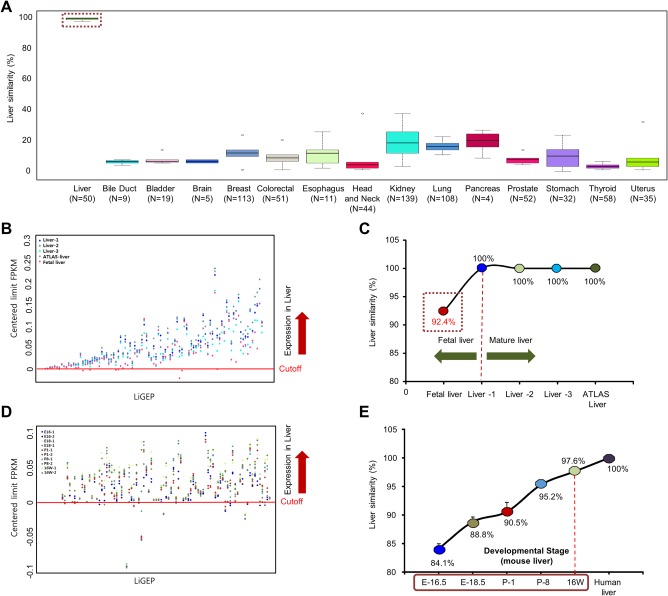
The LiGEP algorithm represents the developmental stage of liver. (A) Distribution of LiGEP algorithm scores in TCGA normal data. Healthy human organ RNA‐seq data were downloaded from the TCGA cohort. A box plot shows the interquartile range of LiGEP algorithm scores in 15 tissue types. Liver samples (n = 50) and other tissue samples (n = 680) are used to assess the accuracy of the LiGEP algorithm. (B) LiGEP algorithm analysis between liver and fetal liver. Red dots represent the LiGEP expression of fetal liver, and the red line represents the criteria for distinguishing between liver and nonliver. (C) Liver similarity by the LiGEP algorithm of clinical liver samples (livers 1‐3), ATLAS liver, and fetal liver. (D) Results of the LiGEP algorithm with each liver developmental stage. The dot means the genes passed over LiGEP criteria for distinguishing liver. (E) Liver similarity using the LiGEP algorithm for each liver developmental stage in mice.
THE LiGEP ALGORITHM REFLECTS THE DEVELOPMENTAL STATUS OF THE LIVER
The transcriptional programs of the liver change during development and aging. The changes in gene expression profiles include genes whose products have critical roles in the fetal liver but are down‐regulated during adulthood.21 Therefore, we examined whether LiGEP can provide information to the researcher about the developmental status of the liver. The LiGEP algorithm was performed using RNA‐Seq results of adult and fetal livers. We calculated a cutoff value (standard, red line in Fig. 4B,D) to distinguish between liver and other tissues using the LiGEP algorithm. Given that the value is different for each gene, we centered the limit to one line that represented a “centered limit FPKM” cutoff line per gene. The cutoff value will help to better understand the expression locations of 93 genes in the LiGEP (Fig. 4B). The distribution of the total expression level of the LiGEP in fetal liver was reduced compared with that of adult liver clinical samples in box‐plot analysis (Supporting Fig. S2A) and revealed 92.4% liver similarity (Fig. 4C). As a result, 86 genes from the LiGEP were detected in the liver area (passed red line), but AKR1C4, C5orf27, CXCL2, CYP2C8, HSD11B1, HSD17B13, and SLC22A1 were not included. In particular, drug and xenobiotic metabolism–related genes (AKR1C4, CYP2C8, HSD11B1, and HSD17B13) were significantly expressed in the adult liver, and SIC22A1 was enriched in the adult liver to act as a xenobiotic compound transporter.22, 23, 24 Therefore, we concluded that the developmental process of the fetal liver has not yet achieved perfection and that the LiGEP algorithm demonstrated its potential as a “developmental indicator” of liver‐specific cells.
Next, to confirm whether LiGEP represented the developmental stage of developmental liver tissues, we established a hypothesis as shown in Supporting Fig. S3. In mouse liver development, the percentage of liver similarity, as analyzed using the LiGEP algorithm, may gradually increase according to the developmental stage of the liver. The 93 genes of the LiGEP were matched with 85 mouse orthologous genes using InParanoid, which focuses on pairwise orthologous relationships (Supporting Table S6). In an RNA‐Seq analysis of mouse livers at embryonic day 16.5/18.5, postnatal day 1/8, and 16 weeks, the total expression of the LiGEP gradually increased in the box plot depending on the developmental stage (Supporting Fig. S2B). Additionally, the results of the LiGEP algorithm indicated that the fetal liver at embryonic day 16.5 had scores of 84.7% and 83.5% compared with human liver, and 16‐week livers had a score of 97.6% (Fig. 4E). Therefore, we found that the percentage of the LiGEP algorithm at each stage was correlated with liver developmental stages in mice, and we could predict the liver developmental stage using the LiGEP algorithm.
LiGEP REPRESENTS THE LIVER SIMILARITY OF HEPATOCYTE 3D CULTURES AND hPSC‐HLCs
The current technology for in vitro liver cell culture can be divided into three methods. The first method is an aggregate culture system for liver 3D culture, such as mammospheres, micromasses, and spheroids.1 Alternatively, cells are grown on several scaffold materials or are embedded in a gel.25, 26 Finally, 3D tissue differentiation methods are established from PSCs, such as human iPSCs and ESCs. To assess the use of the LiGEP in in vitro liver cell culture, we performed a LiGEP algorithm analysis to estimate liver similarities to 3D cultured cells of HepaRG cells and hPSC‐HLCs.
In our experimental conditions, 3D spheroids were efficiently produced by HepaRG (Fig. 5A, Materials and Methods). In tests of liver characterization, CYP3A4 activity and albumin expression were analyzed. Compared with 2D culture, 3D spheroid cells had higher CYP3A4 activity and albumin expression (Fig. 5B,C). This result suggests that the conditions of 3D culture enhanced the biological properties of HepaRG and that 3D cultured cells were increasingly similar to the composition and architecture in an in vivo–like context of the liver. However, measurement of liver similarity with 2D and 3D cultured cells using the LiGEP algorithm provided scores of 40.86% in 2D cultured cells and 59.14% in 3D cultured cells (Fig. 5D).
Figure 5.
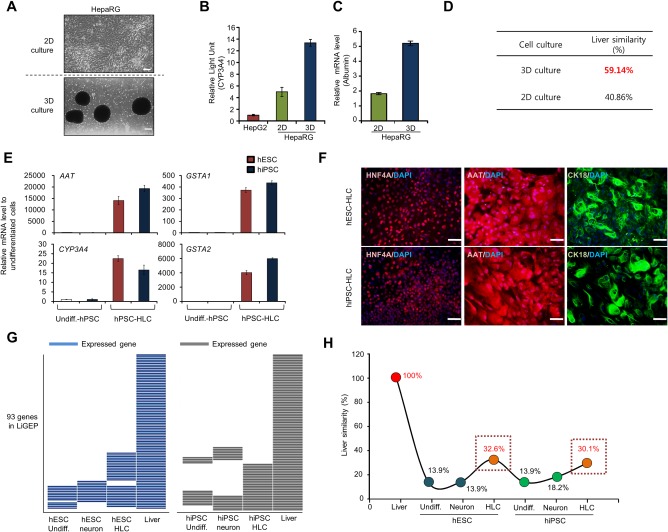
LiGEP indicates liver similarity of 3D culture and hPSC‐derived HLCs. (A) Morphology of 2D and 3D HepaRG cells and spheroids. HepaRG cells were dropped onto the culture plates. Spheroids were formed by the hanging drop method for 48 hours and then transferred to suspension culture tubes, and spheroid formation was monitored by light microscopy. Scale bar, 200 μm. (B) CYP3A4 enzyme activity in 2D (n = 3, pooled) and 3D (n = 6, pooled) cultures. The data, reported as relative light units, were normalized to the DNA content of hepatocytes. (C) Albumin expression between 2D and 3D cultures. The mRNA level of the albumin gene was measured by real‐time PCR. Gene expression was normalized to that of glyceraldehyde 3‐phosphate dehydrogenase and compared to that of the control (2D monolayer culture). (D) The result of the LiGEP algorithm with 2D and 3D cultures. Liver similarity of 2D and 3D culture cells by the LiGEP algorithm. (E) Quantitative RT‐PCR analysis of expression of hepatic maturation markers, including alpha‐1 antitrypsin, CYP3A4, and glutathione S‐transferase A1 and A2, was performed in undifferentiated hPSCs and hPSC‐HLCs. (F) Immunocytochemical analysis of hepatocyte‐specific markers (hepatocyte nuclear factor 4 alpha, alpha‐1 antitrypsin, and cytokeratin‐18) in HLCs derived from hESCs and human‐induced pluripotent stem cells. (G,H) LiGEP algorithm with hPSC‐derived HLCs. Expressed genes of LiGEP (G) and liver similarity (H). Abbreviations: AAT, alpha‐1 antitrypsin; CK‐18, cytokeratin 18; DAPI, 4′,6‐diamidino‐2‐phenylindole; GSTA1/2, glutathione S‐transferases A1 and A2; hiPSC, human‐induced PSC; HNF4A, hepatocyte nuclear factor 4 alpha; Undiff., Undifferentiation.
Next, we assessed the hepatic differentiation status of hPSCs using the LiGEP algorithm. We found that hPSCs differentiated into HLCs under the conventional method (Supporting Fig. S4A). The mRNA expression levels of liver‐specific genes by quantitative RT‐PCR revealed that AAT, GSTA1, GSTA2, and metabolism‐related cytochrome P450 enzymes (CYP3A4) were highly up‐regulated after hepatic induction (Fig. 5E). Immunocytochemical analysis demonstrated that hepatic nuclear factor 4 alpha, alpha‐1‐antitrypsin, and cytokeratin 18 expression levels apparently increased 3 weeks after hepatic induction (Fig. 5F). As a negative control for other lineage cell types, we used neural progenitor cells (NPCs) differentiated from hPSCs through the formation of neural spheres (Supporting Fig. S4B). Elevated expression levels of neural markers, including NESTIN, PAX6, NCAM, and OTX2, in NPCs were validated by quantitative RT‐PCR (Supporting Fig. S5A). These hPSC‐derived NPCs were terminally differentiated into neuronal and glial cells, as demonstrated by immunocytochemical analysis of further differentiated NPCs (Supporting Fig. S5B). Dot‐plot analysis revealed that the LiGEP distribution in hESC‐HLCs was similar to that of human iPSCs‐HLCs (Supporting Fig. S6). In addition, we observed the cutoff gene lists during differentiation (Fig. 5G; Supporting Table S7), with respective liver similarity scores of 32.26% and 30.11% (Fig. 5H). However, the scores for the LiGEP algorithm in undifferentiated hPSCs were markedly different and significantly reduced compared with those of hPSC‐HLCs, with the majority of genes below the 0.0 FPKM value and with <14% liver similarity. The LiGEP distribution in hPSC‐NPCs was quite similar to that observed in undifferentiated hPSCs (Fig. 5G,H). Together, the LiGEP algorithm analysis with HepaRG 3D culture and hPSC‐HLCs indicates the differentiation status and quality compared with human liver. In addition, after analysis using the LiGEP algorithm, excluded genes in hPSC‐HLCs may be related to the liver differentiation process. If these genes are introduced into hPSC‐HLCs, the score of the LiGEP algorithm may increase. Using this algorithm, researchers can finally obtain high‐quality hPSC‐HLCs.
Discussion
The liver is an important organ for maintaining various physiological functions, such as control of cholesterol levels, glycolytic/urea metabolism, and blood detoxification. Because the liver is exposed to most bodily toxins, liver disease is directly connected to human mortality. To generate a mature liver in humans, multiple cell types are used, including hepatocytes, Kupffer cells, cholangiocytes, endothelial cells, and stellate cells. Among them, hepatocytes occupy approximately 60% of the total liver cell number. In addition, hepatocytes (1) play important roles in the production of albumin and fibrinogen and (2) are the main site for the synthesis of lipoproteins, transferrin, and glycoproteins.9 Because monolayer cultures are easy to establish and use, the 2D culture of hepatocytes is a convenient model for elucidating molecular liver mechanisms and developing drug screening studies.27 Although the 2D culture of hepatocytes remains a common method, liver‐specific functions, such as metabolic patterns and insulin stimulation, are lost in the monolayer configuration.28, 29 To complement the limitations of 2D culture, 3D cultured hepatocytes have been established, and liver‐specific functions are reflected more accurately in 3D culture systems compared with 2D cultures.3 Thus, 3D cultured hepatocytes are useful models to increase the sensitivity of drug‐induced hepatotoxicity.30 In the therapeutic and medical fields, manufacturing technology of the 3D liver culture system is a hot research topic.
To generate high‐quality liver‐specific cells or organoids, validation methods have been developed. However, several biochemical experiments (western blot, PCR, immunocytochemistry) cannot explain the levels of their maturation and differentiation status compared with human liver. Therefore, quantitative tools are needed to predict the differentiation statuses of differentiated liver cells or 3D cultured cells in various experimental conditions. Thus, in this study, we developed a new analytical system to overcome the limitations of validation regarding the differentiation status of hPSC‐HLCs or hepatocyte 3D cultured cells. For the LiGEP development, we used total RNAs purchased from Clontech. Because 20 tissue total RNAs are mixed‐type RNAs, including both sexes and several ethnic groups, we believe there is a possibility that mixed‐type RNAs may help reduce expression errors between sexes and ethnic groups. Additionally, to validate the LiGEP expression level, we used the Human Protein Atlas database (RNA‐Seq data from 32 human tissues) and confirmed liver‐specific expression levels of 93 components in the LiGEP (Fig. 2).
For biological function, the LiGEP revealed that most genes were associated with the early injury response, bile acid metabolism, and xenobiotic metabolism, which are key liver functions (Fig. 3). It is estimated that the early injury response was identified from functional analysis of the LiGEP given that normal liver functions in the host‐defense response through coagulation and the inflammatory process.31 Furthermore, the liver plays a role in the synthesis of plasma protein, and albumin, fibrinogen alpha chain, and fibrinogen gamma chain were exclusively expressed in the liver. In canonical pathways, farnesoid X receptor/retinoid X receptor activation leads to bile acid regulation with lipoprotein, while bile acid dysregulation is associated with cholestasis and metabolic disorder in the liver.32 Liver X receptor/retinoid X receptor is also involved in lipid metabolism, cholesterol to bile acid catabolism, and inflammation.33 Although several enzymes related to bile acid synthesis are expressed in other tissues, the liver is the only organ in which complete bile acid biosynthesis occurs.34 CYP8B1, the rate‐limiting enzyme of bile acid synthesis, and NTCP and SLCO1B1 (OATP), which are bile acid transporters, were highly expressed in the liver based on LiGEP analysis. For xenobiotic metabolism, CYP1A2, CYP2C8/9, CYP2E1, and FMO3/4 are phase 1 enzymes, whereas UGT2B4/10/15 and SULT2A1 are phase 2 enzymes. The SLCO1B1 (OATP) transporter was exclusively expressed only in the liver LiGEP results. CYP3A4 is abundantly expressed in the liver and the intestine.35 Several representative CYPs, including CYP3A4, CYP1A1, and CYP1B1, were excluded in the LiGEP because they are also expressed extrahepatically. The LiGEP networking analysis revealed that the expression of each liver‐specific gene was influenced by functional crosstalk among steroid metabolism, drug metabolism, and liver lesions. Taken together, we suggest that the LiGEP could present the functional relevance of the liver.
To establish the LiGEP algorithm, we determined the standard gene expression levels of 93 genes to separate nonliver and liver genes. Although several articles present the scope of the average gene expression levels of liver‐specific genes, it is difficult to apply these findings to our study given that variable gene expression levels depend on several culture conditions. Therefore, we changed the analytical points of the LiGEP algorithm from the liver to other tissues, and we counted the genes with greater values than the LiGEP expression levels (red line) in other tissues (Fig. 4B), ultimately calculating the percentages and P values of liver similarity using the LiGEP algorithm. Consequently, 3D cultured HepaRG cells exhibited a 59.14% liver similarity score (Fig. 5D), implying that current technology for the maturation of the liver organoid is insufficient. Practically speaking, the cell numbers of a liver comprise 60% hepatocytes and 40% nonparenchymal cells (Kupffer, stellate, and liver endothelial cells).9 Nonparenchymal cells play important roles in the maintenance of hepatic function. Kupffer cells mainly produce cytokines induced by inflammatory stimuli, exerting paracrine effects on surrounding cells. Stellate cells play a role in extracellular matrix remodeling for injury‐induced recovery.36, 37 Therefore, we could expect that the LiGEP score may not exceed 60%‐70% with hepatocyte 3D culture or hPSC‐HLCs, suggesting that the remaining LiGEP score could reflect the features of nonparenchymal cells. Thus, to increase the LiGEP percentage to 100%, researchers must (1) screen for maturation factors, such as epigenetic factors; (2) develop a mixed‐culture system with Kupffer cells, cholangiocytes, endothelial cells, and stellate cells; and (3) select scaffold materials, such as the development of the liver bud.7 In other words, a high percentage score from the LiGEP algorithm reflects high liver similarity, and high‐quality liver organoids can be used for various systems, such as drug development and disease modeling.
The use of hPSCs to generate tissue‐specific cell populations circumvents the restricted availability of human tissues and cells but requires detailed information on the efficiency of differentiation and the purity of the final cell product for their future applications. Cell differentiation is a complex process, with multiple steps from initial specification to final differentiation.17 Here, we evaluated the differentiation status of hPSC‐HLCs using the LiGEP algorithm. Surprisingly, we found that hPSC‐HLCs were moderately or poorly differentiated under a conventional four‐stage differentiation protocol without further enrichment or sorting methods. These results support the notion that the generation of mature and functional differentiated cells from hPSC cultures is challenging for many cell types, such as hepatocytes, pancreatic endocrine cells, and cardiomyocytes.38, 39, 40 In this context, the development of adequate methodology necessary to assess the differentiation status of hepatocytes has led to advances in the therapeutic applications of hPSC‐HLCs. Therefore, the LiGEP algorithm will be a useful method to measure the developmental status of liver organoids and will lead to better results.
We describe a gene expression–based predictive model for liver‐specific cells and 3D culture that represents a promising resource to study 3D culture and the hepatic lineage specification of stem cells. In addition, the score of the LiGEP algorithm according to each stage of generation can be used as important information to generate high‐quality liver‐specific cells and tissues, and the algorithm is easily applied to several organoid culture systems to assess the differentiation status (Fig. 6).
Figure 6.
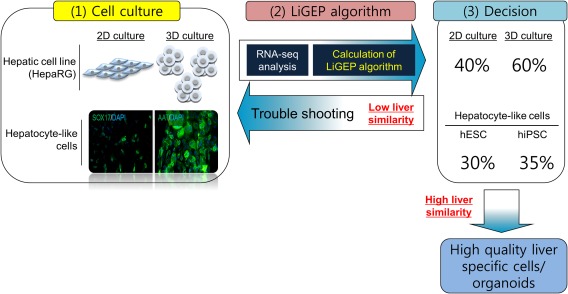
Graphic summary of LiGEP algorithm to assess differentiation of 3D culture and hPSC‐derived HLCs. The score of the LiGEP algorithm according to each stage of generation can be used as important information to generate high‐quality liver organoids. Low percentage scores of the LiGEP algorithm mean that the quality of the 3D culture/hPSC‐derived HLCs is not high. To increase the quality of the liver organoid, the pipeline (organoid generation–LiGEP algorithm) must be performed.
Author names in bold designate shared co‐first authorship
Supporting information
Additional Supporting Information may be found at onlinelibrary.wiley.com/doi/10.1002/hep.29324/suppinfo.
Supporting Information
Potential conflict of interest: Nothing to report.
Supported by the Basic Science Research Program of the National Research Foundation of Korea funded by the Ministry of Education, Science and Technology (NRF‐2014M3C9A2064619, 2017R1A2B4003757) and by the KRIBB Research Initiative Program.
[The copyright line for this article was changed on November 8, 2017, after original online publication.]
Contributor Information
Cho‐Rok Jung, Email: crjung@kribb.re.kr.
Nam‐Soon Kim, Email: nskim37@kribb.re.kr.
Hyun‐Soo Cho, Email: chohs@kribb.re.kr.
REFERENCES
- 1. Fennema E, Rivron N, Rouwkema J, van Blitterswijk C, de Boer J. Spheroid culture as a tool for creating 3D complex tissues. Trends Biotechnol 2013;31:108‐115. [DOI] [PubMed] [Google Scholar]
- 2. Hynds RE, Giangreco A. Concise review: the relevance of human stem cell–derived organoid models for epithelial translational medicine. Stem Cells 2013;31:417‐422. [DOI] [PMC free article] [PubMed] [Google Scholar]
- 3. Lu Y, Zhang G, Shen C, Uygun K, Yarmush ML, Meng Q. A novel 3D liver organoid system for elucidation of hepatic glucose metabolism. Biotechnol Bioeng 2012;109:595‐604. [DOI] [PMC free article] [PubMed] [Google Scholar]
- 4. Luni C, Serena E, Elvassore N. Human‐on‐chip for therapy development and fundamental science. Curr Opin Biotechnol 2014;25:45‐50. [DOI] [PubMed] [Google Scholar]
- 5. Ramachandran SD, Schirmer K, Munst B, Heinz S, Ghafoory S, Wolfl S, et al. In vitro generation of functional liver organoid‐like structures using adult human cells. PLoS One 2015;10:e0139345. [DOI] [PMC free article] [PubMed] [Google Scholar]
- 6. Lancaster MA, Knoblich JA. Organogenesis in a dish: modeling development and disease using organoid technologies. Science 2014;345:1247125. [DOI] [PubMed] [Google Scholar]
- 7. Takebe T, Sekine K, Enomura M, Koike H, Kimura M, Ogaeri T, et al. Vascularized and functional human liver from an iPSC‐derived organ bud transplant. Nature 2013;499:481‐484. [DOI] [PubMed] [Google Scholar]
- 8. Xinaris C, Brizi V, Remuzzi G. Organoid models and applications in biomedical research. Nephron 2015;130:191‐199. [DOI] [PubMed] [Google Scholar]
- 9. Gordillo M, Evans T, Gouon‐Evans V. Orchestrating liver development. Development 2015;142:2094‐2108. [DOI] [PMC free article] [PubMed] [Google Scholar]
- 10. Volarevic V, Nurkovic J, Arsenijevic N, Stojkovic M. Concise review: therapeutic potential of mesenchymal stem cells for the treatment of acute liver failure and cirrhosis. Stem Cells 2014;32:2818‐2823. [DOI] [PubMed] [Google Scholar]
- 11. Choi SM, Kim Y, Shim JS, Park JT, Wang RH, Leach SD, et al. Efficient drug screening and gene correction for treating liver disease using patient‐specific stem cells. Hepatology 2013;57:2458‐2468. [DOI] [PMC free article] [PubMed] [Google Scholar]
- 12. Kim HM, Kim JW, Choi Y, Chun HS, Im I, Han YM, et al. Xeno‐sensing activity of the aryl hydrocarbon receptor in human pluripotent stem cell–derived hepatocyte‐like cells. Sci Rep 2016;6:21684. [DOI] [PMC free article] [PubMed] [Google Scholar]
- 13. Keen JC, Moore HM. The Genotype‐Tissue Expression (GTEx) project: linking clinical data with molecular analysis to advance personalized medicine. J Pers Med 2015;5:22‐29. [DOI] [PMC free article] [PubMed] [Google Scholar]
- 14. Uhlen M, Fagerberg L, Hallstrom BM, Lindskog C, Oksvold P, Mardinoglu A, et al. Proteomics. Tissue‐based map of the human proteome. Science 2015;347:1260419. [DOI] [PubMed] [Google Scholar]
- 15. Yu NY, Hallstrom BM, Fagerberg L, Ponten F, Kawaji H, Carninci P, et al. Complementing tissue characterization by integrating transcriptome profiling from the Human Protein Atlas and from the FANTOM5 consortium. Nucleic Acids Res 2015;43:6787‐6798. [DOI] [PMC free article] [PubMed] [Google Scholar]
- 16. Okawa S, del Sol A. A computational strategy for predicting lineage specifiers in stem cell subpopulations. Stem Cell Res 2015;15:427‐434. [DOI] [PubMed] [Google Scholar]
- 17. Zagar L, Mulas F, Garagna S, Zuccotti M, Bellazzi R, Zupan B. Stage prediction of embryonic stem cell differentiation from genome‐wide expression data. Bioinformatics 2011;27:2546‐2553. [DOI] [PubMed] [Google Scholar]
- 18. Son MY, Seol B, Han YM, Cho YS. Comparative receptor tyrosine kinase profiling identifies a novel role for AXL in human stem cell pluripotency. Hum Mol Genet 2014;23:1802‐1816. [DOI] [PubMed] [Google Scholar]
- 19. Son MY, Kwak JE, Kim YD, Cho YS. Proteomic and network analysis of proteins regulated by REX1 in human embryonic stem cells. Proteomics 2015;15:2220‐2229. [DOI] [PubMed] [Google Scholar]
- 20. Cui J, Chen Y, Chou WC, Sun L, Chen L, Suo J, et al. An integrated transcriptomic and computational analysis for biomarker identification in gastric cancer. Nucleic Acids Res 2011;39:1197‐1207. [DOI] [PMC free article] [PubMed] [Google Scholar]
- 21. Babovic S, Eaves CJ. Hierarchical organization of fetal and adult hematopoietic stem cells. Exp Cell Res 2014;329:185‐191. [DOI] [PubMed] [Google Scholar]
- 22. Huse SM, Gruppuso PA, Boekelheide K, Sanders JA. Patterns of gene expression and DNA methylation in human fetal and adult liver. BMC Genomics 2015;16:981. [DOI] [PMC free article] [PubMed] [Google Scholar]
- 23. Li C, Yu S, Zhong X, Wu J, Li X. Transcriptome comparison between fetal and adult mouse livers: implications for circadian clock mechanisms. PLoS One 2012;7:e31292. [DOI] [PMC free article] [PubMed] [Google Scholar]
- 24. Lozano E, Herraez E, Briz O, Robledo VS, Hernandez‐Iglesias J, Gonzalez‐Hernandez A, et al. Role of the plasma membrane transporter of organic cations OCT1 and its genetic variants in modern liver pharmacology. Biomed Res Int 2013;2013:692071. [DOI] [PMC free article] [PubMed] [Google Scholar]
- 25. Moroni L, de Wijn JR, van Blitterswijk CA. Integrating novel technologies to fabricate smart scaffolds. J Biomater Sci Polym Ed 2008;19:543‐572. [DOI] [PubMed] [Google Scholar]
- 26. Slaughter BV, Khurshid SS, Fisher OZ, Khademhosseini A, Peppas NA. Hydrogels in regenerative medicine. Adv Mater 2009;21:3307‐3329. [DOI] [PMC free article] [PubMed] [Google Scholar]
- 27. Dash A, Inman W, Hoffmaster K, Sevidal S, Kelly J, Obach RS, et al. Liver tissue engineering in the evaluation of drug safety. Expert Opin Drug Metab Toxicol 2009;5:1159‐1174. [DOI] [PMC free article] [PubMed] [Google Scholar]
- 28. Brandon EF, Raap CD, Meijerman I, Beijnen JH, Schellens JH. An update on in vitro test methods in human hepatic drug biotransformation research: pros and cons. Toxicol Appl Pharmacol 2003;189:233‐246. [DOI] [PubMed] [Google Scholar]
- 29. Hansson PK, Asztely AK, Clapham JC, Schreyer SA. Glucose and fatty acid metabolism in McA‐RH7777 hepatoma cells vs. rat primary hepatocytes: responsiveness to nutrient availability. Biochim Biophys Acta 2004;1684:54‐62. [DOI] [PubMed] [Google Scholar]
- 30. Meng Q. Three‐dimensional culture of hepatocytes for prediction of drug‐induced hepatotoxicity. Expert Opin Drug Metab Toxicol 2010;6:733‐746. [DOI] [PubMed] [Google Scholar]
- 31. Dhainaut JF, Marin N, Mignon A, Vinsonneau C. Hepatic response to sepsis: interaction between coagulation and inflammatory processes. Crit Care Med 2001;29:S42‐47. [DOI] [PubMed] [Google Scholar]
- 32. Grimm SW, Richtand NM, Winter HR, Stams KR, Reele SB. Effects of cytochrome P450 3A modulators ketoconazole and carbamazepine on quetiapine pharmacokinetics. Br J Clin Pharmacol 2006;61:58‐69. [DOI] [PMC free article] [PubMed] [Google Scholar]
- 33. Herzog B, Hallberg M, Seth A, Woods A, White R, Parker MG. The nuclear receptor cofactor, receptor‐interacting protein 140, is required for the regulation of hepatic lipid and glucose metabolism by liver X receptor. Mol Endocrinol 2007;21:2687‐2697. [DOI] [PMC free article] [PubMed] [Google Scholar]
- 34. Russell DW, Setchell KD. Bile acid biosynthesis. Biochemistry 1992;31:4737‐4749. [DOI] [PubMed] [Google Scholar]
- 35. von Richter O, Burk O, Fromm MF, Thon KP, Eichelbaum M, Kivisto KT. Cytochrome P450 3A4 and P‐glycoprotein expression in human small intestinal enterocytes and hepatocytes: a comparative analysis in paired tissue specimens. Clin Pharmacol Ther 2004;75:172‐183. [DOI] [PubMed] [Google Scholar]
- 36. Hautekeete ML, Geerts A. The hepatic stellate (Ito) cell: its role in human liver disease. Virchows Arch 1997;430:195‐207. [DOI] [PubMed] [Google Scholar]
- 37. Malik R, Selden C, Hodgson H. The role of non‐parenchymal cells in liver growth. Semin Cell Dev Biol 2002;13:425‐431. [DOI] [PubMed] [Google Scholar]
- 38. Dolnikov K, Shilkrut M, Zeevi‐Levin N, Danon A, Gerecht‐Nir S, Itskovitz‐Eldor J, et al. Functional properties of human embryonic stem cell‐derived cardiomyocytes. Ann N Y Acad Sci 2005;1047:66‐75. [DOI] [PubMed] [Google Scholar]
- 39. Kroon E, Martinson LA, Kadoya K, Bang AG, Kelly OG, Eliazer S, et al. Pancreatic endoderm derived from human embryonic stem cells generates glucose‐responsive insulin‐secreting cells in vivo . Nat Biotechnol 2008;26:443‐452. [DOI] [PubMed] [Google Scholar]
- 40. Si‐Tayeb K, Noto FK, Nagaoka M, Li J, Battle MA, Duris C, et al. Highly efficient generation of human hepatocyte‐like cells from induced pluripotent stem cells. Hepatology 2010;51:297‐305. [DOI] [PMC free article] [PubMed] [Google Scholar]
Associated Data
This section collects any data citations, data availability statements, or supplementary materials included in this article.
Supplementary Materials
Additional Supporting Information may be found at onlinelibrary.wiley.com/doi/10.1002/hep.29324/suppinfo.
Supporting Information