

Abstract
A translational need exists to understand and predict vancomycin‐induced kidney toxicity. We describe: (i) a vancomycin high‐performance liquid chromatography (HPLC) method for rat plasma and kidney tissue homogenate; (ii) a rat pharmacokinetic (PK) study to demonstrate utility; and (iii) a catheter retention study to enable future preclinical studies. Rat plasma and pup kidney tissue homogenate were analyzed via HPLC for vancomycin concentrations ranging from 3–75 and 15.1–75.5 μg/mL, respectively, using a Kinetex Biphenyl column and gradient elution of water with 0.1% formic acid: acetonitrile (70:30 v/v). Sprague‐Dawley rats (n = 10) receiving 150 mg/kg of vancomycin intraperitoneally had plasma sampled for PK. Finally, a catheter retention study was performed on polyurethane catheters to assess adsorption. Precision was <6.1% for all intra‐assay and interassay HPLC measurements, with >96.3% analyte recovery. A two‐compartment model fit the data well, facilitating PK exposure estimates. Finally, vancomycin was heterogeneously retained by polyurethane catheters.
Study Highlights
WHAT IS THE CURRENT KNOWLEDGE ON THE TOPIC?
✓ Vancomycin is a known nephrotoxin; however, the PK/TD link with kidney injury is ill‐defined. Clinical studies have attempted to define the vancomycin exposures that predict kidney injury, but these studies contain patient covariates that inherently confound results and cannot be untangled with statistical methodologies. Hence, translational preclinical methods are needed.
WHAT QUESTION DID THIS STUDY ADDRESS?
✓ This study sought to deliver a low‐volume vancomycin assay methodology that enables richly sampled rat PK data. It further addressed whether polyurethane catheters could be used for simultaneous dosing and sampling of vancomycin.
WHAT THIS STUDY ADDS TO OUR KNOWLEDGE
✓ A simple, accurate, and precise HPLC methodology for assay for vancomycin in rat plasma and kidney tissue homogenate was produced. The plasma assay facilitates assay with small sample volume (i.e., <50 μL). Polyurethane catheters retain vancomycin; hence, dedicated catheters are necessary for plasma sampling and dosing.
HOW THIS MIGHT CHANGE CLINICAL PHARMACOLOGY OR TRANSLATIONAL SCIENCE
✓ This study enables future translational approaches for preclinical PK studies.
Vancomycin is a guideline‐approved, glycopeptide antibiotic that is frequently used as empiric therapy for many infectious syndromes. It is regarded as the drug of choice in the treatment of infections caused by methicillin‐resistant Staphylococcus aureus and is the single most commonly utilized antibiotic in the hospital setting.1 Vancomycin efficacy has been most closely linked with the ratio of the area under the concentration‐time curve (AUC) relative to the minimum inhibitory concentration of the infecting organism.2, 3
To ensure adequate AUCs and optimize dosing, vancomycin dosing guidelines have suggested that clinicians target trough concentrations between 10 and 15 μg/mL for less severe infections and between 15 and 20 μg/mL for more severe (e.g., bacteremia, pneumonia, meningitis, and endocarditis) infections.3 To achieve these troughs, patients regularly receive total daily vancomycin doses of 15–20 mg/kg every 8–12 h. Although these more aggressive clinical dosing strategies have been associated with improved efficacy,4 increasing rates of acute kidney injury have also been associated with these dosing schemes.5, 6, 7 The clinical literature, however, is often retrospective and not able to determine the exact exposure of vancomycin that triggers kidney injury. Complicating the understanding, clinical dosing results in homogenous exposure profiles, and patient comorbidities impact the ability to identify the true toxicodynamic relationship. Thus, there is a renewed interest in controlled laboratory experiments (e.g., animal models) to best discern mechanistic links between pharmacokinetic (PK) exposures and toxicodynamic outcomes.8, 9, 10, 11, 12 Additionally, there are limited data on toxicity of vancomycin in utero,13 and these analyses were performed before sensitive biomarkers of vancomycin toxicity were available for study.
The purpose of this research was threefold: (i) to develop a simple, accurate, and precise method of measuring vancomycin concentrations in both small‐volume rat plasma and rat pup kidney tissue homogenate (KTH) via high‐performance liquid chromatography (HPLC); (ii) to demonstrated the utility of the assay for estimation of individual animal exposures in a richly sampled rat PK study; and (iii) to determine if vancomycin is retained by polyurethane catheters to best identify the study methods required for future intravenous studies.
METHODS
Chemicals and reagents
For HPLC analysis, vancomycin hydrochloride USP (VHCl) was obtained commercially (Enzo Life Science, San Jose CA) and demonstrated a purity of 99.3%. Caffeine (CA; Alfa Aesar, Ward Hill, MA; purity of 99.7%), acetonitrile, and methanol were purchased from VWR International (Radnor, PA). Formic acid was obtained from Fisher Scientific (Waltham, MA). All solvents used were of HPLC or liquid chromatography tandem mass spectrometry (LC/MS/MS) grade. Clinical grade vancomycin was utilized for animal studies and catheter retention studies (Hospira, Lake Forest, IL). Frozen, nonmedicated, nonimmunized, pooled plasma (anticoagulated with disodium EDTA) from Sprague Dawley rats was procured (BioreclamationIVT, Westbury, NY). Plasma was stored at −80°C until the time of use when it was transferred to −20°C and ultimately thawed in ambient laboratory conditions.
ASSAY
Calibration curve in rat plasma
Stock solutions of VHCl and caffeine (CA) were prepared by accurately weighing and transferring a known quantity of each drug into separate volumetric flasks. Both drugs were dissolved in a mixture of methanol:water (1:1). The CA was used as an internal standard as it was found to be stable with formic acid sample treatment and identifiable within the run time for vancomycin.14 VHCl stock solution was prepared to a final concentration of 1.5 mg/mL. The VHCl was diluted in methanol and was added to rat plasma (40 μL) so as to obtain concentrations of 3, 7.5, 15, 30, 60, and 75 μg/mL and a final volume of 50 μL. The CA was prepared to a final concentration of 1 mg/mL, further diluted in methanol, and added to obtain a concentration of 10 μg/mL. Each standard concentration was mixed with 240 μL of 0.1% formic acid in methanol and centrifuged in Phree phospholipid removal tubes (Phenomenex, Torrence, CA) at 6600 g for 15 min at 4°C. The resultant solution was filtered through 0.2‐micron syringe filters (Macherey Nagel, Bethlehem, PA). The filtrates were then analyzed using the HPLC.
Calibration curve in rat KTH
The rat kidneys were prepared by ultrasonic homogenization. The kidneys were homogenized with water in a 1:3 w:w ratio using a Model 60 Sonic Dismembrator output (Fisher Scientific, Hampton, NH) at 50% power for 3–5 min, until a homogenous solution was obtained. Stock solutions of VHCl and CA were prepared as previously described. VHCl was added to rat KTH (40 μL) so as to obtain concentrations of 15, 30, 45, 60, and 75 μg/mL. The CA was added to rat KTH to obtain a concentration 10 μg/mL. Each standard concentration was mixed with 240 μL of 0.1% FA in methanol and centrifuged in Phree phospholipid removal tubes (Phenomenex) at 6600 g for 15 min at 4°C. The resultant solution was filtered through 0.2‐micron syringe filters (Macherey Nagel). The filtrates were then analyzed using the HPLC.
HPLC methods
An Agilent 1260 series HPLC system (Agilent Technologies, Germany) was used for both spiked plasma and spiked rat KTH with unknowns, using the following equipment and settings. A Kinetex Biphenyl analytical column was used (2.6 μm, 100 A, 50 × 3 mm, Part # 00B‐4622‐Y0, Phenomenex) with a preceding UHPLC guard column (3‐mm ID; Phenomenex). Samples were maintained at 4°C. Column temperature was maintained at 25°C. A gradient method was used to separate the analyte. Gradient composition and run times are provided in Table 1. The mobile phase flow rate was set at 0.5 mL/min. Eluents were analyzed at wavelengths of 198, 220, 230, and 240 nm. Lambda max was utilized to select the optimal wavelength. Chromatograms were integrated using Agilent Chemstation software Rev. B.03.01 software (Waldbronn, Germany). The total run time was truncated at 10 min.
Table 1.
Gradient elution composition
| Time, min | Water containing 0.1% formic acid | Acetonitrile % | Flow rate in mL/min |
|---|---|---|---|
| 0–5 | 100 | 0 | 0.5 |
| 5–8 | 70 | 30 | 0.5 |
| 8–10 | 100 | 0 | 0.5 |
Assay validation
Specificity
Blank rat plasma and blank rat KTH were prepared as described above and analyzed for the assessment of potential interferences due to endogenous substances.
Linearity
Calibration curves were determined for blank rat plasma and for blank rat KTH, using vancomycin concentrations between 3 μg/mL and 75 μg/mL and 15 μg/mL and 75 μg/mL, respectively. These concentrations were utilized to allow for assessment of therapeutic concentrations without the need to dilute the majority of samples. Peak area ratios comparing VHCl to CA were plotted against nominal concentrations of the solutions, and least‐squares linear regression was used to determine the predictive equation.
Precision and accuracy
Intra‐assay precision for plasma was measured by analyzing six replicates of each concentration. Interday assay precision was measured by analyzing six replicates after being stored for 24 h at 20°C. KTH intraday and interday calculations were similar but used three replicates per nominal concentration and were individually prepared on separate days. Precision was calculated as the percentage relative standard deviation (%RSD). Accuracy was expressed as the percentage recovery (%RE) and calculated by dividing the measured value by the known concentration multiplied by 100.
Lower limit of quantitation
The lower limit of quantitation (LLOQ) was defined as a value that resulted in a %RSD <20% at the LLOQ and <15% in the other replicates.15
Catheter retention study to assess adsorption
The VHCl was dissolved in normal saline per manufacturer's instructions (Hospira, Lake Forest, IL) to achieve a concentration of 100 mg/mL. Polyurethane catheters 0.037” OD × 0.023” ID (Micro‐Renathane; Braintree Scientific, Braintree, MA) were sterilized with ethylene oxide. Then 90 mg (i.e., 0.9 mL) of vancomycin solution was advanced through the proximal end of the catheter over a 2‐min period to simulate a slow intravenous push for a 300 gram rat (i.e., 300 mg/kg). The catheter was flushed with 0.25 mL of normal saline. After 2 min, blank rat plasma was drawn through the distal end of the catheter (0.1 mL first to simulate a waste step) using a 1‐mL syringe (Nippro, Bridgewater, NJ) and 23‐gauge needle (BD, Franklin Lakes, NJ). The needle and syringe were then discarded. With a new syringe/needle, 0.125 mL of blank plasma was similarly drawn and stored at −80°C for batch analysis. Another wash step was performed using 0.25 mL of saline and the catheter was locked with 500 units/mL of a heparin/glycerol mixture using a 22‐gauge locking pin and stored at 37°C overnight. The heparin/glycerol solution was withdrawn/discarded after 24 h, and previous steps were repeated to simulate another blood/plasma sample at 24 h. This was completed for 48 h (i.e., 3 sample times), and all experiments were done in triplicate. Plasma samples were thawed and assayed as above for vancomycin. Measured concentrations were compared using one‐way analysis of variance with multiple comparisons adjusted with Bonferroni's multiple comparisons test (Graphpad Prism, version 7.0, La Jolla, CA).
Pharmacokinetic study
Ten male Sprague‐Dawley rats were subset and selected to illustrate the application of the assay.9 Rats weighed 250–350 g (Harlan, Indianapolis, IN) and were housed in a temperature, humidity, and light controlled room, as previously described.9 All procedures and animal care protocols were approved by the Institutional Animal Care and Use Committee at Midwestern University (Downers Grove, IL). All rats received 150 mg/kg/day of vancomycin intraperitoneally as a single daily injection. Rats received 1 day (n = 5) or 3 days (n = 5) of treatment. A rich sampling scheme obtained blood (i.e., 0.25 mL) from a jugular vein catheter using a sterile syringe at the following times: 0 (i.e., predose), 10, 30, 60, 120, 240, and 1,440 min following the final dose. All blood volume removed was replaced with an equal volume of 0.9% normal saline (Abbott Laboratories, North Chicago, IL). Blood was prepared as plasma and stored at −80°C until batch analysis.9 These studies were approved by the Midwestern Institutional Animal Care and Use Committee and the national guide for the care and use of laboratory animals was followed.
Pharmacokinetic model
Similar to previous efforts,9, 16 a two‐compartment PK model was fit to the observed concentration data using the Nonparametric Adaptive Grid algorithm within the Pmetrics package for R (Los Angeles, CA).17 An absorption term (i.e., Ka), a bioavailability term (Fa), and a peritoneal compartment were included to account for intraperitoneal absorption. Maximum a posteriori mean concentrations were calculated and utilized for determining PK exposure parameters.
RESULTS
Assays
Specificity and sensitivity
Among the various wavelengths studied, 198 nm displayed the highest lambda max (data not shown). No significant interfering peaks from endogenous substances in the blank rat plasma and blank rat KTH were observed at the retention time of the analyte or the internal standard, respectively.
Linearity
Calibration curve in blank plasma
A calibration curve in vancomycin‐spiked rat plasma with six replicated concentrations demonstrated linearity from 3 to 75 μg/mL (Table 2). Average retention times of VHCl and CA in plasma were 4.20 and 5.18 min, respectively (Figure 1). The mean regression equation for nominal vancomycin concentrations (i.e., “x”) to integrated area ratios (i.e., “y”) in spiked plasma was found to be y = 0.0043x−0.0088 (R² = 0.9996).
Table 2.
Accuracy and precision in plasma
| Plasma accuracy and precision | ||||||
|---|---|---|---|---|---|---|
| Immediate | Interday (i.e., 24 h at 20°C) | |||||
| Concentration, μg/mL | Measured, mean ± SD | Accuracy, %RE | Precision %RSD | Measured, mean ± SD | Accuracy %RE | Precision %RSD |
| 3 | 3.44 ± 0.211 | 114.37 | 6.11 | 3.66 ± 0.078 | 118.51 | 5.30 |
| 7.5 | 7.54 ± 0.302 | 100.61 | 4.01 | 7.12 ± 0.368 | 97.80 | 5.29 |
| 15 | 14.82 ± 0.313 | 98.95 | 2.11 | 14.36 ± 0.355 | 97.38 | 2.74 |
| 30 | 29.67 ± 1.552 | 99.04 | 5.23 | 30.21 ± 1.658 | 99.90 | 5.20 |
| 59.9 | 59.06 ± 3.49 | 98.56 | 5.91 | 60.30 ± 2.179 | 99.47 | 4.86 |
| 74.9 | 75.71 ± 2.930 | 101.09 | 3.87 | 74.72 ± 1.820 | 100.53 | 3.29 |
| Rat pup KTH accuracy and precision | ||||||
|---|---|---|---|---|---|---|
| 15.1 | 14.55 ± 0.54 | 96.34 | 3.72 | 14.87 ± 0.12 | 98.49 | 0.81 |
| 30.2 | 30.88 ± 0.11 | 102.27 | 0.34 | 30.16 ± 0.26 | 99.87 | 0.87 |
| 45.3 | 45.45 ± 0.71 | 100.32 | 1.57 | 46.08 ± 0.68 | 101.71 | 1.47 |
| 60.4 | 60.27± 0.30 | 99.78 | 0.49 | 59.88 ± 0.21 | 99.14 | 0.35 |
| 75.5 | 75.36 ± 1.10 | 99.81 | 1.46 | 75.51 ± 0.89 | 100.02 | 1.17 |
%RE, percentage recovery; %RSD, percentage relative standard deviation; KTH, kidney tissue homogenate.
Figure 1.

(a) Chromatogram of vancomycin 40 μg/mL in rat plasma. (b) Chromatogram of vancomycin 50 μg/mL and caffeine 10 μg/mL in rat pup kidney tissue homogenate.
Calibration curve in blank rat KTH
A calibration curve in vancomycin‐spiked rat KTH with three replicated concentrations demonstrated linearity from 15.1–75.5 μg/mL (Table 2). Average retention times of VHCl and CA in plasma were 4.37 and 5.22 min, respectively (Figure 1 b). The mean regression equation for nominal vancomycin concentrations (i.e., “x”) to integrated area ratios (i.e., “y”) in spiked KTH was found to be y = 0.006x−0.0342 (R² = 0.9996).
Precision
Rat plasma
Intra‐assay precision (%RSD) was found to range between 2.11% and 6.11% (Table 2). Interday assay precision (%RSD) ranged from 2.74–5.30%.
Rat KTH
Intra‐assay precision (%RSD) was found to range between 0.34% and 3.72% (Table 2). Interday assay precision (%RSD) ranged from 0.35–1.47%.
Accuracy
Rat plasma
The %RE of vancomycin were all >97%. The %RE approached or exceeded 100% in the samples both upon immediate HPLC (Table 2) and with HPLC 24 h after, the plasma was spiked with vancomycin.
Rat KTH
The %RE of vancomycin were all >96% (Table 2). The %RE remained constant intraday and interday.
As both precision and accuracy met the US Food and Drug Administration standards, the lower limit of detection for VHCl was 3.0 μg/mL in plasma and 15.1 μg/mL in KTH for these methods.
Simulated vancomycin catheter retention study
Vancomycin concentrations were a mean (SD) of 17.9 (23.8), 69.1 (91.2), and 59.4 (77.3) μg/mL at time 0, time 24 h, and time 48 h, respectively (Figure 2). All but one sample was measurable (i.e., >LLOQ) indicating adsorption, and there was no statistical difference between concentrations at the three time points (P = 0.66) or when comparing any individual time point to any other time point.
Figure 2.
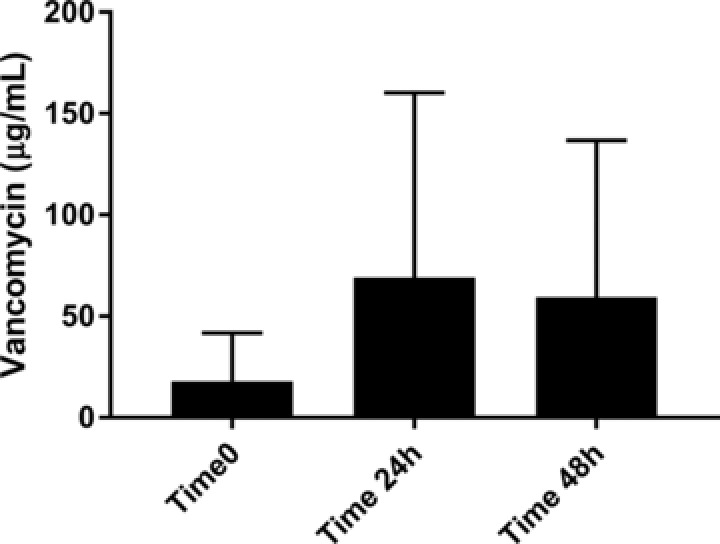
Concentrations observed in simulated blank rat plasma experiment.
Pharmacokinetic study
Observed concentrations for individual rats are shown in Figure 3. A two‐compartment PK model with an absorption term (Ka) fit the observed data well. The Bayesian posterior model exhibited a coefficient of determination of R2 = 0.98, with posterior bias and imprecision of −0.25 μg/mL and 1.05 μg2/mL2, respectively (Figure 4). Analysis of the Bayesian posterior mean predicted concentrations over the first 24 h revealed that the median (interquartile range) peak plasma concentration (Cmax), AUC, and half‐life of vancomycin in the rats were 69.9 μg/mL (range, 30.4–95.2 μg/mL), 254.6 μg/mL*h (range, 194.2–307.0 μg/mL*h), and 1.7 h (range, 1.5–5.9 h), respectively. The PK parameters for the fitted model are reported in Table 3.
Figure 3.

Plasma mean and SEM concentrations for all rats.
Figure 4.

Plasma observed vs. predicted plot for Bayesian predicted individual values. CI, confidence interval.
Table 3.
Pharmacokinetic parameters from the two‐compartment model based on plasma sampling
| Mean | SD | |
|---|---|---|
| Ke | 0.911843 | 0.785514 |
| V | 0.185885 | 0.14991 |
| Ka | 3.946906 | 2.009931 |
| KCP | 45.33389 | 26.78453 |
| KPC | 42.25276 | 31.89025 |
| FA1 | 0.459455 | 0.156658 |
DISCUSSION
Our study describes a simple, accurate, and precise HPLC methodology for assay of vancomycin in both rat plasma and rat KTH. Our method is notable as it allows for utilization of small sample volumes (i.e., 50 μL) within an HPLC methodology and this allows more frequent sampling without compromising host hemodynamics, which could be challenging especially in small animals. We also utilized a biphenyl column as it (i) exhibits retention activity for hydrophilic and aromatic molecules, (ii) functions well for molecules exhibiting hydrophilic and hydrophobic properties, and (iii) is effective with compounds having aromatic character. All of these properties are important for vancomycin and allowed for good and fast separation with acceptable peak symmetry. Additionally, our methodology used a simple phospholipid removal step to facilitate extended column life, which also allowed fewer sample preparation steps as compared with traditional solid phase extraction methods without the need to concentrate samples. We also demonstrated the translational utility of this assay methodology for richly sampled PK studies (i.e., in vivo rat toxicology studies). Large volume samples are not possible in repeated measure small animal studies. The benefits of a richly sampled design are realized in the form of highly accurate individual animal exposures (demonstrated with our Bayesian fitted model (R2 = 0.98)). The highly accurate estimates of individual animal PK is essential for pairing individual animal outcomes, such as renal histopathology or biomarkers, instead of utilizing only group affects for exposure and outcomes. That is, it is not required to pool rat plasma using our method. Each animal can be treated as an individual that has defined vancomycin PK exposures that can be paired with toxicodynamic (TD) response variables. By doing, so that the power is increased, and the number of animals necessary can be reduced. Finally, we have demonstrated that polyurethane catheters retain vancomycin at variable and high concentrations. High concentrations were observed early, so even short translational studies utilizing intravenous dosing require separate dedicated catheters (or lumens) for dosing and sampling.
Vancomycin is the most frequently utilized antibiotic in the hospital setting,1 owing to its ubiquity in national treatment guidelines. Consensus guidelines support dosing designed to attain trough concentrations between 15 and 20 μg/mL,18, 19 and these more aggressive dosing schemes have been associated with improved clinical outcomes.4, 20 However, clinically targeting trough concentrations of 15–20 μg/mL has led to an increased prevalence of vancomycin‐associated renal toxicity.7, 21 To date, no prospective clinical study to our knowledge has elucidated vancomycin exposures that drive kidney injury. The retrospective literature is unable to determine causality and is plagued by homogenous dosing schemes and patient comorbidities that preclude an understanding of the TD relationship. Thus, there is a renewed interest in controlled laboratory experiments (e.g., animal models) to best discern mechanistic links between PK exposures and TD outcomes.
As such, mechanistic studies are underway in rats in order to understand the proximal determinants of vancomycin‐induced renal insult and to identify new strategies aimed at mitigating vancomycin nephrotoxicity.22, 23, 24, 25, 26, 27, 28, 29 These mechanistic pursuits have confirmed a causal link between vancomycin and renal proximal tubule injury; however, exact vancomycin exposures that cause the damage have not yet been clarified. We demonstrated utility of our assay for accurately describing individual animal vancomycin exposures and report plasma PK parameters for vancomycin when given intraperitoneally in a rat model. The highly accurate estimates of individual animal exposures and precise methods of measuring vancomycin concentrations in various matrices are needed to advance the understanding of drug‐exposure toxicity relationships.
Other researchers have developed vancomycin assays for rat plasma using HPLC with UV detection30, 31, 32, 33, 34 and LC/MS/MS.35, 36 Similar to others, our HPLC method for quantifying the concentration of VHCl in rat plasma and rat KTH was found to be highly precise and accurate. Greater than 96% of the VHCl was recovered at concentrations between 3 and 75 μg/mL from rat plasma, and between 15 and 75 μg/mL from rat KTH. Thus, the accuracy from our method is similar to that from the methods of others and is done with less samples (i.e., 50 μL).31, 32, 35, 36 Additionally, our method achieves appropriate intraday and interday assay precision (%RSD 2.11–6.11% and 2.74–5.30%, respectively, for rat plasma immediately and after 24 h and %RSD 0.34–3.72% and 0.35–1.47% for rat KTH interday). Comparatively, our method also has a favorably short run time with sample elution complete by 6 min.31, 32 Our method utilizes HPLC with UV detection, in contrast with other more expensive methods that utilize LC/MS/MS.33, 35, 36, 37 Additionally, it is free of complex sample preparation steps (e.g., protein precipitation and extraction using dichloromethane)35, 38 and procedures, such as column switching.31 The detection range is adequate for translational study as demonstrated with the application to a rat PK model (Figure 3); plasma concentrations <5 μg/mL are not therapeutic, and AUC is the variable of interest.3
Another novel aspect of this study is the analysis of vancomycin adsorption to polyurethane catheters. In rat PK studies, one may use single or multiple (e.g., double) catheters. Double catheters or multiple lumen catheters increase study complexity, but bypass most concerns of drug adsorption to the catheter lumen, because concentrations are not elevated within the dedicated lumen (as in the case of dosing the drug through the catheter). Our results suggest that multiple catheters or multiple lumens are required to avoid spurious concentrations in vancomycin PK studies. These findings have also been noted in the clinical care of patients39, 40; hence, translational studies should likewise keep dedicated catheter lumens for drug administration and sampling.
As with any method, limitations are present. First, calibration curves were linear, precise, and accurate between 3 and 75 μg/mL, but plasma sample concentrations >75 μg/mL will require dilution in blank plasma to bring the sample within the linear range of the assay. However, allometrically scaled doses of vancomycin (such as the dose given in this study, equivalent to 25 mg/kg in a human)41 commonly fall in this range when doses are given intraperitoneally. Dilution of high concentration samples is limited to a 50% reduction. Using 3 μg/mL as an LLOQ is valid as AUC calculations using concentrations from 3 μg/mL to ∞ will exceed 80% of the AUC for the dosing interval.42 For instance, in the subset of rats that received a single day of vancomycin (n = 5), the average predicted 6‐h plasma vancomycin concentration was 5.19 μg/mL with a 6‐h AUC of 242 mg*hr/L. The corresponding 24‐h AUC was 264 mg*hr/L. Thus, >90% of the 24‐h AUC occurred within 6‐h at concentrations well above 3 μg/mL. Second, in lieu of quality control samples,15 a calibration curve was injected every day (using the same nominal concentrations in triplicate) prior to and after the run. Similar to what is reported in the methods, the calibration curve had concentrations that ranged from LLOQ to the high end. All these concentrations fell 15% of their nominal values. Hence, the methods are well suited for research application.
CONCLUSIONS
In conclusion, the described methods were found to be accurate, efficient, and easily applied to translational rat studies. Our method will be useful for future studies of vancomycin PK in rats.
Acknowledgments
Research reported in this publication was supported in part by National Institute of Allergy and Infectious Diseases of the National Institutes of Health under award number R15‐AI105742 and Multidisciplinary grant award from Midwestern University to M.J. and B.G. The content is solely the responsibility of the authors and does not necessarily represent the official views of the National Institutes of Health. Additionally, several supplies were purchased from a start‐up research grant for N.V. from the Chicago College of Pharmacy, Midwestern University, Downers Grove, IL.
Conflict of Interest
The authors declared no conflict of interest.
Author Contributions
M.H.S., M.J., J.N.O., N.V., J.C., H.N., N.J.R., G.P., R.C., and B.G. wrote the manuscript. M.H.S., M.J., and N.V. designed the research. M.H.S., M.J., J.N.O., N.V., J.C., H.N., N.J.R., G.P., and R.C. performed the research. M.H.S., M.J., J.N.O., N.V., and N.J.R. analyzed the data.
References
- 1. Kelesidis, T. et al Indications and types of antibiotic agents used in 6 acute care hospitals, 2009‐2010: a pragmatic retrospective observational study. Infect. Control Hosp. Epidemiol. 37, 70–79 (2016). [DOI] [PMC free article] [PubMed] [Google Scholar]
- 2. Ambrose, P.G. et al Pharmacokinetics‐pharmacodynamics of antimicrobial therapy: it's not just for mice anymore. Clin. Infect. Dis. 44, 79–86 (2007). [DOI] [PubMed] [Google Scholar]
- 3. Rybak, M.J. et al Vancomycin therapeutic guidelines: a summary of consensus recommendations from the infectious diseases Society of America, the American Society of Health‐System Pharmacists, and the Society of Infectious Diseases Pharmacists. Clin. Infect. Dis. 49, 325–327 (2009). [DOI] [PubMed] [Google Scholar]
- 4. Kullar, R. , Davis, S.L. , Taylor, T.N. , Kaye, K.S. & Rybak, M.J. Effects of targeting higher vancomycin trough levels on clinical outcomes and costs in a matched patient cohort. Pharmacotherapy 32, 195–201 (2012). [DOI] [PubMed] [Google Scholar]
- 5. van Hal, S.J. , Paterson, D.L. & Lodise, T.P. Systematic review and meta‐analysis of vancomycin‐induced nephrotoxicity associated with dosing schedules that maintain troughs between 15 and 20 milligrams per liter. Antimicrob. Agents Chemother. 57, 734–744 (2013). [DOI] [PMC free article] [PubMed] [Google Scholar]
- 6. Bosch, K. , McLaughlin, M.M. , Esterly, J.S. , Rhodes, N.J. , Postelnick, M.J. & Scheetz, M.H. Impact of vancomycin treatment duration and dose on kidney injury. Int. J. Antimicrob. Agents 43, 297–298 (2014). [DOI] [PubMed] [Google Scholar]
- 7. Wunderink R.G. et al Linezolid in methicillin‐resistant Staphylococcus aureus nosocomial pneumonia: a randomized, controlled study. Clin. Infect. Dis. 54, 621–629 (2012). [DOI] [PubMed] [Google Scholar]
- 8. Bruniera, F.R. et al Endothelial, renal and hepatic variables in Wistar rats treated with vancomycin. An. Acad. Bras. Cienc. 86, 1963–1972 (2014). [DOI] [PubMed] [Google Scholar]
- 9. Rhodes, N.J. et al Evaluation of vancomycin exposures associated with elevations in novel urinary biomarkers of acute kidney injury in vancomycin‐treated rats. Antimicrob. Agents Chemother. 60, 5742–5751 (2016). [DOI] [PMC free article] [PubMed] [Google Scholar]
- 10. Konishi, H. , Morita, Y. , Mizumura, M. , Iga, I. & Nagai, K. Difference in nephrotoxicity of vancomycin administered once daily and twice daily in rats. J. Chemother. 25, 273–278 (2013). [DOI] [PubMed] [Google Scholar]
- 11. Sabler, I.M. et al Exposure to hyperbaric oxygen intensified vancomycin‐induced nephrotoxicity in rats. PLoS One 11, e0152554 (2016). [DOI] [PMC free article] [PubMed] [Google Scholar]
- 12. Fujiwara, K. , Yoshizaki, Y. , Shin, M. , Miyazaki, T. , Saita, T. & Nagata, S. Immunocytochemistry for vancomycin using a monoclonal antibody that reveals accumulation of the drug in rat kidney and liver. Antimicrob. Agents Chemother. 56, 5883–5891 (2012). [DOI] [PMC free article] [PubMed] [Google Scholar]
- 13. Byrd, R.A. , Grie s, C.L. & Buening, M.K. Developmental toxicology studies of vancomycin hydrochloride administered intravenously to rats and rabbits. Fundam. Appl. Toxicol. 23, 590–597 (1994). [DOI] [PubMed] [Google Scholar]
- 14. Hagihara, M. , Sutherland, C. & Nicolau, D.P. Development of HPLC methods for the determination of vancomycin in human plasma, mouse serum and bronchoalveolar lavage fluid. J. Chromatogr. Sci. 51, 201–207 (2013). [DOI] [PubMed] [Google Scholar]
- 15. U.S. Department of Health and Human Services , Food and Drug Administration , Center for Drug Evaluation and Research (CDER) , Center for Veterinary Medicine (CVM) May 2001 . Guidance for Industry Bioanalytical Method Validation. <https://www.fda.gov/downloads/Drugs/Guidances/ucm070107.pdf> (2013).
- 16. O'Donnell, J.N. et al Pharmacokinetics of centhaquin citrate in a rat model. J. Pharm. Pharmacol. 68, 56–62 (2016). [DOI] [PubMed] [Google Scholar]
- 17. Neely, M.N. Laboratory of Applied Pharmacokinetics and Bioinformatics. Pmetrics Model Library [Internet]. Los Angeles, (CA): University of Southern California; c2000‐2015. <http://www.lapk.org/software/Pmetrics/Models/3C_1_D.txt> (2015). Accessed 14 December 2015. [Google Scholar]
- 18. Mandell, L.A. et al Infectious Diseases Society of America/American Thoracic Society consensus guidelines on the management of community‐acquired pneumonia in adults. Clin. Infect. Dis. 44(Suppl 2), S27–S72 (2007). [DOI] [PMC free article] [PubMed] [Google Scholar]
- 19. Tunkel, A.R. et al Practice guidelines for the management of bacterial meningitis. Clin. Infect. Dis. 39, 1267–1284 (2004). [DOI] [PubMed] [Google Scholar]
- 20. Steinmetz, T. , Eliakim‐Raz, N. , Goldberg, E. , Leibovici, L. & Yahav, D. Association of vancomycin serum concentrations with efficacy in patients with MRSA infections: a systematic review and meta‐analysis. Clin. Microbiol. Infect. 21, 665–673 (2015). [DOI] [PubMed] [Google Scholar]
- 21. Kullar R., Davis S.L., Levine D.P. & Rybak M.J. Impact of vancomycin exposure on outcomes in patients with methicillin‐resistant Staphylococcus aureus bacteremia: support for consensus guidelines suggested targets. Clin. Infect. Dis. 52, 975–981 (2011). [DOI] [PubMed] [Google Scholar]
- 22. Celik, I. , Cihangiroglu, M. , Ilhan, N. , Akpolat, N. & Akbulut, H.H. Protective effects of different antioxidants and amrinone on vancomycin‐induced nephrotoxicity. Basic Clin. Pharmacol. Toxicol. 97, 325–332 (2005). [DOI] [PubMed] [Google Scholar]
- 23. Ahmida, M.H. Protective role of curcumin in nephrotoxic oxidative damage induced by vancomycin in rats. Exp. Toxicol. Pathol. 64, 149–153 (2012). [DOI] [PubMed] [Google Scholar]
- 24. Cetin, H. et al Novel evidence suggesting an anti‐oxidant property for erythropoietin on vancomycin‐induced nephrotoxicity in a rat model. Clin. Exp. Pharmacol. Physiol. 34, 1181–1185 (2007). [DOI] [PubMed] [Google Scholar]
- 25. Naghibi, B. , Ghafghazi, T. , Hajhashemi, V. & Talebi, A. Vancomycin‐induced nephrotoxicity in rats: is enzyme elevation a consistent finding in tubular injury? J. Nephrol. 20, 482–488 (2007). [PubMed] [Google Scholar]
- 26. Nishino, Y. et al Targeting superoxide dismutase to renal proximal tubule cells attenuates vancomycin‐induced nephrotoxicity in rats. Free Radic. Res. 37, 373–379 (2003). [DOI] [PubMed] [Google Scholar]
- 27. Ocak, S. , Gorur, S. , Hakverdi, S. , Celik, S. & Erdogan, S. Protective effects of caffeic acid phenethyl ester, vitamin C, vitamin E and N‐acetylcysteine on vancomycin‐induced nephrotoxicity in rats. Basic Clin. Pharmacol. Toxicol. 100, 328–333 (2007). [DOI] [PubMed] [Google Scholar]
- 28. Oktem, F. et al In vivo evidences suggesting the role of oxidative stress in pathogenesis of vancomycin‐induced nephrotoxicity: protection by erdosteine. Toxicology 215, 227–233 (2005). [DOI] [PubMed] [Google Scholar]
- 29. Vaidya, V.S. et al Kidney injury molecule‐1 outperforms traditional biomarkers of kidney injury in preclinical biomarker qualification studies. Nat. Biotechnol. 28, 478–485 (2010). [DOI] [PMC free article] [PubMed] [Google Scholar]
- 30. Jesús Valle, M.J. , López, F.G. & Navarro, A.S. Development and validation of an HPLC method for vancomycin and its application to a pharmacokinetic study. J. Pharm. Biomed. Anal. 48, 835–839 (2008). [DOI] [PubMed] [Google Scholar]
- 31. Saito, M. , Santa, T. , Tsunoda, M. , Hamamoto, H. & Usui, N. An automated analyzer for vancomycin in plasma samples by column‐switching high‐performance liquid chromatography with UV detection. Biomed. Chromatogr. 18, 735–738 (2004). [DOI] [PubMed] [Google Scholar]
- 32. Plock, N. , Buerger, C. & Kloft, C. Successful management of discovered pH dependence in vancomycin recovery studies: novel HPLC method for microdialysis and plasma samples. Biomed. Chromatogr. 19, 237–244 (2005). [DOI] [PubMed] [Google Scholar]
- 33. Tariq, A. et al Development and validation of high performance liquid chromatographic method for the simultaneous determination of ceftriaxone and vancomycin in pharmaceutical formulations and biological samples. ScienceAsia 36, 297–304 (2010). [Google Scholar]
- 34. Javorska, L. , Krcmova, L.K. , Solichova, D. , Solich, P. & Kaska, M. Modern methods for vancomycin determination in biological fluids by methods based on high‐performance liquid chromatography–a review. J. Sep. Sci. 39, 6–20 (2016). [DOI] [PubMed] [Google Scholar]
- 35. Cheng, C. et al LC‐MS/MS method development and validation for the determination of polymyxins and vancomycin in rat plasma. J. Chromatogr. B Analyt. Technol. Biomed. Life Sci. 878, 2831–2838 (2010). [DOI] [PubMed] [Google Scholar]
- 36. Shibata, N. , Ishida, M. , Prasad, Y.V. , Gao, W. , Yoshikawa, Y. & Takada, K. Highly sensitive quantification of vancomycin in plasma samples using liquid chromatography‐tandem mass spectrometry and oral bioavailability in rats. J. Chromatogr. B Analyt. Technol. Biomed. Life Sci. 789, 211–218 (2003). [DOI] [PubMed] [Google Scholar]
- 37. Cass, R.T. , Villa, J.S. , Karr, D.E. & Schmidt, D.E. Jr. Rapid bioanalysis of vancomycin in serum and urine by high‐performance liquid chromatography tandem mass spectrometry using on‐line sample extraction and parallel analytical columns. Rapid Commun. Mass Spectrom. 15, 406–412 (2001). [DOI] [PubMed] [Google Scholar]
- 38. Luksa, J. & Marusic, A. Rapid high‐performance liquid chromatographic determination of vancomycin in human plasma. J. Chromatogr. B Biomed. Appl. 667, 277–281 (1995). [DOI] [PubMed] [Google Scholar]
- 39. Naschitz, J.E. , Gagarin, A. & Schor, R.G. Spurious toxic vancomycin levels. Eur. J. Intern. Med. 19, e36–e37 (2008). [DOI] [PubMed] [Google Scholar]
- 40. Wright, D.F. , Al‐Sallami, H.S. , Jackson, P.M. & Reith, D.M. Falsely elevated vancomycin plasma concentrations sampled from central venous implantable catheters (portacaths). Br. J. Clin. Pharmacol. 70, 769–772 (2010). [DOI] [PMC free article] [PubMed] [Google Scholar]
- 41. Guidance for Industry . Estimating the Maximum Safe Starting Dose in Initial Clinical Trials for Therapeutics in Adult Healthy Volunteers. U.S. Department of Health and Human Services, Food and Drug Administration, Center for Drug Evaluation and Research. July 2005 Pharmacology and Toxicology. https://www.fda.gov/downloads/drugs/guidances/ucm078932.pdf (2005).
- 42. Analyses and Displays Associated to Non‐Compartmental Pharmacokinetics ‐ With a Focus on Clinical Trials [press release]. http://www.phusewiki.org/wiki/images/e/ed/PhUSE_CSS_WhitePaper_PK_final_25March2014.pdf PhUSE CSS Development of Standard Scripts for Analysis and Programming Working Group, Created 25 March 2014.