

Summary
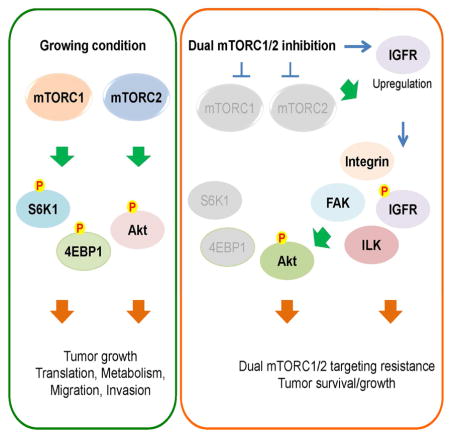
Aberrant signaling by the mammalian target of rapamycin (mTOR) contributes to the devastating features of cancer cells. Thus mTOR is a critical therapeutic target and catalytic inhibitors are being investigated as anti-cancer drugs. Although mTOR inhibitors initially block cell proliferation, cell viability and migration in some cancer cells are quickly restored. Despite sustained inhibition of mTORC1/2 signaling, Akt, a kinase regulating cell survival and migration, regains phosphorylation at its regulatory sites. Mechanistically, mTORC1/2 inhibition promotes reorganization of integrin/focal adhesion kinase-mediated adhesomes, induction of IGFR/IR-dependent PI3K activation and Akt phosphorylation via an integrin/FAK/IGFR-dependent process. This resistance mechanism contributes to xenograft tumor cell growth, which is prevented with mTOR plus IGFR inhibitors, supporting this combination as a therapeutic approach for cancers.
Keywords: dual mTORC1/2 inhibition, Akt, mTORC1, mTORC2, tumor resistance
Graphical Abstract
Introduction
Cells constantly monitor their cellular energetics, pH, redox, metabolism and other critical processes to maintain a homeostatic state required for proper cell growth and survival. Maintaining a proper balance is critical for the precise regulation of gene expression, RNA biogenesis, protein synthesis, protein turnover and overall cell metabolism, processes required for growth and survival. In cancer, deregulation of signaling due to mutation, copy number alteration, overexpression, or mislocalization of proteins disrupts the normal, well-controlled physiological homeostasis, and creates a new, often unstable homeostatic equilibrium. Altered signal transduction and a re-established homeostatic state often provides cancer cells with advantages during periods of environmental stress and enables them to survive and metastasize. However, the reprogramming of cell signaling and metabolism also creates potential cancer cell vulnerabilities. Understanding the basis for cellular adaptation may lead to the development of synthetic lethal targeted therapeutics or combination approaches that target drivers plus potential resistance mechanisms.
Mammalian or mechanistic target of rapamycin (mTOR) is a protein kinase that functions as part of mTOR complex 1 (mTORC1) or mTOR complex 2 (mTORC2). mTORC1 has a major role in integrating nutrient, growth factor/hormone, and stress signaling to regulate cellular metabolism, mRNA translation, cell growth/proliferation, and migration directly or through its effectors. mTORC2 regulates cell proliferation, survival, and motility largely through its effectors Akt, SGK, and PKCα (Su and Jacinto, 2011). In spite of its significant contribution to cancer development and progression, most mTOR studies focus on mTORC1. As a consequence, the regulation and function of mTORC2 is not well understood. The best characterized function of mTORC2 comes from its regulation of Akt through the direct phosphorylation of Ser 473 (S473) in its hydrophobic motif. Another important regulatory site in Akt is Thr 308 (T308) in its activation loop, which is regulated by phosphoinositide-dependent kinase 1 (PDK1). It is generally believed that full activity of Akt requires both S473 and T308 phosphorylation (Guertin et al., 2006; Su and Jacinto, 2011; Sykes et al., 2011; Vadlakonda et al., 2013). Akt phosphorylation at both residues makes Akt five times more active than Akt phosphorylated at T308 alone (Sarbassov et al., 2005). Akt is one of the most prominent molecules in cancer therapeutics because Akt activation is directly linked to cancer cell survival, drug resistance, and poor prognosis and higher mortality for cancer patients (Fruman and Rommel, 2014; Manning and Cantley, 2007).
Work from the last 25 years has revealed how mTORC1 and mTORC2 are regulated and signal in a majority of cancers as the many positive regulators of this pathway (e.g., growth factor receptors, PI3K, Akt, Ras, Raf) are often overexpressed or activated by mutations. Similarly, loss of function or expression of the many negative regulators or mTOR signaling (e.g., PTEN, LKB1, TSC1/TSC2, NF1, and VHL) also contributes to unregulated signaling by one or both of the mTOR complexes. Because of its key role in integrating intracellular and extracellular signaling cues, cancer cells are often addicted to the higher mTOR signaling network (Li et al., 2014b). Thus, mTOR has been extensively studied and considered a prime target for cancer therapy. In this regard, rapamycin analogs (rapalogs; mTORC1 inhibitors) have been approved by the FDA to treat cancers such as renal cell carcinoma. However, like other targeted therapies, rapalogs exhibit disappointingly mild or no effects on most cancers (Benjamin et al., 2011; Li et al., 2014b). We and others have investigated responsiveness to rapamycin and have identified multiple mechanisms that contribute to the observed resistance. For example, rapamycin does not fully inhibit phosphorylation of known mTORC1 substrates such as 4E-BP1, a key regulator of mRNA translation, (Choo et al., 2008; Feldman et al., 2009; Thoreen et al., 2009) and moreover, induces mTORC2-dependent feedback activation of Akt, a potent survival kinase (Dibble et al., 2009; Hsu et al., 2011; Liu et al., 2013; Um et al., 2004; Yu et al., 2011). Therefore, development of dual mTORC1/2 targeting drugs has been regarded as a very promising therapeutic strategy as these drugs will not only completely inhibit mTORC1 but also eliminate mTORC2-dependent drug resistance mechanisms following mTORC1 inhibition. As anticipated, dual mTORC1/2 inhibitors abolish mTORC1/2 activity, Akt phosphorylation at its hydrophobic motif (S473), and greatly diminish tumor burden (Benjamin et al., 2011). Surprisingly however, ablation of both Raptor (a key mTORC1 component) and Rictor (a key mTORC2 component) in muscle shows elevated phosphorylation of Akt at S473 as compared to the control (Bentzinger et al., 2008). This suggests that although mTORC2 is regarded as a major kinase for Akt, mTORC1/2 inhibition may not block Akt phosphorylation in some cell types. Since Akt is a major survival kinase in many types of cancers, this suggests that some cancers may develop Akt-dependent survival strategies following inhibition of mTORC1/2. Based on these observations, we attempted to identify cancer cells that exhibited full to partial resistance to dual mTORC1/2 inhibition with the goal of defining the mechanisms responsible for resistance, which could then predict effective therapies. Here we provide evidence that although mTORC1/2 inhibition blocks cancer cell proliferation and Akt phosphorylation at its hydrophobic motif in several cancer cell lines, others including melanoma cell lines rapidly gain resistance to these inhibitors. Surprisingly, despite continued inhibition of another mTORC2 target SGK, mTORC2-independent phosphorylation of Akt at its hydrophobic motif and activation loop occurs in these cells. We show that mTOR inhibition induces feedback activation of integrin/focal adhesion/IGF1R-mediated pro-survival and pro-invasion signaling pathways. Thus, resistant cells become dependent on these feedback-activated pathways for survival and invasive properties. Indeed, we observed that combining mTORC1/2 and IGFR/IR inhibitors potently blocks tumor growth in vitro and in vivo.
Results
Differential response of cancer cells to mTORC1/2 inhibitors
Because of the physiological and clinical importance of mTOR signaling, we investigated the potency of dual mTORC1/2 inhibition in several cancer cell lines (Fig. S1A). Dual mTORC1/2 inhibition with highly selective Torin1, which has specificity toward mTOR versus 450 kinases tested (Liu et al., 2010), reduced cell proliferation when measured after 2 days of treatment (Fig. S1B). However, when monitoring cell proliferation over several days, many melanoma cell lines including A375, MDA-MB-435, SK-MEL-28, and SK-MEL-19 cells continued to proliferate, whereas proliferation of breast cancer cell lines such as MDA-MB-231, MDA-MB-468, AU565 and HCC1954 was suppressed (Fig. 1A). As shown in Fig. 1B, Torin1 treatment led to inhibition of phosphorylation of mTORC1 downstream targets, S6K1 and S6, in breast cancer cell lines. As expected, Torin1 also inhibited phosphorylation of an mTORC2 substrate, Akt, at the hydrophobic motif site (Ser 473, S473). Using another set of breast cancer cell lines, we consistently observed inhibition of mTORC1 and mTORC2 signaling with Torin1 as evidenced by blocking of phosphorylation of 4E-BP1 and Akt, respectively (Fig. S1C). We next examined signaling in several melanoma cell lines that exhibited varying degrees of resistance to Torin1 treatment. As shown in Fig. 1C, mTORC1/2 inhibition resulted in suppression of mTORC1-mediated 4E-BP1 phosphorylation. Notably, several Torin1-treated melanoma cells displayed similar levels of Akt S473 phosphorylation at 48 h and in some cells as soon as 24 h (Fig. 1C). This was surprising as a main function of mTORC2 is to phosphorylate Akt at S473. To support our inhibitor data, we used mTOR shRNAs in one of the resistant cell lines, A375, to knock down expression of mTOR and examined Akt phosphorylation. As shown in Fig. 1D, Akt S473 phosphorylation was similarly upregulated after mTOR knockdown. Because the breast cancer cell lines we tested did not show any Akt phosphorylation following Torin1 treatment for 48h (Fig. 1B), we asked if longer mTORC1/2 inhibition might reveal recovery of Akt S473 phosphorylation. However, Akt phosphorylation was not observed in these Torin1-treated breast cancer cell lines after 72–96h treatments (Fig. S1D). Given the importance of these observations, we set out to investigate the molecular basis by which resistant melanoma cells acquire the ability to survive and proliferate in the presence of mTORC1/2 inhibitors.
Fig. 1. Akt re-phosphorylation at hydrophobic motif following mTORC1/2 inhibition is mTORC2-independent.

Data are representative of at least three independent experiments. (A) Cancer cell lines were grown in complete media with/without mTOR inhibitor, Torin1 (250 nM). Media and Torin1 were replaced every 2 days and cells were counted at the indicated time points. Data are the means ± SD of three separate experiments performed in triplicate. (B–C) Breast cancer (B) or melanoma (C) cell lines were treated with/without Torin1 (250 nM) for 48 h (B) or for 24 h and 48 h (C). Cells were lysed and immunoblot analysis was performed. (D) Stably knocked down A375 cell lines with mTOR shRNAs were lysed and immunoblot analysis was performed. (E) Tsc2 WT or Tsc2-null MEFs were treated with/without rapamycin (20 ng/ml) or Torin1 (250 nM) for 48 h and immunoblot analysis was performed. (F) WT MEFs were treated with Torin1 (250 nM) for the indicated time points. Cells were lysed and immunoblot analysis was performed. (G) MEFs were treated with Torin1 for 48 h. During this time, cells were treated with Torin1 again for the indicated time. Cells were lysed and immunoblot analysis was performed. See also Fig. S1.
Regulation of Akt phosphorylation following mTOR inhibition
To investigate the resistance mechanism, we made use of mouse embryonic fibroblasts (MEFs) with or without expression of Tsc2, a negative regulator of mTORC1. Tsc2-null MEFs have activated mTORC1 signaling, but lower Akt phosphorylation, due to negative feedback inhibition of mTORC2 by mTORC1. We also used MEFs with or without Rictor, a major component of mTORC2. We first asked whether Akt phosphorylation is similarly re-induced following mTORC1/2 inhibition in MEFs. As expected, rapamycin treatment for 48 h inhibited phosphorylation of S6K1 and S6 (Fig. 1E). However, rapamycin at this time point did not inhibit phosphorylation of 4E-BP1 (Fig. 1E), a regulator of cap-dependent mRNA translation (Silvera et al., 2010). This is consistent with our and other reports that although S6K1 phosphorylation is completely inhibited, 4E-BP1 phosphorylation by mTORC1, is partially to fully resistant to rapamycin in some cell types including Tsc2 null MEFs (Choo et al., 2008; Feldman et al., 2009; Garcia-Martinez et al., 2009; Thoreen et al., 2009). In contrast, Torin1 completely blocked both S6K1 and 4E-BP1 phosphorylation (Fig. 1E), consistent with the observation that Torin1 is a more potent inhibitor of mTORC1 signaling. Remarkably, growing Tsc2 WT cells treated with Torin1 for 48h displayed phospho-Akt levels comparable to control whereas in Tsc2 null cells where Akt phosphorylation is suppressed due to the mTORC1/S6K1-mediated negative feedback loops, we observed increase Akt phosphorylation when these cells were treated with Torin1 (Fig. 1E). As shown in Fig. 1F, Torin1 inhibited Akt phosphorylation initially, however, by 24 hours a gradual increase in Akt phosphorylation was observed. Phosphorylation of S6 and 4E-BP1 remained completely inhibited without showing any rebound following Torin1 treatment (Fig. 1F). Grb10, another mTORC1 substrate which is degraded following mTORC1 inhibition (Yu et al., 2011), also showed a marked decrease by Torin1 treatment that did not recover (Fig. S1E). Inhibition of mTORC1 is also known to decrease IRS phosphorylation at serine residues by feedback mechanisms (Um et al., 2004). Torin1 also dramatically inhibited this phosphorylation without affecting ERK phosphorylation (Fig. S1E). mTORC2 is known to phosphorylate Akt and SGK (serum/glucocorticoid-regulated kinase) at their hydrophobic motif (Garcia-Martinez and Alessi, 2008). Therefore, we determined if SGK phosphorylation at its hydrophobic motif was regulated by mTORC1/2 inhibition. Surprisingly, unlike Akt, SGK1 phosphorylation was continuously blocked by Torin1 (Fig. 1F), suggesting that Torin1 was still inhibiting mTORC2 activity. To determine how long Torin1 is effective in inhibiting S6K1 and 4EBP1 phosphorylation, cells were treated with Torin1 for 60 h and 72 h. As shown in Fig. S1F, no phosphorylation was detected in S6 and 4E-BP1, suggesting that Torin1 is effective for several days in these cells. We also used higher concentrations of Torin1 as well as KU-0063794, another mTORC1/2 specific inhibitor, for 48 h. Even at higher concentrations, recovery of Akt phosphorylation was still observed (Fig. S1G). Because inhibition of Akt phosphorylation by Torin1 was transient (Fig. 1F), we wondered whether re-treatment of cells with Torin1 for short times could inhibit Akt phosphorylation. For this, cells were treated with Torin1 for 24 h and then retreated with Torin1 for 2 h, 12 h, and 24 h. As shown in Fig. 1G, re-treatment of mTOR inhibitors did not inhibit the recovered Akt phosphorylation. We similarly completed this experimental approach with one of the most resistant melanoma cell lines, A375 cells, and found that they also exhibited the same response (Fig. S1H). These results suggest that re-phosphorylation of Akt following mTOR inhibitor treatment is not due to decreased activity of these inhibitors toward mTOR and that Akt re-phosphorylation following mTOR inhibition is mTOR-independent. We also observed that Akt phosphorylation after removal of mTOR inhibitor in growing conditions does not increase significantly, suggesting that restored Akt phosphorylation following mTOR inhibition is not further increased by serum factors (Fig. S1I).
Akt reactivation following mTOR inhibition is not dependent on mTORC2 but does require PI3K-dependent pathway activation
Full activation of Akt requires phosphorylation of its hydrophobic motif at S473 and activation loop at T308. Therefore, we determined if mTOR inhibition also led to phosphorylation at T308, which is mediated by PDK1. As shown in Fig. 2A, phosphorylation at T308 was also gradually increased following mTOR inhibition. Consistent with the notion that Akt phosphorylation at both sites reflects optimal downstream signaling. Indeed, we also observed phosphorylation of FoxO3 after Torin1 treatment (Fig. 2B). To determine if this was through Akt, we knocked down Akt1. As shown in Fig. 2C, knockdown of Akt1 markedly reduced FoxO3 phosphorylation in the presence of Torin1 for 48 h. We also found that repeated treatment of cells with mTORC1/2 inhibitor did not change FoxO3 phosphorylation (Figs. 2D and S2A). We then examined FoxO3 phosphorylation in breast cancer cell lines that do not have restored Akt phosphorylation at S473 following Torin1 treatment. As shown in Fig. S2B, Torin1 treatment did not increase phospho-FoxO3. S473 phosphorylation is also linked to phosphorylation of GSK-3. As shown in Fig. 2E, phosphorylation of GSK-3α and GSK-3β was increased by Torin1 treatment in MEFs and A375 cells. Collectively, these data suggest that restoration of Akt phosphorylation by Torin1 also correlates with Akt reactivation in the absence of mTORC2 signaling.
Fig. 2. mTOR inhibition leads to PI3K-dependent activation of Akt.

Data are representative of at least three independent experiments. (A–B) MEFs and A375 melanoma cell line were treated with Torin1 (250 nM) for the indicated time. Cells were lysed and immunoblot analysis was performed. (C) Control or Akt1 knockdown MEFs were treated with/without Torin1 for 48 h and immunoblot analysis was performed. (D) MEFs were treated with Torin1 for 48 h. During this time, cells were treated with Torin1 again for the indicated time. Cells were lysed and immunoblot analysis was performed. (E) MEFs and A375 were treated with Torin1 for 24 h or 48 h. Cells were lysed and immunoblot analysis was performed. (F) Rictor control or KO MEFs were treated with Torin1 for 48 h. Cells were lysed and immunoblot analysis was performed. (G) MEFs were treated with Torin1 for 24 h. After which, PI3K inhibitors, BKM120 (5 μM) or GDC0941 (3 μM), were treated for another 24 h in the presence of Torin1 and immunoblot analysis was performed. (H) IKKε, TBK1, or IKKε/TBK1 KO MEFs were treated with Torin1 for 48 h and immunoblot analysis was performed. See also Fig. S2.
To genetically exclude mTORC2 activity as participating in the recovery of Akt phosphorylation, we used MEFs without Rictor. As shown in Fig. 2F, Akt phosphorylation at S473 was dramatically decreased in growing Rictor KO MEFs in the absence of mTORC1/2 inhibitor. However, Akt phosphorylation at S473 in Rictor KO MEFs was observed following treatment with Torin1, confirming that mTORC2 is important for S473 phosphorylation in growing conditions, but not responsible for Akt re-phosphorylation following inhibition of mTORC1/2. This was also confirmed with inducible Rictor KO MEFs (Fig. S2C). The most accepted model for Akt phosphorylation at S473 is that PI3K activates mTORC2, which leads to Akt phosphorylation. Although our data show that Akt re-phosphorylation is not dependent on mTORC2, we wondered if PI3K remained involved in this process. We first determined if PI3K was involved in Akt phosphorylation under serum growing conditions in the absence of mTOR inhibitor. As shown in Fig. S2D, inhibition of PI3K blocked Akt phosphorylation at S473. We also found that inhibition of mTOR by Torin1 or KU-0063794 did not induce Akt phosphorylation when PI3K activity was inhibited (Fig. 2G). Since BKM120 inhibits PI3Kα, β, γ, and δ, and GDC0941 inhibits PI3Kα and δ isoforms, our results suggest that PI3Kα and/or δ are involved in mTOR inhibition-mediated Akt re-phosphorylation. We next asked if IKKε and TBK1 were involved in the reactivation as it is known that these kinases can regulate Akt phosphorylation in a PI3K-dependent manner under specific conditions (Mahajan and Mahajan, 2012). Therefore, we used IKKε and TBK1 single or double KO MEFs. As shown in Fig. 2H, Akt phosphorylation was still observed in control cells and KO cells following mTORC1/2 inhibition. Taken together, these results suggest that mTORC1/2 inhibition-mediated Akt re-phosphorylation is mTORC2-independent but PI3K-dependent.
mTORC1/2 inhibition leads to re-organization of focal adhesions and increases cancer cell migration and invasion
To further investigate the mechanisms by which Akt is reactivated in the presence of mTOR catalytic inhibitors, we examined global changes of tyrosine phosphorylation using mass spectrometry based on the fact that PI3Kα and/or δ are mainly regulated by growth factor receptor tyrosine kinases (Thorpe et al., 2015) and with the idea that global changes of tyrosine phosphorylation after mTORC1/2 inhibition could provide additional information on Akt reactivation mechanisms. As shown in Fig. 3A, tyrosine phosphorylation of some proteins was dramatically increased following mTOR inhibition. To identify which tyrosine phosphorylated proteins were changed in response to mTOR inhibition, we pulled down proteins with phospho-tyrosine antibodies and identified them with mass spectrometry. Analysis of these data suggested that the tyrosine phosphorylation of proteins involved in phosphate metabolism and focal adhesion, as well as cell surface receptors, was increased by mTORC1/2 inhibition (Fig. 3B and Fig. S3A). As focal adhesion signaling contributes to cell migration and survival, we examined whether mTORC1/2 inhibition was linked to focal adhesion formation. Using antibodies against vinculin, a focal adhesion marker, we observed reorganized and stronger focal adhesion complexes in cells following mTORC1/2 inhibition (Fig. 3C). Since it is known that both mTORC1 and mTORC2 positively regulate cancer cell motility, invasion, and metastasis (Gulhati et al., 2011; Zhou and Huang, 2011), we wondered if focal adhesion reorganization following mTORC1/2 inhibition could increase or inhibit cell motility. We therefore assessed migration and invasion of melanomas in the presence or absence of mTORC1/2 inhibitor after cells were pre-incubated with or without mTORC1/2 inhibitor for 48 h. Importantly and surprisingly, we found that inhibition of mTORC1/2 accelerated melanoma cell migration (Fig. 3D and S3B) and invasion (Fig. 3E and S3C).
Fig. 3. mTOR inhibition results in re-organization of focal adhesion.

Data are representative of at least three independent experiments. (A) MEFs were treated with Torin1 for 24 h or 48h, and immunoblot analysis was performed using phospho-tyrosine antibodies. (B) MEFs were treated with Torin1 for 36 h, and immunoprecipitation was performed using phospho-tyrosine antibodies. Proteins were separated by SDS-PAGE and analyzed by mass spectrometry. The graph shows functional groups of proteins and numbers of tyrosine phosphorylated proteins changed by Torin1 treatment. (C) A375 cells were treated with Torin1 for 48 h and localization of proteins was visualized by confocal microscopy. Scale bar, 50 μm. Focal adhesion size was measured by Fiji program. (D–E) A375 cells were grown in the presence or absence of Torin1 for 48 h. Migration (D) or invasion (E) assay was performed with/without Torin1 in the upper and lower chambers as describe in Materials and Methods in detail. Data are the means ± S.D. of three separate experiments performed in triplicate. Results were statistically significant (*, p < 0.01) as assessed by t-test. See also Fig. S3.
Integrin α2 and focal adhesion kinase regulate Akt phosphorylation following mTORC1/2 inhibition
Our surprising observations prompted us to focus on focal adhesions following mTORC1/2 inhibition. We were interested in membrane-bound proteins since they regulate focal adhesions and PI3K-dependent pathways. Using mass spectrometry, we determined global changes of membrane-bound proteins following mTORC1/2 inhibition. Interestingly, unlike most proteins whose levels were decreased or not changed following mTORC1/2 inhibition, integrin α2 levels were increased (Fig. S4A). Integrins are essential for focal adhesion formation and mediate inside-out signaling as well as outside-in signaling to induce cell proliferation, survival, and anti-cancer drug resistance (Seguin et al., 2015). As shown in Figs. 4A and S4B, mTORC1/2 inhibition resulted in increased integrin α2 levels. To measure cell surface integrin levels, we used flow cytometry and confirmed that mTORC1/2 inhibition increased cell surface integrin α2 levels (Fig. 4B). Cell surface expression of integrin αV and α5, however, was not changed and decreased, respectively. We next determined if integrin α2 affected Akt phosphorylation. As shown in Figs. 4C, 4D, S4C, and S4D, inhibition of integrin α2 by pharmacological inhibitor or knockdown dramatically suppressed phosphorylation of Akt induced. However, inhibition of integrin α5 did not result in changes of Akt phosphorylation (Figs. 4C and S4E). One of the major kinases in focal adhesion complexes that transduce signals from integrins to downstream targets is focal adhesion kinase (FAK). To determine whether FAK is responsible for Akt phosphorylation, we treated melanoma cell lines with two different FAK inhibitors and shRNAs. As shown in Figs. 4E, 4F, S4F, S4G, and S4H, inhibition of FAK by pharmacological inhibitor or knockdown blocked phosphorylation of Akt following mTOR inhibition in different cell lines. We also examined the effect of integrin α2 or FAK on cell migration and invasion, and found that inhibition of integrin or FAK reduced mTORC1/2 inhibition-mediated cell migration (Fig. 4G) and invasion (Fig. 4H). Combined, these results suggest that integrin and its downstream effector, FAK, are involved in mTOR inhibition-mediated Akt reactivation, cell migration, and invasion.
Fig. 4. Integrin α2 and focal adhesion kinase are involved in mTOR inhibitor-mediated Akt phosphorylation.

Data are representative of at least three independent experiments. (A–B) A375 cells were treated with Torin1 for 48 h, and total (A) or cell surface integrin levels (B) were measured by immunoblot analysis and flow cytometry, respectively. (C) A375 cells were treated with Torin1 for 24 h, after which BTT3033 (20 μM, integrin α2 inhibitor) or SB273005 (5 μM, integrin αV inhibitor) was treated for additional 24 h in the presence of Torin1. Immunoblot analysis was performed. (D) Integrin α2 knockdown A375 cells were treated with Torin1 for 48 h and immunoblot analysis was performed. (E) The same method was used as in (C) except focal adhesion kinase inhibitors, PF431396 (3 μM) or PF573228 (10 μM), were used instead of integrin inhibitors. (F) Focal adhesion kinase (FAK) knockdown A375 cells were treated with Torin1 for 48 h and immunoblot analysis was performed. (G–H) A375 cells were grown in the presence Torin1 for 48 h. Migration (G) or invasion (H) assay was performed with DMSO, BTT3033, PF431396, or PF573228 in the presence of Torin1. Data are the means ± S.D. of three separate experiments. Results were statistically significant (*, p < 0.01) as assessed by t-test. See also Fig. S4.
Akt reactivation following mTOR inhibition is dependent on focal adhesion/IGFR signaling
From the analysis of global changes of tyrosine phosphorylation (Figs. 3A and 3B), we found that IGFR/IR signaling pathways were upregulated by mTORC1/2 inhibition (Fig. 3B). For example, tyrosine phosphorylated IRS, a downstream target of IGFR/IR, was upregulated by Torin1 (Fig. 5A). We found that mTORC1/2 inhibition also dramatically inhibited serine phosphorylation of IRS at a negative regulatory site (Fig. S1E). Finally, levels of membrane-bound IGFR were also increased following Torin1 treatment, which was determined by mass spectrometry (Fig. 5A). Combined, our findings strongly support the conclusion that mTORC1/2 inhibition leads to IRS activation. IGFR/IR signaling is closely linked to focal adhesions as IGFR is a FAK interacting molecule and its activity can be regulated by FAK (Ma, 2011). Therefore, we asked if IGFR/IR signaling was responsible for Akt phosphorylation following mTORC1/2 inhibition. Using pharmacological inhibitors of growth factor receptors, we found that inhibition of IGF1R/IR, but not EGFR or PDGFR, blocked Akt re-phosphorylation mediated by mTOR inhibition (Figs. 5B and S5A). This was supported with a different IGF1R inhibitor and knockdown (Figs. 5C, 5D, and S5B). Finally, as shown in Figs. 5E and S5C, mTORC1/2 inhibition by Torin1 or KU-0063794 profoundly increased IGF1R phosphorylation as well as IGF1R protein levels. Time-dependent examination of IGFR and p-IGFR demonstrated that IGFR phosphorylation was dramatically increased as early as 12 h after mTORC1/2 inhibition in melanoma cells (Fig. 5F). However, IGFR protein levels increased more gradually (Fig. 5F) suggesting two distinct mechanisms for activation of IGFR and induction of IGFR protein levels. Consistent with this conclusion, several melanoma cell lines we tested showed increased IGFR levels, although others did not show a marked increase following mTORC1/2 inhibition (Fig. 5G). However, all cell lines tested exhibited a dramatic increase in p-IGFR levels (Fig. 5G).
Fig. 5. mTORC1/2 inhibition induces FAK/IGFR signaling.

Data are representative of at least three independent experiments. (A) The graphs show changes of tyrosine phosphorylated IRS2 or IGF1R compared to control following Torin1 treatment. (B) A375 cells were treated with Torin1 for 24 h, after which BMS754807 (10 μM, IGFR inhibitor), AZD8931 (10 μM, EGFR inhibitor), Erlotinib (5 μM, EGFR inhibitor), or PDGFR inhibitor III (10 μM) was treated for additional 24 h in the presence of Torin1. Cells were lysed and immunoblot analysis was performed. (C) A375 cells were treated with Torin1 for 24 h, after which two different IGFR inhibitors, BMS754807 (10 μM) and OSI-906 (5 μM), were treated for additional 24 h in the presence of Torin1. After cell lysis, immunoblot analysis was performed. (D) IGF1R knockdown A375 cells were treated with Torin1 for 48 h and immunoblot analysis was performed. (E) A375 cells were treated with Torin1 (250 nM) or KU-0063794 (3 μM) for 48 h and immunoblot analysis was performed. (F) A375 cells were treated with Torin1 (250 nM) for the indicated time. Cells were lysed and immunoblot analysis was performed. (G) Melanoma cell lines were treated with Torin1 for 24 h, after which two different IGFR/IR inhibitors were treated for additional 24 h in the presence of Torin1. Immunoblot analysis was performed. (H–L) A375 cells were treated with Torin1 for 24h, after which inhibitors of integrin α2 (H), FAK (I), IGFR/IR (J), integrin α2 (K), or FAK (L), were treated for additional 24 h in the presence of Torin1. Cells were lysed and immunoblot analysis was performed. (M) Cells were treated with rapamycin (20 ng/ml) or Torin1 (250 nM) for 48h and immunoblot analysis was performed. See also Fig. S5.
We next assessed whether integrin α2 and FAK could regulate IGFR phosphorylation. As shown in Figs. 5H and S5D, inhibition of integrin α2 suppressed IGFR phosphorylation following mTORC1/2 inhibition. We also determined if FAK inhibition led to IGFR inhibition and found that this was the case (Figs. 5I, S5E, and S5F). Interestingly, inhibition of integrin α2 or FAK blocked IGFR phosphorylation dramatically without changing IGFR protein levels, which supports the involvement of these molecules in IGFR activation (Figs 5H, 5I, S5D–S5F). Since T308 phosphorylation in Akt depends on PDK1, which is recruited to the membrane by growth factor receptor activation where it phosphorylates Akt, we wondered if IGFR activation was also responsible for mTORC1/2 inhibition-mediated Akt phosphorylation at T308. As shown in Figs.5J and S5G, pharmacological inhibitors of IGFR also blocked T308 phosphorylation. Since we showed that integrin α2 was involved in IGFR phosphorylation, we determined if inhibition of integrin α2 also blocked Akt phosphorylation at T308. As shown in Figs. 5K and S5H, we found this to be the case. Inhibition of FAK also resulted in blocking of T308 phosphorylation (Figs. 5L and S5I). Next, we analyzed the effect of mTORC1 inhibition by rapamycin on the signaling proteins we were investigating. Interestingly, unlike mTORC1/2 inhibition, treatment of cells with rapamycin, did not much change the levels of p-IGFR, IGFR, or integrin α2 (Figs. 5M and S5J), suggesting differential regulation of the IGF1R signaling network by mTORC1 and mTORC1/2 inhibition. We next questioned whether mTORC2 inactivation alone or inhibition of both mTORC1/2 was required to induce IGFR upregulation. As shown in Fig. S5K and S5L, rictor knockout alone or rapamycin treatment in Rictor knockout MEFs did not increase IGFR, whereas Torin1 treatment of Rictor KO cells still profoundly upregulated IGFR phosphorylation and total levels. Given that rapamycin does not completely inhibit mTORC1 signaling, our observation suggests that a minimum requirement for IGFR upregulation is more complete inhibition of mTORC1 or both mTORC1/2. However, we cannot exclude the possibility that inhibition of free mTOR or largely unknown mTOR complexes such as mTORC3 (Thoreen et al., 2009) could contribute to feedback signaling in the context of mTORC1/2 inhibition. Next, we examined IGFR signaling following mTOR inhibition in melanoma and breast cancer cell lines. As previously shown in Figs. 5F and 5G, mTORC1/2 inhibition resulted in significantly increased IGFR phosphorylation in melanoma cell lines (Fig. S5M). On the contrary, many breast cancer cell lines we tested showed much less phospho-IGFR levels compared to melanoma cell lines (Fig. S5M). Although a few of them increased IGFR phosphorylation (Fig. S5M), still they did not increase Akt phosphorylation at S473 (Figs. 1B and S1C) and FoxO3 phosphorylation (Fig. S2B). Taken together, our results suggest that the response of melanoma cells to mTORC1/2 inhibition involves distinct mechanisms for Akt reactivation that are not present in all cancer types.
Integrin-linked kinase (ILK) regulates Akt phosphorylation following mTORC1/2 inhibition
We further investigated signaling downstream of integrin/FAK/IGFR/PI3K signaling that might regulate Akt phosphorylation at S473. Based on our findings that mTORC1/2 inhibition mediated focal adhesion reorganization, we suspected that integrin-linked kinase (ILK)-dependent pathway might be responsible for Akt phosphorylation at S473. The ILK-dependent pathway is known to regulate Akt phosphorylation at S473 in some conditions, and ILK signaling can be regulated by integrins, focal adhesions, growth factor receptors, and PI3K (Hannigan et al., 2005). To determine if the ILK pathway is involved in Akt phosphorylation following mTORC1/2 inhibition, we first examined the localization of ILK using cells stably expressing ILK. As shown in Fig. 6A, ILK co-localized with vinculin suggesting that ILK is one of the components of focal adhesion complex when mTOR is inhibited. Next, we used ILK −/− MEFs to monitor the involvement of ILK on Akt phosphorylation. As shown in Fig. 6B, Akt S473 phosphorylation was not affected in ILK−/− cells under growing conditions, but mTORC1/2 inhibition failed to stimulate Akt S473 phosphorylation in these cells. Consistent with reduced Akt activation, phosphorylation of FoxO3, a substrate of Akt, was not dramatically influenced by mTORC1/2 inhibition in ILK −/− MEFs (Fig. 6B). To further support these findings, we used two different pharmacological inhibitors of ILK, QLT0267 and Cpd22. We found that inhibition of ILK function did not suppress Akt phosphorylation at S473 in growing cell in the absence of Torin1 (Fig. S6A), but profoundly blocked phosphorylation of Akt at S473 and FoxO3 without dramatic changes of phosphorylation of IGFR or Akt at T308 following mTOR inhibition (Figs. 6C, 6D, S6B, and S6C). Our data are interesting because Rictor KO MEFs exhibited the opposite results – KO of Rictor inhibits S473 phosphorylation of Akt under growing conditions in the absence of mTORC1/2 inhibitors, but does not prevent this phosphorylation following mTORC1/2 inhibition (Figs. 2F and S2C). To confirm that ILK pathway was responsible for Akt phosphorylation at S473 in Rictor KO cells, we treated cells with small molecules that inhibit ILK signaling and found that they profoundly blocked Akt phosphorylation at S473 following mTORC1/2 inhibition (Fig. 6E). Our data support the conclusion that ILK signaling is not a main mechanism for Akt activation under growing conditions where mTORC2 is a major Akt kinase, however Akt re-phosphorylation at S473 following mTORC1/2 inhibition is dependent on ILK-mediated pathways. Taken together, it is likely that integrin/FAK/IGFR/PDK1 regulates Akt phosphorylation at T308 and integrin/FAK/IGFR/ILK-dependent pathway is responsible for Akt phosphorylation at S473 following mTORC1/2 inhibition. We next assessed if ILK was involved in migration and invasion of melanoma. As shown in Figs. 6F and 6G, inhibition of ILK pathways with two different inhibitors significantly decreased tumor migration and invasion.
Fig. 6. ILK-dependent pathway is involved in Akt phosphorylation at hydrophobic motif following mTOR inhibition.

Data are representative of at least three independent experiments. (A) HA-ILK was stably expressed in ILK knockdown A375 cells. The cells were treated with Torin1 for 48 h and localization of HA (ILK) and vinculin was visualized by confocal microscopy. Scale bar, 50 μm. (B) ILK control or KO MEFs were treated with Torin1 for 48 h and immunoblot analysis was performed. (C–D) A375 cells were treated with Torin1 for 24 h, after which ILK inhibitors, QLT0267 (20 μM) (C) or Cpd22 (10 μM) (D), were treated for additional 24 h in the presence of Torin1. Cells were lysed and immunoblot analysis was performed. (E) The same method was used as in (C–D) except Rictor KO MEFs were used instead of A375 cells. (F–G) A375 cells were grown in the presence Torin1 for 48 h, after which migration (F) and invasion (G) assay was performed with DMSO, QLT0267, or Cpd22 in the presence of Torin1. Data are the means ± S.D. of three separate experiments. Results were statistically significant (*, p < 0.01) as assessed by t-test. See also Fig. S6.
Combination of mTORC1/2 and IGFR/IR targeting potently inhibits melanoma progression
To investigate the therapeutic potential of our findings, we investigated the possibility that IGFR/IR inhibitors, several of which are in clinical trials, might be selectively toxic to cancer cells that display this negative feedback resistance mechanism when treated with mTOR inhibitors. To investigate this possibility, we treated cells with inhibitors of mTORC1/2 and/or IGFR/IR. As shown in Figs. 7A and S7A–C, mTOR inhibition or IGFR/IR inhibition alone did not induce marked cell apoptosis. However, the combination mTOR and IGFR/IR inhibitors, even at lower concentrations, dramatically induced melanoma cell death. To investigate the in vivo effects of mTORC1/2 and/or IGFR/IR targeting, we injected melanoma cell lines into mice and treated mice with individual or a combination of inhibitors after the melanomas were established. All mice tolerated the inhibitors at the concentrations used as they did not display significant adverse events or marked differences in mean body weight (Fig. 7B). As shown in Figs. 7C and 7D, IGFR/IR inhibitor alone did not exhibit significant anti-tumor activity. As we observed in vitro, tumor growth was suppressed, but the tumors still grew in the presence of mTORC1/2 inhibitor alone. However, the combination of mTOR and IGFR/IR targeting drugs at lower concentrations than single treatment concentrations, significantly inhibited tumor growth (Fig. 7C and 7D). These results suggest that the combination of mTOR and IGFR/IR targeting drugs is a potent inhibitor of melanoma growth in vitro and in vivo.
Fig. 7. Combinatorial targeting of mTOR and IGFR/IR efficiently block tumor progression.

Data are representative of at least three independent experiments. (A) A375 cells were treated with Torin1 (250 nM for single treatment and 100 nM for combination) and/or BMS754807 (10 μM for single treatment and 5 μM for combination) for 48 h, and apoptosis rate was performed using flow cytometry. Data are the means ± S.D. of three separate experiments. Results were statistically significant (*, p < 0.01) as assessed by t-test. (B–D) Mice were injected with A375 cells and treated with drugs as described in Materials and Methods. Each group had 4 mice with 8 tumor sites. Mouse weight (B) or tumor growth (C) was monitored (*, p < 0.01). Images (D) were taken with four representative tumors from each group. Scale bar, 1 cm. See also Fig. S7.
Discussion
Developing personalized strategies for cancer patients will ultimately provide the best opportunities for successful therapies. Supporting this effort, research over the last 30+ years has identified many of the drivers responsible for the initiation and maintenance of tumor growth as well as the detailed molecular mechanisms regulating or regulated by these drivers. One of the consequences of these research efforts is the identification of candidate therapeutic targets and the development of specific small molecule inhibitors. More recently, what has been firmly established is that cancer cell plasticity is often responsible for the development of resistance to targeted therapies. Understanding the molecular basis of these acquired resistance mechanisms is a critical next step in the continued evolution of precision medicine and cancer therapy.
mTOR is a critical regulator of cancer cell metabolism, growth, migration and survival, and is very often inappropriately regulated in cancer (Laplante and Sabatini, 2012). mTORC1 regulation and signaling has received a significant amount of attention due to its ability to sense intracellular and extracellular cues, and to integrate these inputs into the regulation of metabolic changes required for cancer cell growth and survival (Dibble and Manning, 2013; Gomes and Blenis, 2015). Thus the mTORC1 signaling pathway has become a critical target for cancer therapy. In this regard, the natural product and small molecule rapamycin and its analogs (rapalogs) have been investigated as a promising therapeutic approach for many cancers. However, even in cases where mTORC1 signaling is clearly contributing to the cancer phenotype, rapamycin has been found to be at best cytostatic in some cases and resistance is often observed. Several mechanisms have been identified to account for the observed acquisition of resistance (Dibble et al., 2009; Hsu et al., 2011; Liu et al., 2013; Um et al., 2004; Yu et al., 2011). Thus significant effort has been placed on identifying catalytic inhibitors of mTOR as these will prevent all mTORC1 outputs including the reactivation of the PI3K-mTORC2-Akt pathway due to the suppression of mTORC1-controlled negative feedback. Surprisingly, some examples of resistance to mTOR inhibitors have recently been reported. For example, two reports suggested that some colon cancers are resistant to mTORC1/2 inhibitors and this resistance was correlated with inability of these inhibitors to block 4E-BP1 phosphorylation (Ducker et al., 2014; Zhang and Zheng, 2012). It has also been reported that mTORC1/2 inhibition in some breast cancers led to growth factor receptor-mediated activation of Akt through phosphorylation of T308, although S473 phosphorylation remained completely blocked (Rodrik-Outmezguine et al., 2011). These authors showed that combining EGFR and mTORC1/2 inhibitors reduced breast cancer growth although the mechanism by which mTORC1/2 inhibition induces EGFR activation was not determined (Rodrik-Outmezguine et al., 2011). We did not observe any effect of EGFR inhibition on Akt phosphorylation induced by mTORC1/2 inhibition in melanoma cells.
Here we demonstrate that melanoma cancer cell lines and mouse embryo fibroblasts exhibit rapid development of resistance to mTOR catalytic inhibitors. These surprising observations allowed us to combine genetic, biochemical and pharmacological approaches to define the molecular basis for this rapid resistance reprogramming. Our initial observation was that Akt phosphorylation and signaling to targets such as FoxO3 returned in the presence of inhibitor under conditions where another mTORC2 target, SGK1, remained dephosphorylated. We then utilized Rictor knockout cell lines and found that in the presence of mTOR inhibitors, Akt was again reactivated. IKKε and TBK have also been shown to regulate Akt phosphorylation under some circumstances so we utilized IKKε, TBK, and IKKε/TBK KO cells and still observed reactivation of Akt with mTOR inhibitors. Intrigued by these observations, we set out to determine the molecular basis for resistance with the hope that we might uncover therapeutic strategies that are selectively cytotoxic towards these resistant cells. Here we identify a mechanism for reactivation of the Akt that accounts for continued cell migration and survival in the absence of mTORC2 signaling.
In response to mTOR inhibition we observed formation of cellular adhesomes that not only provide stable connections to extracellular matrix but also transmit extracellular information to intracellular components by recruiting effectors such as FAK and ILK (Hu and Luo, 2013). This led us to investigate and demonstrate that integrin α2 expression was increased in response to mTOR inhibition. Stimulation of integrin and FAK signaling has been associated with IGFR activation (Legate et al., 2009; Ma, 2011) and we show that this pathway is indeed activated in response to mTOR inhibition and requires both integrin α2 and FAK. We next investigated the possibility that ILK might also contribute to Akt phosphorylation. Indeed, using inhibitors of ILK signaling and ILK knockout MEFs, we found that induction of Akt hydrophobic motif S473 phosphorylation was prevented following mTOR inhibition.
These multi-protein focal adhesion complexes and Akt synergistically signal toward downstream targets to regulate cell proliferation, survival, and migration. Our results suggest that inhibition of mTORC1/2 leads to reduction in proliferation rate but induces re-organization of focal adhesions, which are known to mediate drug resistance and cell motility (Eke and Cordes, 2015). The mechanisms through which mTOR inhibition induces adhesome re-organization will require extensive investigation. For example, what are the mechanisms by which inhibition of mTORC1/2 upregulates integrin α2 and IGFR proteins? This question is interesting considering mTOR is a key regulator of mRNA translation (Hsieh et al., 2012; Ma and Blenis, 2009; Thoreen et al., 2012). It has been shown that mTOR inhibition by Torin1 suppresses the translation of nearly all (99.8%) mRNAs to some degree although translation of mRNAs for some transcription factors such as Myc and FoxO, and mRNAs with putative internal ribosomal entry sites (IRES) are resistant to mTOR inhibition (Thoreen et al., 2012). Importantly, cells can switch from cap-dependent translation to cap-independent and IRES-dependent translation of many proteins when cap-dependent translation is suppressed (i. e., under stress conditions such as nutrient limitation, hypoxia, and mTOR inhibition) (Braunstein et al., 2007; Komar and Hatzoglou, 2011; Muranen et al., 2012). Interestingly, IGFR and IR have IRES elements (Giraud et al., 2001; Olson et al., 2013). Therefore, it will be intriguing to determine whether mTOR inhibition switches from cap-dependent to IRES-dependent IGFR/IR induction as part of the resistance mechanism. Along these lines, it will be of clinical importance to identify those proteins whose expression is dependent on cap-independent translation when cap-dependent translation is blocked and if any of these provides resistance mechanisms for cancer cell survival and metastasis. This understanding may lead to the development of more potent drugs for cancer therapeutics. In addition to the reprogramming of protein synthesis under stress conditions, protein degradation also needs to be considered because mTOR has been shown to be important for the control of protein degradation in positive or negative ways (Li et al., 2014a; Zhao et al., 2015). Integrin α2 and IGFR are plasma membrane proteins and one mechanism for regulation of protein expression is through endosomal internalization for degradation or recycling. It is known that mTOR regulates endocytosis of membrane-bound proteins for degradation and/or recycling (Fernandez et al., 2009; Hennig et al., 2006; Thomson et al., 2009). Therefore, it will also be important to determine whether mTOR inhibition regulates trafficking and degradation of proteins that are important for cancer cell resistance, survival, and metastasis.
In summary, we have found that many melanoma cell lines are resistant to inhibition of mTOR with active site inhibitors with regards to cancer cell survival and motility. These data reveal the possibility that mTOR inhibitors may increase the potential of some cancers to continue to survive and metastasize. It is important to investigate this more thoroughly and to reveal those factors that generate this resistance mechanism as mTORC1/2 targeting drugs are now in clinical trials. The identification of the appropriate biomarkers that predict resistance is needed to determine when mTORC1/2 inhibitors can be used to treat cancer patients. Importantly, our findings demonstrate that dual mTORC1/2 inhibition renders melanomas highly dependent on IGFR/IR signaling, thereby sensitizing them to IGFR/IR targeting in combination with mTOR inhibitors.
STAR METHODS
CONTACT FOR REAGENTS AND RESOURCE SHARING
For further information and reagent request, please contact the lead author, John Blenis (jblenis@med.cornell.edu).
EXPERIMENTAL MODEL AND SUBJECT DETAILS
Cell lines
Melanoma cell line, A375, breast cancer cell lines, MDA-MB-231, AU565, MDA-MB-468, HCC1954, BT474, HCC1937, HCC1419, and SKBR3 were obtained from ATCC. SK-MEL-19, SK-MEL-28, and SK-MEL-267 melanoma cells lines were kindly provided by Dr. Paul B. Chapman (Memorial Sloan Kettering Cancer Center, NY). Control and Rictor KO MEFs were kindly provided by Dr. Brendan Manning (Harvard Medical School, MA). Inducible Rictor control and KO MEFs were generously provided by Dr. Michael N. Hall (Univ. of Basel, Switzerland). IKKε, TBK, and IKKε/TBK KO and control MEFs were gifts from Dr. Shizuo Akira (Osaka Univ., Japan). ILK KO and control MEFs were generously provided by Dr. David A. Calderwood (Yale Univ., CT). TSC2 control and KO MEFs were kindly provided by Dr. David J. Kwiatkowski (Harvard Medical School, Boston, MA). 293TD cells, lentiviral packaging and envelope plasmids were a generous gift from Dr. Andrew L. Kung (Dana-Farber Cancer Institute, MA) and Dr. David Baltimore (California Institute of Technology, CA). Breast cancer cell lines, melanoma cell lines, and MEFs were maintained in DMEM containing 10% FBS at 37°C with 5% CO 2.
Mice
Animal studies were performed according to Institutional Animal Care and Use Committee (IACUC)-approved protocols and institutional guidelines. 5-6-week-old female nude mice (Envigo or Taconic) were used.
METHODS DETAILS
Reagents
Anti-phospho-S473-Akt, anti-phospho-T308-Akt, anti-Akt1, anti-total Akt, anti-phospho-4E-BP1, anti-4E-BP1, anti-phospho-S6K1, anti-S6K1, anti-phospho-S6, anti-S6, anti-phospho-FoxO3, anti-FoxO3, anti-phospho-GSK3 α/β, anti-GSK3 α/β, anti-phospho-IGF1R, anti-IGF1R, anti-phospho-IRS, anti-IRS, anti-phospho-ERK1/2, anti-ERK1/2, anti-TSC2, anti-mTOR, anti-Rictor, and anti-phospho-tyrosine antibodies were purchased from Cell Signaling Technology. Anti-phospho-S422-SGK and anti-Grb10 antibodies were obtained from Santa Cruz Biotechnology. Rapamycin, Torin1, Ku-0063794, BKM-120, GDC-0941, AZD8931, Erlotinib, BMS754807, OSI906, PF431396, PF573228, and SB273005 were purchased from Selleckchem. Cpd22 and PDGFR inhibitor III were purchased from Calbiochem. Anti-integrin α2, anti-integrin αV, and anti-integrin α5 antibodies for flow cytometry were obtained from BD Biosciences. BTT3033 and anti-integrin α2 antibodies for immunoblot analysis were obtained from Tocris and SantaCruz Biotechnology, respectively. Anti-actin and anti-vinculin antibodies, N-methyl-2-pyrrolidone, PEG400, and lentiviral shRNA plasmids were purchased from Sigma.
Immunoblot analysis
Cells were lysed with lysis buffer (20 mM HEPES (pH 7.5), 1% Triton X-100, 150 mM NaCl, 10 mM EDTA, 1 mM EGTA, 10 mM β-glycerophosphate, 1 mM sodium orthovanadate, 5 mM NaF, 2 mM phenylmethylsulfonyl fluoride, 2 mg/ml aprotinin, 2 mg/ml leupeptin, and 1mg/ml pepstatin), and samples were resuspended in reducing buffer (6X: 60 mM Tris-HCl pH 6.8, 25% glycerol, 2% SDS, 14.4 mM 2-mercaptoethanol, 0.1% bromophenol blue). Samples were boiled, electrophoresed by SDS-PAGE, and then transferred to nitrocellulose membranes (Whatman). The membranes were blocked with TBST (25 mM Tris-HCl, pH 7.5, 150 mM NaCl, 0.05% Tween 20) containing 5% BSA or 5% nonfat dried milk, and probed overnight with primary antibodies, followed by 2–3 h incubation with secondary antibodies coupled to peroxidase. Blots were developed by using enhanced chemiluminescence.
Plasmids and generation of stable cells
To generate lentivirus, plasmids were transfected into 293TD cells using Lipofectamine 2000 (Thermo Fisher Scientific) with the expression plasmids for packaging (Δ8.9) and envelope (VSVG), and medium was changed the next day. After ~30 h, viral supernatants were harvested, and new medium was added. Viral supernatants were collected the next day. Cells were infected with viral supernatants in the presence of a serum-containing medium supplemented with 8 μg/ml polybrene. Viral-containing medium was removed after 24h and cells were grown in serum-containing medium for another day. Cells were then treated with puromycin (2 μg/ml) for selection. The knockdown efficiency was confirmed by immunoblot analysis.
Mass spectrometry
In gel digestions were performed with sequencing grade modified trypsin (Promega) overnight in 50 mM ammonium bicarbonate at 37°C. Peptides were extracted twice with 50% acetonitrile, 1% formic acid, dried in a speedvac (ThermoFisher), and desalted by solid phase extraction on handmade C18 columns. Desalted peptides were dried in a speedvac then resuspended in 5% formic acid and analyzed by nanospray LC-MS/MS on a Orbitrap Fusion mass spectrometer (ThermoFisher). Peptides were separated by reverse-phase HPLC on a hand-packed column (packed with 40 cm of 1.8 μm, 120 Å pores, Sepax GP-C18, Sepax Technologies, Newark, DE) using a 40 minute gradient of 5–27% buffer B (ACN, 0.1% FA) at a 350 nl/min. Peptides were detected using a Top20 method. For each cycle, one full MS scan of m/z = 3750–1400 was acquired in the Orbitrap at a resolution of 120,000 at m/z with AGC target = 5×10⁵. Each full scan was followed by the selection of up to 20 of the most intense ions for CID and MS/MS analysis in the linear ion trap. Selected ions were excluded from further analysis for 30 s. Ions with charge 1+ or unassigned were also rejected. Maximum ion accumulation times were 100 ms for each full MS scan and 35 ms for MS/MS scans.
MS2 spectra were searched using SEQUEST against a composite database containing the translated sequences of all predicted open reading frames of the mouse genome and their reversed complement, using the following parameters: a precursor mass tolerance of ±20 ppm; 1.0 Da product ion mass tolerance; tryptic digestion; up to two missed cleavages; static modifications of carbamidomethylation on cysteine (+57.0214), and a dynamic modification of methionine oxidation (+15.9949). Peptide spectral matches were filtered to 1% FDR using the target-decoy strategy combined with linear discriminant analysis (LDA) using SEQUEST scoring parameters including Xcorr, ΔCn’, precursor mass error, and charge state.
Flow cytometry
To measure cell apoptosis, the sub-G1 cell population was measured using flow cytometry. Cells were first fixed with ethanol and washed with PBS. Cells were incubated with propidium iodide, and cell cycle analysis was performed by flow cytometry. For the analysis of cell surface integrin levels, cells were trypsinized and washed twice with ice-cold PBS containing 0.2% BSA. Aliquots of cells were incubated for 1 h at 4°C wit h primary antibodies in the PBS/BSA solution. The cells were washed three times with PBS/BSA and then incubated with secondary antibodies coupled to Alexa Fluor (Thermo Fisher Scientific) for 1 h at 4°C. After three washes with PBS/BSA, the cells were resuspended in PBS and analyzed by using a FACScan (Becton Dickinson).
Indirect immunofluorescence microscopy
Cells were plated on cover glasses and incubated with 5% CO2 at 37°C. The cells were fixed with 2% paraformaldehyde for 10 min at room temperature. The cells were rinsed with PBS four times and incubated with a blocking solution containing 3% BSA and 5% serum in PBS for 15 min. The cells were then incubated with specific antibodies in blocking solution for 3 h. The cells were rinsed with PBS four times and incubated with a secondary antibody conjugated to a fluorochrome (Alexa Fluor, Thermo Fisher Scientific) in blocking buffer for 1 h. Cells were rinsed with PBS four times and incubated with Hoechst 33258 solution (DNA staining) for 15 min. After being washed with PBS four times, cells were mounted with mounting buffer (1% propylgallate in a mixture of glycerol and PBS (8:2)) and examined using a Zeiss LSM 880 laser scanning confocal microscope. Focal adhesion was quantified using Fiji program.
Migration and invasion assay
Cells were incubated with or without Torin1 for 48 h in 10 cm plates. Cells were then trypsinized and collected. Media were aspirated, and cells were resuspended in serum free media. For migration assays, media with 10% FBS was added to the bottom chamber of the cell culture inserts. Cells (5 × 10⁴/200 μl) were then added to the top chamber of cell culture inserts (8 μm pore size, BD Biosciences) in a 24-well companion plate. Specifically, cells incubated in 10 cm plates in the absence of Torin1 were used as a control for migration assay that was performed with DMSO (control for inhibitors) in the upper and lower chamber. Cells grown in 10 cm plates in the presence of Torin1 were used with Torin1 and other inhibitors in the upper and lower chamber for migration assay in the cell culture inserts. After 6 h (MDA-MB-435) or 12 h (A375) incubation, the cells that migrated the lower surface of the membrane were fixed with methanol and stained with 0.2% crystal violet in 2% ethanol. The number of cells that had migrated was quantified by counting ten random distinct fields using a light microscope. For cell invasion assays, BD BioCoat invasion chambers coated with Matrigel were used. Invasion chambers were prepared according to the manufacturer’s specifications, and assays were performed as described in migration assays except the assay was performed for 24 h.
Animal studies
Animal studies were performed according to Institutional Animal Care and Use Committee (IACUC)-approved protocols and institutional guidelines. For single or combination drug treatment studies, A375 cells (3×10⁶ cells) were injected subcutaneously into 5-6-week-old female nude mice (Envigo or Taconic). After tumor volume reached ~ 100 mm3, mice were randomly divided into 4 groups for intraperitoneal injection 6 days/week with control, Torin1 (20 mg/kg body weight), BMS-754807 (50 mg/kg body weight), or combination of Torin1 and BMS-754807 (10 mg/kg of Torin1 and 25 mg/kg of BMS-754807). Torin1 was dissolved with N-methyl-2-pyrrolidone, and formulated with N-methyl-2-pyrrolidone: PEG400: water (20%: 40%: 40%). BMS-754807 was dissolved in DMSO, and formulated with DMSO: PEG400: water (5%: 47.5%: 47.5%).
STATISTICAL ANALYSIS
Data obtained from the assays to measure proliferation, migration, invasion, apoptosis, and in vivo tumor growth were statistically analyzed using t-test. Data are means ± S.D. of independent experiments. Detailed methods and P value for statistical significance are described in the figure legends.
Supplementary Material
Acknowledgments
We thank Drs. Paul B. Chapman, Brendan Manning, Michael N. Hall, Shizuo Akira, David A. Calderwood, David J. Kwiatkowski, Andrew L. Kung, and Dr. David Baltimore for generously providing reagents. We are thankful to Dr. Robin Bachelder for helpful discussion and comments on this manuscript. This work was supported by University of Illinois College of Medicine Start-Up fund (S.O. Yoon) and NIH grants GM51405, HL121266, and CA46595 (J. Blenis).
Footnotes
The authors declare no potential conflicts of interest.
Author Contributions
Conceptualization, S.O.Y., S.S., and J.B.; Methodology, S.O.Y., S.S., D.R.P., S.P.G., P.P.R., and N.D.; Resources, S. D., S.P.G., and N.D.; Investigation, S.O.Y., S.S., F.A.K., G.R.B., M.P.J., and N.D.; Writing- Original Draft, S.O.Y. and S.S.; Writing-Review & Editing, S.O.Y., S.S., G.R.B., D.R.P., P.P.R., and J.B.; Funding Acquisition, S.O.Y. and J.B.; Supervision, S.O.Y. and J.B.
Publisher's Disclaimer: This is a PDF file of an unedited manuscript that has been accepted for publication. As a service to our customers we are providing this early version of the manuscript. The manuscript will undergo copyediting, typesetting, and review of the resulting proof before it is published in its final citable form. Please note that during the production process errors may be discovered which could affect the content, and all legal disclaimers that apply to the journal pertain.
References
- Benjamin D, Colombi M, Moroni C, Hall MN. Rapamycin passes the torch: a new generation of mTOR inhibitors. Nat Rev Drug Discov. 2011;10:868–880. doi: 10.1038/nrd3531. [DOI] [PubMed] [Google Scholar]
- Bentzinger CF, Romanino K, Cloetta D, Lin S, Mascarenhas JB, Oliveri F, Xia J, Casanova E, Costa CF, Brink M, et al. Skeletal muscle-specific ablation of raptor, but not of rictor, causes metabolic changes and results in muscle dystrophy. Cell Metab. 2008;8:411–424. doi: 10.1016/j.cmet.2008.10.002. [DOI] [PubMed] [Google Scholar]
- Braunstein S, Karpisheva K, Pola C, Goldberg J, Hochman T, Yee H, Cangiarella J, Arju R, Formenti SC, Schneider RJ. A hypoxia-controlled cap-dependent to cap-independent translation switch in breast cancer. Mol Cell. 2007;28:501–512. doi: 10.1016/j.molcel.2007.10.019. [DOI] [PubMed] [Google Scholar]
- Choo AY, Yoon SO, Kim SG, Roux PP, Blenis J. Rapamycin differentially inhibits S6Ks and 4E-BP1 to mediate cell-type-specific repression of mRNA translation. Proc Natl Acad Sci U S A. 2008;105:17414–17419. doi: 10.1073/pnas.0809136105. [DOI] [PMC free article] [PubMed] [Google Scholar]
- Dibble CC, Asara JM, Manning BD. Characterization of Rictor phosphorylation sites reveals direct regulation of mTOR complex 2 by S6K1. Molecular and cellular biology. 2009;29:5657–5670. doi: 10.1128/MCB.00735-09. [DOI] [PMC free article] [PubMed] [Google Scholar]
- Dibble CC, Manning BD. Signal integration by mTORC1 coordinates nutrient input with biosynthetic output. Nature cell biology. 2013;15:555–564. doi: 10.1038/ncb2763. [DOI] [PMC free article] [PubMed] [Google Scholar]
- Ducker GS, Atreya CE, Simko JP, Hom YK, Matli MR, Benes CH, Hann B, Nakakura EK, Bergsland EK, Donner DB, et al. Incomplete inhibition of phosphorylation of 4E-BP1 as a mechanism of primary resistance to ATP-competitive mTOR inhibitors. Oncogene. 2014;33:1590–1600. doi: 10.1038/onc.2013.92. [DOI] [PMC free article] [PubMed] [Google Scholar]
- Eke I, Cordes N. Focal adhesion signaling and therapy resistance in cancer. Seminars in cancer biology. 2015;31:65–75. doi: 10.1016/j.semcancer.2014.07.009. [DOI] [PubMed] [Google Scholar]
- Feldman ME, Apsel B, Uotila A, Loewith R, Knight ZA, Ruggero D, Shokat KM. Active-site inhibitors of mTOR target rapamycin-resistant outputs of mTORC1 and mTORC2. PLoS biology. 2009;7:e38. doi: 10.1371/journal.pbio.1000038. [DOI] [PMC free article] [PubMed] [Google Scholar]
- Fernandez DR, Telarico T, Bonilla E, Li Q, Banerjee S, Middleton FA, Phillips PE, Crow MK, Oess S, Muller-Esterl W, Perl A. Activation of mammalian target of rapamycin controls the loss of TCRzeta in lupus T cells through HRES-1/Rab4-regulated lysosomal degradation. J Immunol. 2009;182:2063–2073. doi: 10.4049/jimmunol.0803600. [DOI] [PMC free article] [PubMed] [Google Scholar]
- Fruman DA, Rommel C. PI3K and cancer: lessons, challenges and opportunities. Nat Rev Drug Discov. 2014;13:140–156. doi: 10.1038/nrd4204. [DOI] [PMC free article] [PubMed] [Google Scholar]
- Garcia-Martinez JM, Alessi DR. mTOR complex 2 (mTORC2) controls hydrophobic motif phosphorylation and activation of serum- and glucocorticoid-induced protein kinase 1 (SGK1) Biochem J. 2008;416:375–385. doi: 10.1042/BJ20081668. [DOI] [PubMed] [Google Scholar]
- Garcia-Martinez JM, Moran J, Clarke RG, Gray A, Cosulich SC, Chresta CM, Alessi DR. Ku-0063794 is a specific inhibitor of the mammalian target of rapamycin (mTOR) Biochem J. 2009;421:29–42. doi: 10.1042/BJ20090489. [DOI] [PMC free article] [PubMed] [Google Scholar]
- Giraud S, Greco A, Brink M, Diaz JJ, Delafontaine P. Translation initiation of the insulin-like growth factor I receptor mRNA is mediated by an internal ribosome entry site. J Biol Chem. 2001;276:5668–5675. doi: 10.1074/jbc.M005928200. [DOI] [PubMed] [Google Scholar]
- Gomes AP, Blenis J. A nexus for cellular homeostasis: the interplay between metabolic and signal transduction pathways. Current opinion in biotechnology. 2015;34:110–117. doi: 10.1016/j.copbio.2014.12.007. [DOI] [PMC free article] [PubMed] [Google Scholar]
- Guertin DA, Stevens DM, Thoreen CC, Burds AA, Kalaany NY, Moffat J, Brown M, Fitzgerald KJ, Sabatini DM. Ablation in mice of the mTORC components raptor, rictor, or mLST8 reveals that mTORC2 is required for signaling to Akt-FOXO and PKCalpha, but not S6K1. Dev Cell. 2006;11:859–871. doi: 10.1016/j.devcel.2006.10.007. [DOI] [PubMed] [Google Scholar]
- Gulhati P, Bowen KA, Liu J, Stevens PD, Rychahou PG, Chen M, Lee EY, Weiss HL, O’Connor KL, Gao T, Evers BM. mTORC1 and mTORC2 regulate EMT, motility, and metastasis of colorectal cancer via RhoA and Rac1 signaling pathways. Cancer Res. 2011;71:3246–3256. doi: 10.1158/0008-5472.CAN-10-4058. [DOI] [PMC free article] [PubMed] [Google Scholar]
- Hannigan G, Troussard AA, Dedhar S. Integrin-linked kinase: a cancer therapeutic target unique among its ILK. Nat Rev Cancer. 2005;5:51–63. doi: 10.1038/nrc1524. [DOI] [PubMed] [Google Scholar]
- Hennig KM, Colombani J, Neufeld TP. TOR coordinates bulk and targeted endocytosis in the Drosophila melanogaster fat body to regulate cell growth. J Cell Biol. 2006;173:963–974. doi: 10.1083/jcb.200511140. [DOI] [PMC free article] [PubMed] [Google Scholar]
- Hsieh AC, Liu Y, Edlind MP, Ingolia NT, Janes MR, Sher A, Shi EY, Stumpf CR, Christensen C, Bonham MJ, et al. The translational landscape of mTOR signalling steers cancer initiation and metastasis. Nature. 2012;485:55–61. doi: 10.1038/nature10912. [DOI] [PMC free article] [PubMed] [Google Scholar]
- Hsu PP, Kang SA, Rameseder J, Zhang Y, Ottina KA, Lim D, Peterson TR, Choi Y, Gray NS, Yaffe MB, et al. The mTOR-regulated phosphoproteome reveals a mechanism of mTORC1-mediated inhibition of growth factor signaling. Science. 2011;332:1317–1322. doi: 10.1126/science.1199498. [DOI] [PMC free article] [PubMed] [Google Scholar]
- Hu P, Luo BH. Integrin bi-directional signaling across the plasma membrane. J Cell Physiol. 2013;228:306–312. doi: 10.1002/jcp.24154. [DOI] [PubMed] [Google Scholar]
- Komar AA, Hatzoglou M. Cellular IRES-mediated translation: the war of ITAFs in pathophysiological states. Cell Cycle. 2011;10:229–240. doi: 10.4161/cc.10.2.14472. [DOI] [PMC free article] [PubMed] [Google Scholar]
- Laplante M, Sabatini DM. mTOR signaling in growth control and disease. Cell. 2012;149:274–293. doi: 10.1016/j.cell.2012.03.017. [DOI] [PMC free article] [PubMed] [Google Scholar]
- Legate KR, Wickstrom SA, Fassler R. Genetic and cell biological analysis of integrin outside-in signaling. Genes & development. 2009;23:397–418. doi: 10.1101/gad.1758709. [DOI] [PubMed] [Google Scholar]
- Li C, Lee PS, Sun Y, Gu X, Zhang E, Guo Y, Wu CL, Auricchio N, Priolo C, Li J, et al. Estradiol and mTORC2 cooperate to enhance prostaglandin biosynthesis and tumorigenesis in TSC2-deficient LAM cells. J Exp Med. 2014a;211:15–28. doi: 10.1084/jem.20131080. [DOI] [PMC free article] [PubMed] [Google Scholar]
- Li J, Kim SG, Blenis J. Rapamycin: one drug, many effects. Cell Metab. 2014b;19:373–379. doi: 10.1016/j.cmet.2014.01.001. [DOI] [PMC free article] [PubMed] [Google Scholar]
- Liu P, Gan W, Inuzuka H, Lazorchak AS, Gao D, Arojo O, Liu D, Wan L, Zhai B, Yu Y, et al. Sin1 phosphorylation impairs mTORC2 complex integrity and inhibits downstream Akt signalling to suppress tumorigenesis. Nature cell biology. 2013;15:1340–1350. doi: 10.1038/ncb2860. [DOI] [PMC free article] [PubMed] [Google Scholar]
- Liu Q, Chang JW, Wang J, Kang SA, Thoreen CC, Markhard A, Hur W, Zhang J, Sim T, Sabatini DM, Gray NS. Discovery of 1-(4-(4-propionylpiperazin-1-yl)-3-(trifluoromethyl)phenyl)-9-(quinolin-3-yl)benz o[h][1,6]naphthyridin-2(1H)-one as a highly potent, selective mammalian target of rapamycin (mTOR) inhibitor for the treatment of cancer. J Med Chem. 2010;53:7146–7155. doi: 10.1021/jm101144f. [DOI] [PMC free article] [PubMed] [Google Scholar]
- Ma WW. Development of focal adhesion kinase inhibitors in cancer therapy. Anticancer Agents Med Chem. 2011;11:638–642. doi: 10.2174/187152011796817628. [DOI] [PubMed] [Google Scholar]
- Ma XM, Blenis J. Molecular mechanisms of mTOR-mediated translational control. Nat Rev Mol Cell Biol. 2009;10:307–318. doi: 10.1038/nrm2672. [DOI] [PubMed] [Google Scholar]
- Mahajan K, Mahajan NP. PI3K-independent AKT activation in cancers: a treasure trove for novel therapeutics. J Cell Physiol. 2012;227:3178–3184. doi: 10.1002/jcp.24065. [DOI] [PMC free article] [PubMed] [Google Scholar]
- Manning BD, Cantley LC. AKT/PKB signaling: navigating downstream. Cell. 2007;129:1261–1274. doi: 10.1016/j.cell.2007.06.009. [DOI] [PMC free article] [PubMed] [Google Scholar]
- Muranen T, Selfors LM, Worster DT, Iwanicki MP, Song L, Morales FC, Gao S, Mills GB, Brugge JS. Inhibition of PI3K/mTOR leads to adaptive resistance in matrix-attached cancer cells. Cancer Cell. 2012;21:227–239. doi: 10.1016/j.ccr.2011.12.024. [DOI] [PMC free article] [PubMed] [Google Scholar]
- Olson CM, Donovan MR, Spellberg MJ, Marr MT., 2nd The insulin receptor cellular IRES confers resistance to eIF4A inhibition. Elife. 2013;2:e00542. doi: 10.7554/eLife.00542. [DOI] [PMC free article] [PubMed] [Google Scholar]
- Rodrik-Outmezguine VS, Chandarlapaty S, Pagano NC, Poulikakos PI, Scaltriti M, Moskatel E, Baselga J, Guichard S, Rosen N. mTOR kinase inhibition causes feedback-dependent biphasic regulation of AKT signaling. Cancer Discov. 2011;1:248–259. doi: 10.1158/2159-8290.CD-11-0085. [DOI] [PMC free article] [PubMed] [Google Scholar]
- Sarbassov DD, Guertin DA, Ali SM, Sabatini DM. Phosphorylation and regulation of Akt/PKB by the rictor-mTOR complex. Science. 2005;307:1098–1101. doi: 10.1126/science.1106148. [DOI] [PubMed] [Google Scholar]
- Seguin L, Desgrosellier JS, Weis SM, Cheresh DA. Integrins and cancer: regulators of cancer stemness, metastasis, and drug resistance. Trends Cell Biol. 2015;25:234–240. doi: 10.1016/j.tcb.2014.12.006. [DOI] [PMC free article] [PubMed] [Google Scholar]
- Silvera D, Formenti SC, Schneider RJ. Translational control in cancer. Nat Rev Cancer. 2010;10:254–266. doi: 10.1038/nrc2824. [DOI] [PubMed] [Google Scholar]
- Su B, Jacinto E. Mammalian TOR signaling to the AGC kinases. Crit Rev Biochem Mol Biol. 2011;46:527–547. doi: 10.3109/10409238.2011.618113. [DOI] [PMC free article] [PubMed] [Google Scholar]
- Sykes SM, Lane SW, Bullinger L, Kalaitzidis D, Yusuf R, Saez B, Ferraro F, Mercier F, Singh H, Brumme KM, et al. AKT/FOXO signaling enforces reversible differentiation blockade in myeloid leukemias. Cell. 2011;146:697–708. doi: 10.1016/j.cell.2011.07.032. [DOI] [PMC free article] [PubMed] [Google Scholar]
- Thomson AW, Turnquist HR, Raimondi G. Immunoregulatory functions of mTOR inhibition. Nat Rev Immunol. 2009;9:324–337. doi: 10.1038/nri2546. [DOI] [PMC free article] [PubMed] [Google Scholar]
- Thoreen CC, Chantranupong L, Keys HR, Wang T, Gray NS, Sabatini DM. A unifying model for mTORC1-mediated regulation of mRNA translation. Nature. 2012;485:109–113. doi: 10.1038/nature11083. [DOI] [PMC free article] [PubMed] [Google Scholar]
- Thoreen CC, Kang SA, Chang JW, Liu Q, Zhang J, Gao Y, Reichling LJ, Sim T, Sabatini DM, Gray NS. An ATP-competitive mammalian target of rapamycin inhibitor reveals rapamycin-resistant functions of mTORC1. J Biol Chem. 2009;284:8023–8032. doi: 10.1074/jbc.M900301200. [DOI] [PMC free article] [PubMed] [Google Scholar]
- Thorpe LM, Yuzugullu H, Zhao JJ. PI3K in cancer: divergent roles of isoforms, modes of activation and therapeutic targeting. Nat Rev Cancer. 2015;15:7–24. doi: 10.1038/nrc3860. [DOI] [PMC free article] [PubMed] [Google Scholar]
- Um SH, Frigerio F, Watanabe M, Picard F, Joaquin M, Sticker M, Fumagalli S, Allegrini PR, Kozma SC, Auwerx J, Thomas G. Absence of S6K1 protects against age- and diet-induced obesity while enhancing insulin sensitivity. Nature. 2004;431:200–205. doi: 10.1038/nature02866. [DOI] [PubMed] [Google Scholar]
- Vadlakonda L, Dash A, Pasupuleti M, Anil Kumar K, Reddanna P. The Paradox of Akt-mTOR Interactions. Front Oncol. 2013;3:165. doi: 10.3389/fonc.2013.00165. [DOI] [PMC free article] [PubMed] [Google Scholar]
- Yu Y, Yoon SO, Poulogiannis G, Yang Q, Ma XM, Villen J, Kubica N, Hoffman GR, Cantley LC, Gygi SP, Blenis J. Phosphoproteomic analysis identifies Grb10 as an mTORC1 substrate that negatively regulates insulin signaling. Science. 2011;332:1322–1326. doi: 10.1126/science.1199484. [DOI] [PMC free article] [PubMed] [Google Scholar]
- Zhang Y, Zheng XF. mTOR-independent 4E-BP1 phosphorylation is associated with cancer resistance to mTOR kinase inhibitors. Cell Cycle. 2012;11:594–603. doi: 10.4161/cc.11.3.19096. [DOI] [PMC free article] [PubMed] [Google Scholar]
- Zhao J, Zhai B, Gygi SP, Goldberg AL. mTOR inhibition activates overall protein degradation by the ubiquitin proteasome system as well as by autophagy. Proc Natl Acad Sci U S A. 2015;112:15790–15797. doi: 10.1073/pnas.1521919112. [DOI] [PMC free article] [PubMed] [Google Scholar]
- Zhou H, Huang S. Role of mTOR signaling in tumor cell motility, invasion and metastasis. Curr Protein Pept Sci. 2011;12:30–42. doi: 10.2174/138920311795659407. [DOI] [PMC free article] [PubMed] [Google Scholar]
Associated Data
This section collects any data citations, data availability statements, or supplementary materials included in this article.