

Abstract
The electroretinogram (ERG) is a sensitive and noninvasive method for testing retinal function. In this protocol, we describe a method for performing ERGs in mice. Contact lenses on the mouse cornea measure the electrical response to a light stimulus of photoreceptors and downstream retinal cells, and the collected data are analyzed to evaluate retinal function.
Keywords: Electroretinogram (ERG), Mice, Retinal degeneration, Photoreceptors
Background
Electroretinograms (ERGs) are used by researchers and clinicians to test retinal function by measuring the electrical response of retinal cells to a light stimulus. The ERG is a useful tool for measuring retinal responses in mice due to its high level of sensitivity and noninvasive nature, and can be utilized to assess eye disease and retinal degeneration ( Duncan et al., 2003 ; Phillips et al., 2010 ; Zhao et al., 2011 ; Vollrath et al., 2015 ). In mouse genetic retinal disease models, ERGs can be used to assess retinal degeneration at multiple time points as the disease progresses ( Duncan et al., 2003 ). For studies evaluating the effect of drug treatment on the mouse eye, retinal function can be assessed before and after treatment in the same eye ( Zhao et al., 2011 ). In the following protocol, we describe a method for measuring the functional response of photoreceptors and downstream retinal cells in mice that builds on a previously published approach ( Phillips et al., 2010 ). The protocol can be readily applied to animals three weeks of age and older.
ERGs can be used to measure the electrical response to light flashes in either dark-adapted (scotopic) or light-adapted (photopic) mice. In scotopic ERGs, mice are presented with low intensity light flashes to induce rod activation, so the function of rod photoreceptor and downstream retinal cells can be examined (Fu, 2010). A prolonged period of dark-adaptation is critical to achieve maximal rod sensitivity, and to keep cone stimulation minimal (Pepperberg, 2003). In photopic ERGs, mice are presented with high intensity light flashes after a period of light stimulation. Under these conditions, there is high cone activation and the rod response is suppressed. Therefore, photopic ERGs can be used to measure the function of cone photoreceptors and downstream retinal cells (Fu, 2010).
This method of performing ERGs allows for the calculation of amplitude and time-to-peak of two major waves, the a-wave and b-wave. The a-wave is a measure of the initial response of photoreceptors to a brief flash of light (Brown, 1968; Perlman, 2015). The b-wave is a measure of the response of downstream retinal neurons, including bipolar cells, to photoreceptor stimulation (Brown, 1968; Perlman, 2015). Loss of amplitude in either the a-wave or b-wave may be attributed to a number of retinal dystrophies (Creel, 2015), while ‘supernormal’ waves with increased amplitude have been attributed to cone dystrophies ( Phillips et al., 2010 ).
Materials and Reagents
Absorbent pads (Bound Tree Medical, catalog number: 111-16650)
Syringes and needles (BD, catalog number: 329461)
Spray/squirt water bottle (Qorpak, catalog number: PLC-03431)
Cotton swabs (Uline, catalog number: S18985PK)
Two 29 gauge, 12 mm needle electrodes for ground and reference (The Electrode Store, catalog number: GRD-SAF)
Mice
Ketamine hydrochloride (NADA: 045-290)/xylazine hydrochloride (NADA: 139-236) cocktail (80 mg/kg/13 mg/kg)
1% atropine sulfate ophthalmic solution (NDC: 24208-750-60)
2.5% phenylephrine hydrochloride ophthalmic solution (NDC: 17478-200-12)
0.5% proparacaine hydrochloride (NDC: 24208-730-06)
Hydrating eye ointment (Refresh Tears; Allergan, NDC: 0023-0798)
2.5% hypromellose (NDC: 17238-610-15)
70% ethanol
Equipment
Dark room
Red filter (ROSCO, catalog number: Roscolux Supergel R27 Medium Red)
Black electrical tape (3M, catalog number: 06132)
Surgical tape (3M, catalog number: 15270)
Ganzfeld ColorDome (Diagnosys, catalog number: D125) or similar
Espion visual electrophysiology system (Diagnosys, catalog number: D315) or similar
Two Bayer-Mittag contact lens electrodes (Mt Sinai, Phil Cook) ( Bayer et al., 2001 )
Forceps (Fine Scientific Tools, catalog number: 11295-00)
Elevated mouse platform (Foam or plastic can be used to fit space and size requirements)
Non-electric heating pad (Braintree Scientific, catalog number: DPIP)
Clean mouse cage
Optional: opaque box (Rubbermaid Commercial Products, catalog number: 9S31), blackout cloth (Thorlabs, catalog number: BK5), red light headlamp (Princeton Tec, model: Sync headlamp), red light desk lamp (AstroGizmos, catalog number: DSKLMP22), lux meter (Fisher Scientific, catalog number: 06-662-63)
Software
Data analysis software such as Microsoft Excel (v 14.7.1) or GraphPad Prism (v 7.0)
Procedure
Note: This protocol should be performed according to Institutional Animal Care and Use Committee regulations, and is subject to institutional approval.
-
Day before experiment
-
Place mice in a light-proof dark room and allow them to dark-adapt overnight.
Check with your institution on regulations regarding overnight housing of animals.
A lux meter can be used to assess if the room is light-proof.
Warm the non-electric heat pad in a 37 °C bath or incubator overnight.
-
-
Prepping for the experiment
-
Set up the dark room
Existing light sources can be used if covered with red filter to make them procedure-safe.
Cover the computer monitor and any miscellaneous lights with red filter or black electrical tape.
-
Cover the 37 °C heat pad with an absorbent pad. Position the elevated platform with heat pad on top so that the mouse can be easily prepared and moved into the dome.
Note: The heat pad may need to be reheated to 37 °C if multiple animals are tested.
Move mice to experimental dark room if different from overnight adaption room. This can be done using either a blackout cloth or light-proof box. Mice that are not being tested should be kept in a dark environment.
Set stimulus settings as described below.
-
-
Preparing the mice
Note: From this point on, only red-filtered light sources should be used in order to keep mice dark-adapted.
Anesthetize the mouse by injection of ketamine hydrochloride/xylazine hydrochloride (80 mg/kg/13 mg/kg), and allow mice to become fully sedated (2-5 min). Check for a toe-pinch response to ensure the animal is adequately anesthetized.
Treat both eyes with 1% atropine sulfate, 2.5% phenylephrine hydrochloride, and 0.5% proparacaine hydrochloride, allowing drops to sit on the eyes for ~2 min before wicking with a cotton swab and applying the next drop. After this point the eyes should be kept hydrated with a hydrating eye ointment until the contact lens electrodes are applied (Figure 1).
Position the mouse on the heated platform. Place the ground needle electrode in the base of the tail, and reference needle electrode subdermally between the eyes (Figure 2).
Wick any excess moisture from the eyes, and add a small drop of 2.5% hypromellose to each eye.
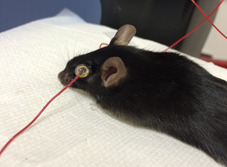
Use fingers or forceps to position the contact lens electrodes onto the corneas. The hypromellose should keep the lenses in place. It may be helpful to tape down the electrode wires to the pad using surgical tape so they do not shift during the experiment (Figure 3, Video 1).
Slide the heated platform into the dome so that the mouse’s eyes are inside of the dome (Figures 4 and 5).
-
Before beginning and throughout the scotopic and photopic assays, periodically check that impedance levels are acceptably low (within the green range). A low impedance level indicates that the electrodes have been properly installed.
Note: The impedance may be high if any of the electrodes have shifted and the circuit has been broken. The Espion visual electrophysiology system displays impedance using green, yellow and red bars to signify the level of resistance in the circuit.
-
Running the scotopic (dark-adapted) ERG
-
Settings to record scotopic ERGs
Step 1 2 3 4 5 6 7 8 Pulse intensity(cd sec/m2)0.001 0.002 0.05 0.1 0.78 1 5 10 -
Start with the following settings
5 trials/step
Pulse frequency: 0.2 Hz
Sample frequency: 1,000 Hz
Trial pre-trigger time: 20 msec
Trial post-trigger time: 250 msec
-
Run through each step of light intensity using the Espion E2 system.
Note: Check the impedance every 2-3 steps or as needed to ensure that the electrode circuit has not been broken.
-
-
Running the photopic (light-adapted) ERG
-
Light adapt the mouse for at least 10 min at a light intensity of 20 cd sec/m2. Light adaptation saturates the rod response so that the cones, which account for only 3% of the photoreceptor population in the mouse eye, can be stimulated and recorded without rod interference (Fu, 2010).
Note: It may be necessary to give the mouse a second, reduced dose of ketamine/xylazine if the animal begins to wake up.
-
Settings to record photopic ERGs
Step 1 2 3 4 5 6 Pulse Intensity(cd sec/m2)0.78 1 2.25 5 10 20 -
Start with the following settings:
25 trials/step
Pulse frequency: 1.0 Hz
Sample frequency: 1,000 Hz
Trial pre-trigger time: 20 msec
Trial post-trigger time: 250 msec
Run through each step of light intensity using the Espion E2 system.
-
-
Post-experiment
Remove electrodes from the mouse and gently clean contact electrodes with a cotton swab and water. Needle electrodes can be wiped with 70% ethanol.
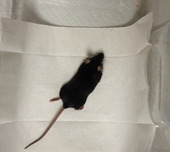
Place mouse in a clean cage on top of a heat pad until it recovers. Keep the mouse’s eyes moist with a hydrating eye ointment (Figure 6).
Figure 1. Anesthetized mouse with atropine sulfate, phenylephrine hydrochloride, proparacaine hydrochloride, and hydrating eye drops.
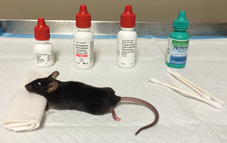
Figure 2. Electrode placement on the mouse.
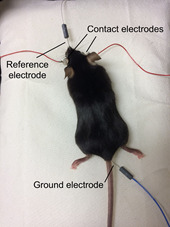
Figure 3. Contact lens electrodes on the mouse eye.
Video 1. Applying the contact lens electrodes to the mouse eye.

Figure 4. Mouse with electrodes on the heated, elevated platform.
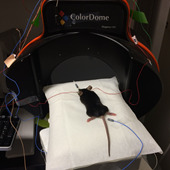
Figure 5. Mouse with eyes inside of the Ganzfeld ColorDome.
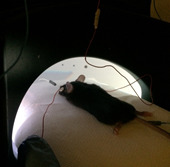
Figure 6. Mouse recovering in a clean, heated cage.
Data analysis
Figure 7. Representative ERG traces of C57BL/6J adult mice.
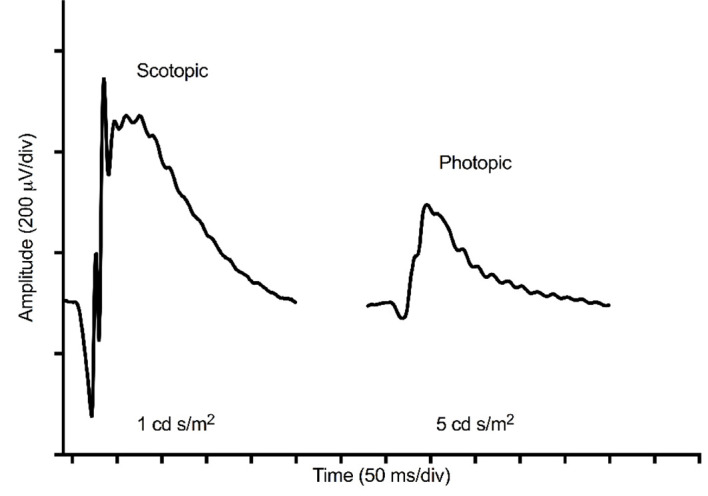
A pulse intensity of 1 cd sec/m2 was used for measurement of the scotopic ERG, and a pulse intensity of 5 cd sec/m2 was used for measurement of the photopic ERG.
Figure 8. Defining the a-wave and b-wave on an ERG trace.
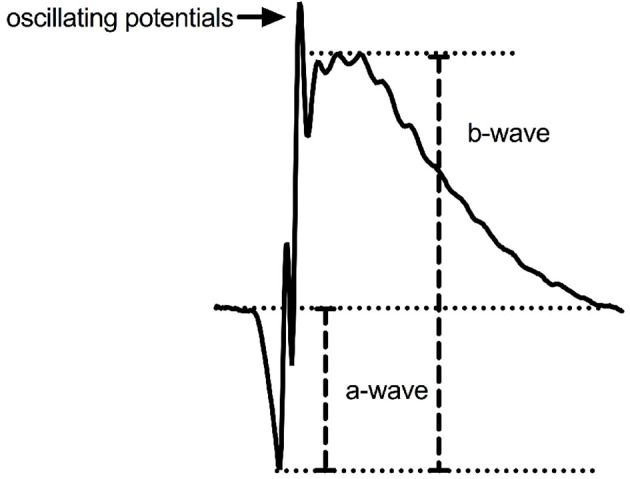
The a-wave is measured by calculating the difference in trace amplitude between time (t) = 0 and the lowest point on the trace. The b-wave amplitude is measured by calculating the difference in trace amplitude between the bottom of the a-wave and the top of the tallest curve.
Data from two eyes can either be averaged for a single animal, or analyzed separately if one eye is experimental and one is control.
Use a data analysis software such as Microsoft Excel or GraphPad Prism to generate traces.
-
a-wave:
-
The a-wave amplitude can be measured by calculating the difference in trace amplitude between time (t) = 0 and the lowest point on the trace.
Note: The tail of the trace may have points lower than the bottom of the a-wave, which is the first wave to be recorded. Exclude these tail points if this is the case.
The a-wave latency of response (time-to-peak) can be measured by calculating elapsed time between t = 0 and the time point at the lowest point on the trace.
-
-
b-wave:
-
The b-wave amplitude can be measured by calculating the difference in trace amplitude between the bottom of the a-wave and the top of the tallest curve.
Note: There may be oscillating potentials that rise above the top of the b-wave curve. Exclude these points, as they will give an inaccurate b-wave if included. Oscillating potentials are thought to reflect cell activity in the inner retina, and can be isolated using a digital filter (Asi and Perlman, 1992).
The b-wave implicit time (time-to-peak) can be measured by calculating elapsed time between the bottom of the a-wave and the top of the b-wave.
-
B. Statistical analysis of ERG data
-
a-wave and b-wave amplitude:
Note: Statistical analysis of a-wave and b-wave amplitude shown is based on data in Vollrath et al. (2015), and may not be appropriate for every data set.
Compile calculated a-wave amplitudes at a single light intensity for scotopic ERGs in each experimental group and perform a two-way ANOVA with Bonferroni’s correction for multiple comparisons (Figure 9) ( Vollrath et al., 2015 ).
Repeat the statistical analysis for each light intensity.
-
The following notation can be used to show p-value significance: ****P ≤ 0.0001, ***P ≤ 0.001, **P ≤ 0.01, *P ≤ 0.05 (Figure 9).
Note: We recommend using at least 5 animals per group to achieve statistical significance, although more may be necessary.
Repeat statistical analysis for every light intensity for b-wave amplitude of scotopic ERGS, a-wave amplitude of photopic ERGs, and b-wave amplitude of photopic ERGs.
A significant difference in a-wave amplitude at one or more light intensities may indicate a difference in photoreceptor function between the two experimental groups. A significant difference in b-wave amplitudes may indicate a difference in the function of retinal cells downstream of the photoreceptors, including bipolar cells ( Vollrath et al., 2015 ).
-
a-wave and b-wave time-to-peak:
Compile calculated time-to-peak at a single light intensity for each experimental group and perform a two-way ANOVA with Bonferroni’s correction for multiple comparisons.
Repeat the statistical significance at each light intensity for a-wave and b-wave time-to-peak for both scotopic and photopic ERGs.
A significant difference in a-wave or b-wave time at one or more light intensities may indicate a delay in photoreceptor response or downstream retinal signaling (Perlman, 2015).
Figure 9. Statistical analysis of ERG data comparing two mouse genotypes.

( Vollrath et al., 2015 ). Comparison of mean amplitudes ± SD of scotopic a-wave and photopic b-wave at various light intensities for two mouse genotypes (n = 5 males at 10-11 weeks for each). Statistical analysis by two-way ANOVA with Bonferroni’s correction for multiple comparisons.
Acknowledgments
Supported by grants from the Foundation Fighting Blindness, the Macular Degeneration Research Program of the BrightFocus Foundation, the Thome Memorial Foundation, and NIH grants R01 EY025790 and T32 EY20485.
This protocol should be cited as Benchorin G., Calton M.A., Beaulieu M.O., Vollrath D. Assessment of murine retinal function by electroretinography. Bio Protoc. 2017.
Citation
Readers should cite both the Bio-protocol article and the original research article where this protocol was used.
References
- 1.Asi H. and Perlman I.(1992). Relationships between the electroretinogram a-wave, b-wave and oscillatory potentials and their application to clinical diagnosis. Doc Ophthalmol 79(2): 125-139. [DOI] [PubMed] [Google Scholar]
- 2.Bayer A. U., Cook P., Brodie S. E., Maag K. P. and Mittag T.(2001). Evaluation of different recording parameters to establish a standard for flash electroretinography in rodents. Vision Res 41(17): 2173-2185. [DOI] [PubMed] [Google Scholar]
- 3.Brown K. T.(1968). The electroretinogram: its components and their origin. Vision Res. 8:633-677. [DOI] [PubMed] [Google Scholar]
- 4.Creel D. J.(2015). The electroretinogram and electro-oculogram: clinical applications by Donnell J. Creel. In: Kolb, H. E., Nelson, R., Fernandez, E. and Jones, B.(Eds.). The Organization of the Retina and Visual System. [Google Scholar]
- 5.Duncan J. L., LaVail M. M., Yasumura D., Matthes M. T., Yang H., Trautmann N., Chappelow A. V., Feng W., Earp H. S., Matsushima G. K. and Vollrath D.(2003) An RCS-like retinal dystrophy phenotype in mer knockout mice. Invest Ophthalmol Vis Sci 44(2): 826-838. [DOI] [PubMed] [Google Scholar]
- 6.Fu Y.(2010). Phototransduction in Rods and Cones. In: Kolb, H. E., Nelson, R., Fernandez, E. and Jones, B.(Eds.). The Organization of the Retina and Visual System. [Google Scholar]
- 7.Perlman I.(2015). The electroretinogram: ERG by Ido Perlman. In: Kolb, H. E., Nelson, R., Fernandez, E. and Jones, B.(Eds.). The Organization of the Retina and Visual System. [Google Scholar]
- 8.Pepperberg D. R.(2003). Bleaching desensitization: background and current challenges. Vision Res 43(28): 3011-3019. [DOI] [PubMed] [Google Scholar]
- 9.Phillips M. J., Webb-Wood S., Faulkner A. E., Jabbar S. B., Biousse V., Newman N. J., Do V. T., Boatright J. H., Wallace D. C. and Pardue M. T.(2010). Retinal function and structure in Ant1-deficient mice. Invest Ophthalmol Vis Sci 51(12): 6744-6752. [DOI] [PMC free article] [PubMed] [Google Scholar]
- 10.Vollrath D., Yasumura D., Benchorin G., Matthes M. T., Feng W., Nguyen N. M., Sedano C. D., Calton M. A. and LaVail M. M.(2015). Tyro3 modulates Mertk-associated retinal degeneration . PLoS Genet 11(12): e1005723. [DOI] [PMC free article] [PubMed] [Google Scholar]
- 11.Zhao C., Yasumura D., Li X., Matthes M., Lloyd M., Nielsen G., Ahern K., Snyder M., Bok D., Dunaief J. L., LaVail M. M. and Vollrath D.(2011). mTOR-mediated dedifferentiation of the retinal pigment epithelium initiates photoreceptor degeneration in mice. J Clin Invest 121(1): 369-383. [DOI] [PMC free article] [PubMed] [Google Scholar]