

Abstract

Positron emission tomography (PET) is emerging as one of the most important diagnostic tools for brain imaging, yet the most commonly used radioisotopes in PET imaging, 11C and 18F, have short half-lives, and their usage is thus somewhat limited. By comparison, the 64Cu radionuclide has a half-life of 12.7 h, which is ideal for administering and imaging purposes. In spite of appreciable research efforts, high-affinity copper chelators suitable for brain imaging applications are still lacking. Herein, we present the synthesis and characterization of a series of bifunctional compounds (BFCs) based on macrocyclic 1,4,7-triazacyclononane and 2,11-diaza[3.3](2,6)pyridinophane ligand frameworks that exhibit a high affinity for Cu2+ ions. In addition, these BFCs contain a 2-phenylbenzothiazole fragment that is known to interact tightly with amyloid β fibrillar aggregates. Determination of the protonation constants (pKa values) and stability constants (log β values) of these BFCs, as well as characterization of the isolated copper complexes using X-ray crystallography, electron paramagnetic resonance spectroscopy, and electrochemical studies, suggests that these BFCs exhibit desirable properties for the development of novel 64Cu PET imaging agents for Alzheimer’s disease.
Short abstract
Novel bifunctional chelators (BFCs) containing 1,4,7-triazacyclononane or pyridinophane macrocycles and amyloid-binding 2-phenylbenzothiazole fragments have been synthesized, and their copper coordination properties have been characterized in detail. These BFCs are attractive candidates for the development of novel 64Cu-labeled PET imaging agents for Alzheimer’s disease.
Introduction
Alzheimer’s disease (AD) is the most common neurodegenerative disease and the sixth leading cause of death in the United States.1,2 Around 5 million people are presently diagnosed with AD in the U.S.3 The brains of AD patients are characterized by the deposition of amyloid plaques containing the amyloid β (Aβ) peptide.4−7 To date, there is no treatment for AD,8 and its diagnosis with high accuracy requires a detailed postmortem examination of the brain.2 Thus, the effective imaging of various Aβ aggregates leads to an early diagnosis of AD.
Positron emission tomography (PET) is emerging as one of the most important diagnostic tools for brain imaging.9−11 Recently, 11C- and 18F-radiolabeled agents, such as [11C]PIB,11,12 [11C]SB-13,13 [18F]BAY94-9172,14 [11C]BF-227,15 [18F]FDDNP,16 and [18F]-AV-45,17,18 have been developed for noninvasive PET imaging of mature amyloid plaques in AD patients (Figure 2b).12,19−26 However, these agents are limited by their short physical half-life (t1/2 = 20.4 and 109.8 min, respectively) and their complex synthesis. By comparison, the 64Cu radionuclide can be viewed as an ideal positron emitter for PET imaging because of its decay scheme (β+, 19%; β–, 40%; electron capture, 40%) and an optimal half-life of 12.7 h.27−29
Figure 2.

Variable-pH (3–11) UV–vis spectra of L1 (50 μM, 25 °C, and I = 0.1 M NaCl) and the species distribution plot.
The development of chelators that form copper complexes stable enough to withstand transmetalation in vivo remains a challenge.28 For example, the commonly studied 1,4,7,10-tetraazacyclododecane-N,N′,N″,N‴-tetraacetic acid and 2,2′,2″,2‴-(1,4,8,11-tetraazacyclotetradecane-1,4,8,11-tetrayl)tetraacetic acid ligands were shown to form stable complexes of copper(2+) with high thermodynamic stability but presented limited kinetic inertness to avoid demetalation.28,30 In order to get more kinetically inert complexes, cagelike polyaza chelators, such as bicyclic hexaamines, dicarboxylic acid cross-bridged cyclen, and cyclam, were subsequently developed.31−47 However, these latter systems suffer from low rates of metalation, which require high temperatures and thus limit the development of bioconjugated imaging agents. Recently, multidentate ligands based on cyclen, 1,4,7-triazacylononane (tacn), and bispidine macrocycles were shown to rapidly form copper complexes with remarkable inertness.48−50
We have recently reported the development of bifunctional chelators (BFCs), which can bind metal ions and also interact with Aβ aggregates and thus modulate the aggregation and neurotoxicity of various Aβ species.51−54 Moreover, we envisioned that the BFCs that exhibit a very high affinity for Cu ions could be used to prechelate 64Cu and thus generate PET imaging agents that also have an affinity for Aβ aggregates. On the basis of this strategy, described herein are BFCs that contain tacn or 2,11-diaza[3.3](2,6)pyridinophane (N4) macrocycles as the metal chelating fragments along with a Aβ-binding 2-phenylbenzothiazole moiety, reminiscent of ThT and PiB (Scheme 1).11,12,55 Both tacn and N4 macrocycles have been shown previously to act as high-affinity metal chelators.37,56,57 The synthesis and characterization of the copper complexes of ligands L0–L5, along with their stability constant determination, X-ray structural characterization, electron paramagnetic resonance, and electrochemical studies, are reported herein. On the basis of the obtained results, the developed bifunctional chelating agents show promise to be used in 64Cu-radiolabeling and PET imaging studies.
Scheme 1. Design Strategy and Structures of Various Ligands Developed Herein.

Experimental Section
General Methods
All reagents were purchased from commercial sources and used as received unless stated otherwise. Solvents were purified prior to use by passing through a column of activated alumina using an MBraun SPS. The precursors 2,11-diaza[3.3](2,6)pyridinophane (N4H2),58N-methyl-2,11-diaza[3.3](2,6)pyridinophane (N4MeH),59 and 1,4-dimethyl-1,4,7-triazacyclononane60 were prepared following literature protocols. All solutions and buffers were prepared using metal-free Millipore water (H2O) that was treated with Chelex overnight and filtered through a 0.22 μm nylon filter. 1H (300.121 MHz) and 13C (75 MHz) NMR spectra were recorded on a Varian Mercury-300 spectrometer. Chemical shifts are reported in parts per million and referenced to residual solvent resonance peaks. UV–vis spectra were recorded on a Varian Cary 50 Bio spectrophotometer and are reported as λmax, nm (ε, M–1 cm–1). Electrospray ionization mass spectrometry (ESI-MS) experiments were performed at the Washington University Mass Spectrometry NIH Resource (Grant P41RR0954) using a Bruker Maxis Q-TOF mass spectrometer with an electrospray ionization source. Elemental analyses were performed by the Columbia Analytical Services Tucson Laboratory. Transmission electron microscopy (TEM) analysis was performed at the Nano Research Facility (NRF) at Washington University (St. Louis, MO). All fluorescence measurements were performed using a SpectraMax M2e plate reader (Molecular Devices). Electron paramagnetic resonance (EPR) spectra were recorded on a JEOL JES-FA X-band (9.2 GHz) EPR spectrometer at 77 K.
Synthesis of BFCs
L0(N4DA). N4H2 (250 mg) was suspended in 15 mL of dry acetonitrile (MeCN) along with sodium carbonate (0.220 g, 2.2 equiv) and tert-butyl bromoacetate (307.2 μL, 2.0 equiv), and the suspension was stirred under reflux for 14 h. The solution was then cooled and filtered, and the filtrate was concentrated to dryness under vacuum to give a pale-yellow powder of N4(CH2COOtBu)2 (0.494 g, 96.5%). 1H NMR (300 MHz, CDCl3): δ 7.10 (t, 2H, arom-H), 6.55 (d, 4H, arom-H), 4.26 (d, 4H, −CH2−), 3.76 (s, 4H, −CH2−), 3.65 (d, 4H, −CH2−), 1.54 (s, 18H, −CH3). The ester was dissolved in 20 mL of 5 M HCl and refluxed with stirring for 12 h. The solvent was removed to get an off-white powder, which was dissolved in absolute ethanol and filtered. Removal of the solvent gave a white powder, which was dried under vacuum to obtain the product as L0·4HCl (0.510 g, yield 96%). 1H NMR (300 MHz, D2O): δ 7.70 (t, 2H, arom-H), 7.18 (d, 4H, arom-H), 4.49 (s, 8H, −CH2-Py), 4.19 (s, 4H, −CH2-COOH). ESI-MS. Calcd for [M + H]+: m/z 357.2. Found: m/z 357.2.
L1.61 Paraformaldehyde (0.204 g, 6.68 mmol) was added to a solution of 1,4-dimethyl-1,4,7-triazacyclononane (0.7 g, 4.45 mmol) in MeCN (5 mL), and the resultant mixture was heated to reflux for 30 min. Then 2-(4-hydroxy-3-methoxy)benzothiazole (1.145 g, 4.45 mmol) in MeCN (35 mL) was added, and the solution was refluxed for 24 h under N2. Upon cooling to room temperature, the solvent was removed to give a reddish residue, which was purified by silica gel column chromatography using CHCl3/methanol (MeOH)/NH4OH (90:5:5) to yield a yellow oil (0.55 g, yield 30%). 1H NMR (CDCl3): δ 8.01 (d, 1H, ArH), 7.86 (d, 1H, ArH), 7.54 (s, 1H, ArH), 7.45 (t, 1H, ArH), 7.35–7.31 (m, 2H, ArH), 4.10 (s, 3H, OCH3), 3.93 (s, 2H, NCH2Py), 3.01 (t, 4H, CH2N), 2.72 (t, 4H, CH2N), 2.56 (s, 4H, CH2N), 2.39 (s, 6H, NCH3). 13C NMR (CDCl3): δ 168.52, 154.19, 151.58, 148.52, 134.70, 126.12, 124.57, 123.81, 122.92, 122.56, 121.42, 120.62, 109.61, 60.52, 58.55, 57.99, 56.11, 53.14, 46.72. UV–vis [MeCN; λmax, nm (ε, M–1 cm–1)]: 330 (18200). ESI-MS. Calcd for [M + H]+: m/z 427.1. Found: m/z 427.1.
L2and L5.61 Paraformaldehyde (0.062 g, 2.08 mmol) was added to a solution of N4H2 (0.050 g, 0.208 mmol) in MeCN (2 mL), and the resultant mixture was heated to reflux for 1 h. A hot solution of 2-(4-hydroxy-3-methoxy)benzothiazole (0.054 g, 0.208 mmol) in MeCN (5 mL) was added to the reaction flask, and the solution was refluxed for another 24 h under N2. The solvent was removed, and the resulting residue was purified by silica gel column chromatography using ethyl acetate (EtOAc) to elute the unreacted 2-(4-hydroxy-3-methoxy)benzothiazole, followed by 90:10 CHCl3/MeOH to elute the dibenzothiazole product L5 and then by 80:20 CHCl3/MeOH to elute L2. The solvent was removed to yield L2 as a yellow solid (0.062 g, yield 60%). Characterization of L2. 1H NMR (CDCl3): δ 8.03 (d, 1H, ArH), 7.88 (d, 1H, ArH), 7.64 (s, 1H, ArH), 7.53 (s, 1H, ArH), 7.45 (t, 1H, ArH), 7.35 (t, 1H, ArH), 7.12 (t, 2H, PyH), 6.73 (d, 2H, PyH), 6.54 (d, 2H, PyH), 4.29 (s, 2H, NCH2−), 4.07 (s, 4H, CH2NCH2), 4.06 (s, 3H, OCH3), 4.07 (s, 4H, CH2NHCH2). 13C NMR (CDCl3): δ 168.17, 156.52, 154.12, 136.51, 134.77, 126.24, 123.24, 122.69, 121.88, 121.53, 120.97, 110.70, 63.33, 56.37, 55.09. UV–vis [MeCN; λmax, nm (ε, M–1 cm–1)]: 334 (15800). ESI-MS. Calcd for [M + H]+: m/z 510.1964. Found: m/z 510.2.
Characterization of L5. Yield: 16%. 1H NMR (CDCl3): δ 7.99 (d, 1H, ArH), 7.84 (d, 1H, ArH), 7.64 (s, 1H, ArH), 7.47 (s, 1H, ArH), 7.45 (t, 1H, ArH), 7.33 (t, 1H, ArH), 7.18 (t, 2H, PyH), 6.83 (d, 2H, PyH), 4.23 (s, 4H, NCH2−), 4.05 (s, br, 6H, −OCH3, and 8H, CH2NCH2). 13C NMR (CDCl3): δ 168.04, 155.75, 154.10, 150.06, 148.79, 134.76, 126.26, 125.10, 124.82, 123.06, 122.71, 120.74, 110.24, 63.67, 56.24. UV–vis [MeCN; λmax, nm (ε, M–1 cm–1)]: 323 (19600). ESI-MS. Calcd for [M + H]+: m/z 779.2474. Found: m/z 779.3.
L3.61 Paraformaldehyde (0.088 g, 2.95 mmol) was added to a solution of N4MeH (0.050 g, 0.196 mmol) in MeCN (5 mL), and the resultant mixture was heated to reflux for 1 h. A hot solution of 2-(4-hydroxy-3-methoxy)benzothiazole (0.076 g, 0.295 mmol) in MeCN (5 mL) was added to the reaction flask, and the solution was refluxed for another 24 h under N2. The solvent was removed, and the resulting residue was purified by silica gel column chromatography using EtOAc to elute out the remaining starting material 2-(4-hydroxy-3-methoxy)benzothiazole and then a 80:15:5 ratio of CHCl3/MeOH/NH4OH to elute out the product. The solvent was removed to yield a yellow solid (0.045 g, yield 44%). 1H NMR (CDCl3): δ 8.02 (d, 1H, ArH), 7.86 (d, 1H, ArH), 7.63 (s, 1H, ArH), 7.48 (s, 1H, ArH), 7.45 (t, 1H, ArH), 7.33 (t, 1H, ArH), 7.14 (t, 2H, PyH), 6.80 (t, 4H, PyH), 4.24 (s, 2H, NCH2−), 4.08 (s, 4H, CH2NCH2), 4.05 (s, 3H, OCH3), 3.82 (s, 4H, CH2NHCH2), 2.71 (s, 3H, NCH3). 13C NMR (CDCl3): δ 168.05, 154.11, 150.09, 148.74, 126.25, 125.06, 124.81, 123.066, 122.71, 122.61, 121.51, 120.76, 110.165, 65.91, 59.81, 56.22, 42.73. UV–vis [MeCN; λmax, nm (ε, M–1 cm–1)]: 330 (9740). ESI-MS. Calcd for [M + H]+: m/z 524.2645. Found: m/z 524.2.
L4. To a solution of L2 (0.045 g, 0.088 mmol) in MeCN (5 mL) was added Na2CO3 (0.0093 g, 0.088 mmol), followed by the addition of tert-butyl bromoacetate (0.0172 g, 0.088 mmol), and the resultant mixture was stirred for 3 h at room temperature under N2. Then solvent was removed, and the resulting residue was purified by silica gel column chromatography using 95:5 CHCl3/MeOH to elute out the product. The solvent was removed to yield a yellow solid (0.054 g, yield 98%). Characterization of the ester precursor. 1H NMR (CDCl3): δ 7.96 (d, 1H, ArH), 7.88 (d, 1H, ArH), 7.58–7.34 (m, 4H, ArH), 7.08 (t, 2H, ArH), 6.54–6.47 (m, 2H, ArH), 4.39–4.21 (m, 8H, NCH2−), 4.07 (s, 3H, OCH3), 3.97–3.90 (s, 2H, CH2NCH2), 3.58 (s, 2H, CH2NHCH2), 1.49 (s, 9H, tBu). HRMS. Calcd for [M + H]+: m/z 624.2645. Found: m/z 624.3. The ester intermediate was dissolved in 6 M HCl and stirred for 12 h at room temperature. The solvent was removed under vacuum to yield a yellow solid. 1H NMR (CD3OD): δ 8.24 (s, 1H, ArH), 8.11–8.03 (m, 2H, ArH), 7.89 (s, 1H, ArH), 7.67–7.51 (m, 4H, ArH), 7.20–7.12 (m, 4H, ArH), 5.07 (s, 2H, NCH2), 4.90 (m, 8H, NCH2), 4.71 (s, 2H, NCH2), 4.09 (s, 3H, OCH3). 13C NMR (CD3OD): δ 190.57, 166.98, 154.24, 149.71, 149.43, 148.93, 138.81, 132.43, 131.15, 128.54, 127.01, 126.44, 123.57, 123.44, 119.69, 118.57, 111.56, 60.68, 59.47, 56.07, 55.80, 53.16. UV–vis [MeCN; λmax, nm, (ε, M–1 cm–1)]: 331 (12300). ESI-MS. Calcd for [M + H]+: m/z 568.2019. Found: m/z 568.2.
Syntheses of Metal Complexes
[(L0)4CuII4](ClO4)4 (1) and [(L0)CuIICl2] (2)
To an aqueous solution of L0·4HCl (0.050 g, 0.1 mmol) was added an aqueous solution of Cu(ClO4)2·6H2O (37 mg, 0.1 mmol), and the pH of the green reaction mixture was adjusted to 5.5 with a 1 M NaOH solution. After stirring for 2 h at room temperature, the solvent was removed to obtain a light-green residue. Recrystallization in hot MeCN provided crystals of 1. This complex was further dissolved in 1 M HCl, and slow evaporation yielded single crystals of 2 (0.058 g, yield 58%). UV–vis [MeOH/H2O; λmax, nm (ε, M–1 cm–1)]: 810 (95). Anal. Calcd for C18H20Cl2N4O4Cu·2.5H2O (2): C, 40.34; H, 4.70; N, 10.46. Found: C, 40.17; H, 4.43; N, 10.27.
[(L1)CuIICl] (3).61
To a stirring solution of L1 (0.125 g, 0.293 mmol) in MeCN (5 mL) and triethylamine (Et3N; 0.044 g, 0.44 mmol) was added a solution of CuCl2 (0.040 g, 0.293 mmol) in MeCN (2 mL). The brown solution was stirred for 30 min. The addition of diethyl ether (Et2O) resulted in the formation of a brown precipitate, which was filtered and washed with Et2O and dried under vacuum (0.085 g, yield 55%). UV–vis [MeCN; λmax, nm (ε, M–1 cm–1)]: 353 (7500), 425 (sh, 450), 515 (sh, 250), 650 (90). ESI-MS. Calcd for [(L1)Cu]+: m/z 488.1307. Found: m/z 488.1. Anal. Calcd for C23H29ClN4O2SCu·2H2O: C, 48.50; H, 6.02; N, 9.84. Found: C, 48.42; H, 6.69; N, 9.47.
[(L1)ZnII(MeCN)2](ClO4) (4)
A solution of Zn(ClO4)2·6H2O (0.044 g, 0.117 mmol) was added to a stirring solution of L1 (0.050 g, 0.117 mmol) in MeCN (5 mL) and Et3N (0.012 g, 0.117 mmol). The resulting solution was stirred for 4 h. The addition of Et2O (20 mL) resulted in the formation of a white precipitate, which was filtered, washed with Et2O, and dried under vacuum (0.028 g, yield 36%). ESI-MS. Calcd for [(L1)Zn]+: m/z 489.1. Found: m/z 489.1. Anal. Calcd for C27H35ClZnN6O6S·H2O: C, 46.96; H, 5.40; N, 12.17. Found: C, 46.65; H, 5.61; N, 12.06.
[(L2)2CuII]2(ClO4)2 (5).61
A solution of Cu(ClO4)2·6H2O (0.036 g, 0.098 mmol) was added to a stirring solution of L2 (0.050 g, 0.098 mmol) in MeOH (5 mL) and Et3N (0.015 g, 0.147 mmol). The brown solution was stirred for 12 h. A reddish-brown precipitate was formed, which was filtered, washed with Et2O, and dried under vacuum (0.052 g, yield 79%). UV–vis [MeCN; λmax, nm (ε, M–1 cm–1): 363 (15000), 428 (1500), 505 (450), 725 (130). ESI-MS. Calcd for [(L2)Cu]+: m/z 571.1. Found: m/z 571.1. Anal. Calcd for C58H52Cl2N10O4S2Cu2: C, 51.86; H, 3.90; N, 10.43. Found: C, 51.15; H, 3.86; N, 10.20.
[(L3)CuII](ClO4) (6)
A solution of Cu(ClO4)2·6H2O (0.042 g, 0.114 mmol) was added to a stirring solution of L3 (0.060 g, 0.114 mmol) in MeOH (5 mL) and Et3N (0.018 g, 0.171 mmol). The brown solution was stirred for 12 h. The addition of Et2O (30 mL) resulted in the formation of a brown precipitate, which was filtered, washed with Et2O, and dried under vacuum (0.052 g, yield 79%). UV–vis [MeCN; λmax, nm (ε, M–1 cm–1)]: 357 (14700), 421 (1600), 520 (430), 710 (150). ESI-MS. Calcd for [(L3)Cu]+: m/z 585.1. Found: m/z 585.1. Anal. Calcd for C30H34ClN5O9SCu: C, 48.71; H, 4.63; N, 9.47. Found: C, 48.43; H, 4.10; N, 9.38.
[(L4)CuII] (7).61
A solution of Cu(ClO4)2·6H2O (0.032 g, 0.088 mmol) was added to a stirring solution of L4 (0.050 g, 0.088 mmol) in MeOH (5 mL), which formed a green solution. The drop-by-drop addition of Et3N (0.045 g, 0.44 mmol) resulted in a deep-brown solution, which was stirred for 12 h. The addition of Et2O (20 mL) resulted in the formation of a brown precipitate, which was filtered, washed with Et2O, and dried under vacuum (0.042 g, yield 65%). UV–vis [MeCN; λmax, nm (ε, M–1 cm–1)]: 358 (12000), 425 (1300), 500 (430), 761 (120). HRMS. Calcd for [(L4)Cu]+: m/z 629.1. Found: m/z 629.1. Anal. Calcd for C32H31ClN5O8SCu·2H2O: C, 49.23; H, 4.52; N, 8.97. Found: C, 49.12; H, 4.22; N, 8.63.
[(L5)2CuII3] (8).61
A solution of Cu(ClO4)2·6H2O (0.056 g, 0.088 mmol) was added to a stirring solution of L5 (0.118 g, 0.151 mmol) in MeOH (5 mL). The deep-brown solution was stirred for 12 h. The addition of Et2O (30 mL) resulted in the formation of a brown precipitate, which was filtered, washed with Et2O, and dried under vacuum (0.101 g, yield 79%). UV–vis [MeCN; λmax, nm, (ε, M–1 cm–1)]: 324 (14000), 410 (4500), 560 (1400), 750 (sh, 180). ESI-MS. Calcd for [(L5)Cu]+: m/z 840.1614. Found: m/z 840.2. Anal. Calcd for C88H74Cl2Cu3N12O17S4·4H2O·2MeOH: C, 51.53; H, 4.33; N, 8.01. Found: C, 51.04; H, 3.50; N, 8.00.
Caution! Perchlorate salts of compounds containing organic ligands are potentially explosive, and hence only the synthesis of small amounts of the complexes should be attempted.
X-ray Crystallography
Suitable crystals of appropriate dimensions were mounted on a Bruker Apex II CCD X-ray diffractometer equipped with an Oxford Cryostream LT device and a fine-focus Mo Kα radiation X-ray source (λ = 0.71073 Å). Preliminary unit cell constants were determined with a set of 36 narrow frame scans. Typical data sets consist of a combinations of ω and ϕ scan frames with a typical scan width of 0.5° and a counting time of 15–30 s frame–1 at a crystal-to-detector distance of ∼4.0 cm. The collected frames were integrated using an orientation matrix determined from the narrow-frame scans. Apex II and SAINT software packages (Bruker Analytical X-ray, Madison, WI) were used for data collection and data integration. The final cell constants were determined by the global refinement of reflections from the complete data set. Data were corrected for systematic errors using SADABS (Bruker Analytical X-ray, Madison, WI). Structure solutions and refinement were carried out using the SHELXTL- PLUS software package.62 The structures were refined with full-matrix least-squares refinement by minimizing ∑w(Fo2 – Fc2)2. All non-H atoms were refined anisotropically to convergence. All H atoms were added in the calculated position and refined using appropriate riding models (AFIX m3). Additional crystallographic details can be found in the Supporting Information.63
Acidity and Stability Constant Determination
UV–vis pH titrations were employed for determination of the acidity constants of L0–L5 and the stability constants of their copper(2+) complexes. For the acidity constants, solutions of BFCs (50 μM, 0.1 M NaCl, pH 3) were titrated with small aliquots of 0.1 M NaOH at room temperature. About 30 UV–vis spectra were collected in the pH 3–11 range. Because of the limited solubility of L1–L5 in H2O, MeOH stock solutions (10 mM) were used and titrations were performed in a MeOH/H2O mixture in which MeOH did not exceed 20% (v/v) and the pH range could not be extended beyond 3 and 11. Similarly, the stability constants were determined by titrating solutions of L0–L5 and equimolar amounts of Cu(ClO4)2·6H2O (50 μM or 0.5 mM) with small aliquots of 0.1 M NaOH at room temperature. About 30 UV–vis spectra were collected in the pH 3–11 range. The acidity and stability constants were calculated using the HypSpec computer program (Protonic Software, UK).64 Speciation plots of the compounds and their metal complexes were calculated using the program HySS2009 (Protonic Software, UK).65
Electrochemical Studies
Cyclic voltammograms were performed in aqueous solution at room temperature with a BASi EC Epsilon electrochemical workstation or CHI 660D electrochemical analyzer. The three-electrode setup consisted of a reference Ag/AgCl electrode, a platinum wire auxiliary electrode, and a glassy carbon working electrode. A solution of the copper(2+) complexes of BFCs in MeCN at 2 mM concentration was mixed with an equal volume of H2O (0.2 M CH3COONa electrolyte). The electrochemical measurements were performed under a blanket of N2. Analyzed solutions were deaerated by purging with N2. Between each scan, the working electrode was cleaned by polishing on alumina, cleaned with H2O and MeOH. Cyclic voltammograms with sweep rates ranging from 100 to 1000 mV s–1 were recorded in the range of +1200 to −1200 mV. At this potential range, the solvent mixture 1:1 MeCN/H2O was found to be electroinactive. The half-wave potentials, E1/2, were obtained by averaging the anodic and cathodic peak potentials. All potential values are reported relative to the Ag/AgCl reference electrode in aqueous 3 M NaCl unless otherwise noted.
Aβ Peptide Experiments
Aβ monomeric films were prepared by dissolving commercial Aβ42 (or Aβ40 for the Aβ fibril binding studies) peptide (Keck Biotechnology Resource Laboratory, Yale University) in hexafluoro-2-propanol (1 mM) and incubating for 1 h at room temperature. The solution was then aliquoted out and evaporated overnight. The aliquots were vacuum-centrifuged and the resulting monomeric films stored at −80 °C. Aβ fibrils were generated by dissolving monomeric Aβ films in dimethyl sulfoxide (DMSO), diluting into the appropriate buffer, and incubating for 24 h at 37 °C with continuous agitation (the final DMSO concentration was <2%). For inhibition studies, BFCs (50 μM, DMSO stock solutions) were added to Aβ solutions (25 mM) in the absence or presence of metal salts (CuCl2 or ZnCl2, 25 μM) and incubated for 24 h at 37 °C with constant agitation.
Native Gel Electrophoresis and Western Blotting
All gels, buffers, membranes, and other reagents were purchased from Invitrogen and used as directed, except where otherwise noted. Samples were separated on 10–20% gradient Tris-tricine mini gels. The gel was transferred to a nitrocellulose membrane in an ice bath, and the protocol was followed as suggested, except that the membrane was blocked overnight at 4 °C. After blocking, the membrane was incubated in a solution (1:2000 dilution) of 6E10 anti-Aβ primary antibody (Covance) for 3 h. Invitrogen’s Western Breeze Chemiluminescent kit was used to visualize the bands. An alkaline phosphatase antimouse secondary antibody was used, and the protein bands were imaged using a Fujifilm LAS-1000CH luminescent image analyzer.
TEM
Glow-discharged grids (Formar/Carbon 300-mesh, Electron Microscopy Sciences) were treated with Aβ samples (25 μM, 5 μL) for 2–3 min at room temperature. Excess solution was removed using filter paper, and the grids were rinsed twice with H2O (5 μL). Then the grids were stained with uranyl acetate [1% (w/v) in H2O, 5 μL] for 1 min, blotted with filter paper, and dried for 15 min at room temperature. Images were captured using a FEI G2 Spirit Twin microscope (60–80 kV, 6500–97000× magnification). TEM analysis was performed at the NRF at Washington University.
Results
Design, Synthesis, and General Properties of Compounds L0–L5
The synthesis of compound N4DA (Scheme 2) was previously described by Sherry et al.56,57 We used a slightly different procedure for its synthesis: the reaction of tert-butyl bromoacetate with N4H2 forms a diester intermediate, which upon hydrolysis generates L0 (N4DA) in quantitative yield. The BFCs L1–L5 were synthesized via Mannich reactions between 2-(4-hydroxy-3-methoxyphenyl)benzothiazole and metal-chelating groups such as 2,4-dimethyl-1,4,7-triazacyclononane (Me2tacn) and N4H2 or N4MeH in the presence of paraformaldehyde (Scheme 2). For the synthesis of L4, an acetate arm was introduced in L2 by reaction with tert-butyl bromoacetate in MeCN, followed by ester hydrolysis in 6 M HCl (Scheme 2).
Scheme 2. Syntheses of Ligands L0–L5 and the Corresponding Metal Complexes.

All synthesized compounds were characterized by 1H and 13C NMR, UV–vis and fluorescence spectroscopy, and ESI-MS. All BFCs exhibit absorption maxima at ∼330 nm, and upon excitation at this wavelength, emission maxima are observed at ∼450 nm (Figure 1). The BFCs L2 and L3 exhibit the highest intensities of emission, and the rest of the BFCs exhibit about the same fluorescence intensities, except L5, which shows the poorest emission spectra of all, most likely because of intermolecular quenching (Figure 1).
Figure 1.

Absorption (top) and fluorescence (bottom) spectra of the BFCs L1–L5 in phosphate-buffered saline.
Acidity Constant Determination
Protonation constants for all of the compounds used in this study were determined from pH-spectrophotometric titrations.66 Because ligands L0–L5 have functional groups that can undergo protonation/deprotonation such as amine, pyridyl, and phenol groups, multiple protonation constants (pKa) are expected. Two protonation constants for L0 were determined using pH-spectrophotometric titration, and the other two carboxylic groups were used from the literature.56 The first two protonation constants from our data were 8.18 and 5.77 assigned to the amine and pyridine groups, respectively. These values were slightly different from the previously reported values of 9.57 and 5.99,56 respectively, which were obtained by potentiometry. Unfortunately, the ligands L0–L5 have poor water solubility, and reliable potentiometry titrations could not be performed.67
For L1, the predominant species at pH ∼3.5 has an absorption band at 325 nm, while increasing the pH to ∼7 generates another species with an absorption band at 331 nm. A further increase in the pH results in a decrease of the 331 nm feature and the formation of a new band at 375 nm that reaches a maximum intensity at pH ∼11 (Figure 2). On the basis of these changes in the spectra, simulation of the data afforded four pKa values of 3.78, 6.35, 8.27, and 9.34. Analogous spectrophotometric titrations were carried out for L2–L5, and simulations reveal similar speciation diagrams (Figures S1–S5)63 and corresponding pKa values (Table 1). Overall, the highest pKa value can be assigned to deprotonation of the phenol group, while the other three pKa values likely correspond to deprotonation of the pyridinium and ammonium groups. It is worth mentioning that 1,4,7-triazacyclononane has been reported to exhibit two pKa values of 6.88 and 10.42.49 The pKa values of the amine groups in L1–L5 can be similar or even higher. While it is possible that the highest value that we observe may be due to an amine group, based on the dramatic spectral changes observed in this high pH range, we have assigned this pKa value to phenol deprotonation. Finally, it is important to note that pH UV–vis titrations may not be the optimal approach for obtaining accurate acidity constants for complex systems such as L5, so the pKa values obtained herein may be slightly less reliable.56
Table 1. List of pKa Values of L0–L5.
| L0 | L1 | L2 | L3 | L4 | L5 | |
|---|---|---|---|---|---|---|
| [HL1]/[L1]− (pKa4) | 8.18(8) | 9.34(1) | 10.14(1) | 9.60(1) | 9.98(2) | 10.65(3) |
| [H2L1]+/[HL1] (pKa3) | 5.77(6) | 8.27(2) | 9.34(3) | 8.02(1) | 8.71(3) | 8.22(4) |
| [H3L1]+2/[H2L1]+ (pKa2) | 2.59a | 6.35(2) | 7.84(4) | 5.61(5) | 6.93(4) | 7.39(5) |
| [H4L1]3+/[H3L1]2+ (pKa1) | 2.05a | 3.78(3) | 5.14(4) | 4.80(8) | 4.57(4) | 4.35(6) |
From ref (56).
Stability Constant Determination
To determine the affinity of these ligands toward Cu2+, UV–vis pH-spectrophotometric titrations were performed. Protonation constants of ligands and deprotonation of metal-bound H2O molecules were included in the calculations to determine the corresponding stability constants. For L0, no change in the UV–vis spectrum was observed in the 3–11 pH range, suggesting that, after Cu2+ chelation, the complex does not undergo deprotonation that affects the UV–vis spectrum. During the pH-spectrophotometric titration of L1 and Cu2+, no free Cu2+ was observed even at pH values as low as 3, indicating a high binding affinity of L1 toward Cu2+ (Figure S6).63 It is important to note that the presence of less than 10% of free metal ions at the beginning of the titration can lead to less reliable stability constants, and alternate NMR titrations56 or competitive titrations with other strong chelators68 are expected to give more accurate stability constant values. However, the calculated log K value of ∼32 at least suggests that the deprotonated L1 ligand exhibits a very high binding affinity for Cu2+ (Table 2), which is expected given the macrocyclic nature of the tacn chelating fragment. The small change in the spectra occurring from pH 3 to 9.5 and the shift from 350 to 358 nm are tentatively assigned to deprotonation of the metal-coordinated H2O molecule (Figure S6).63
Table 2. Stability Constants (log K Values) of the Copper Complexes of L1–L4, As Determined from pH-Spectrophotometric Titrations.
| log K |
||||
|---|---|---|---|---|
| reaction | L1 | L2 | L3 | L4 |
| M2+ + HL = [MHL]+2 | 2.88(1) | 4.01(1) | 3.01(1) | |
| M2+ + L– = [ML]+ | 31.96(6) | 27.09(4) | 27.22(4) | 30.10(5) |
| [ML(H2O)]+1 = [ML(OH)] + H+ | 10.14(6) | |||
The titration of L2 with Cu2+ reveals an absorption band at ∼330 nm at low pH values of 3–4, while at higher pH values, an absorption band at 400 nm develops that is tentatively assigned to a phenolate-to-Cu2+ charge-transfer (CT) band and suggests copper complex formation (Figure 3). Simulation of the titration data reveals a stability constant of log K = 27 for the deprotonated L2 ligand, which is slightly lower than that found for L1, yet it still supports a very high binding affinity for copper. Similarly, For all of the other BFCs L3–L5, a similar behavior was observed in the pH-spectrophotometric titrations with Cu2+ (Figures S7–S9).63 All of the BFCs exhibit high binding affinities toward Cu2+, as indicated by high stability constants of log K values of 27–30 (Table 2). While these values seem extremely high, previous studies have reported high stability constants of logK = 14–27 for other chelates using the same tacn or N4 metal-binding framework.48,49 The presence of an additional phenolate metal-binding arm from the amyloid-binding moiety can lead to the observed increase in affinity, which can thus be viewed as a synergistic effect specific for these bifunctional chelators. As expected, the addition of the acetate arm in L4 increases further the affinity for Cu by about three log units. Notably, along with tacn, the tetradentate N4 macrocyclic ring exhibits a high affinity for Cu2+ (Table 2). Finally, titration of L5 and Cu2+ reveals an absorption band at ∼330 nm in the 3–4 pH range, while a band at 400 nm grows in as the pH is increased, suggestive of a phenolate-to-Cu2+ CT transition, followed by the likely deprotonation of the second phenol group at pH ∼10. This behavior suggests that at neutral pH values one phenolate group coordinates to the Cu center while the other does not. While a high Cu binding affinity for L5 is suggested by these data, the complex spectral changes could not be fitted in HYPSPEC to give meaningful stability constants, most likely because of the presence of protonation constants that were too close in value to each other, as well as the possible formation of higher-nuclearity complexes (see below). However, it is expected that L5 exhibits stability constants similar to those observed for L1–L4.
Figure 3.

Variable-pH (pH 3–11) UV–vis spectra of a L2 and Cu2+ system ([L4] = [Cu2+] = 50 μM, 25 °C, and I = 0.1 M NaCl) and the species distribution plot.
For a better comparison of the Cu2+ binding affinities of these BFCs, pCu (−log [Cu]free) values were calculated at two pH values (Table 3). Interestingly, the pCu values of the BFCs L1–L4 with a macrocyclic chelating group are significantly higher than the nonmacrocyclic BFCs that we reported previously,51 as well as the standard strong chelators such as diethylenetriaminepentacetic acid (DTPA).69 However, these values are quite in the range of similar systems studied before for copper chelation.48−50 During the titration experiments, the spectral changes observed were immediate, suggesting a fast copper chelation. This is important for efficient 64Cu radiolabeling, which requires fast complexation and is also supported by rapid complexation and isolation of the corresponding copper(2+) complexes (see the Experimental Section). Overall, while thorough spectrophotometric titrations for a wider pH range could not be performed given the limited water solubility of these ligands, these results do strongly suggest that the BFCs L1–L5should be suitable as64Cu chelating agents, as supported by our recently published PET imaging studies.70
Table 3. Calculated pCu (−log [Cu]free) for a Solution Containing a 1:1 Metal/Ligand Mixture ([Cu2+]tot = [chelator]tot = 50 μM).
| L1 | L2 | L3 | L4 | DTPAa | |
|---|---|---|---|---|---|
| pH 6.6 | 12.8 | 11.7 | 11.5 | 12.0 | 9.7 |
| pH 7.4 | 13.3 | 13.5 | 12.3 | 14.1 | 10.7 |
Reference (69).
Isolation and Characterization of Copper(2+) Complexes
The tetranuclear L0-Cu complex 1 was prepared by reacting L0 with Cu(ClO4)2 in aqueous media at pH ∼4–5. Evaporation of the solvent afforded a green solid, which was dissolved in MeCN and, upon slow evaporation, yielded X-ray-quality crystals. The mononuclear L0-Cu complex 2 was obtained when 1 was dissolved in 1 M HCl and left to slowly evaporate for several days. Importantly, demetalation did not occur in such a highly acidic medium, suggesting that the N4 macrocycle is a strong chelator for Cu and thus could potentially be used in vivo.28,68 This increased acid stability of 2 inspired us to employ N4-based chelators to develop bifunctional compounds (BFC) that could be suitable for PET imaging applications upon labeling with 64Cu. Moreover, copper complexes of the BFCs L1–L5 could be isolated when stoichiometric amounts of ligand and Cu2+ salt were reacted in MeOH or MeCN in the presence of the base needed to deprotonate the phenol groups, which led to the formation of brown-red copper complexes that were characterized by X-ray crystallography, elemental analysis, UV–vis spectroscopy, ESI-MS, EPR spectroscopy, and cyclic voltammetry (CV; see below). Further characterization of these complexes by Job’s plot analysis reveals that in solution the species with 1:1 metal/ligand stoichiometry are most predominant (Figures S10–S14).63 However, in the solid state, complexes with different nuclearities are obtained (Scheme 2). While L1 forms a mononuclear complex with both Cu2+ (3) and Zn2+ (4), L2 forms with Cu2+ a dinuclear complex 5. In addition, the ligands L3 and L4 form with Cu2+ mononuclear complexes 6 and 7, respectively, while ligand L5 with Cu2+ yields a trinuclear complex 8 with a 2:3 metal/ligand stoichiometry, as shown from the X-ray structure determination (see below). For all copper complexes 2–8, a d–d absorption band was observed in the 600–800 nm range, along with more intense phenolate-to-Cu2+ CT bands in the 400–600 nm range (Figures S15–S20).63
X-ray Structures
The X-ray structure of 1 suggests a highly symmetric tetranuclear complex in the tetragonal I41/a space group (Figure 4, top). Each Cu center adopts a distorted octahedral geometry with coordination to the two pyridine and two amine N atoms of the N4 macrocycle and two carboxylate O atoms. One carboxylate is part of the same L0 ligand, while the other O atom belongs to another L0 ligand of the tetrameric complex. Notably, one acetate arm from each L0 ligand remains uncoordinated and in the protonated state. The bond distances between the Cu center and the N atoms of N4 are in the range of 1.953(3)–2.314(3) Å, typical for N4-Cu complexes.71 The two carboxylate O1 and O2 atoms are coordinated to Cu at distances of 2.191(2) and 1.901(2) Å, respectively.
Figure 4.

ORTEP plots of the tetracations of 1 (top) and 2 (bottom) at the 30% probability level. Perchlorate anions, solvent molecules, and H atoms are omitted for clarity. Selected bond lengths (Å) for 1: Cu1–N1 1.956(3), Cu1–N2 2.194(3), Cu1–N3 2.250(3), Cu1–N4 2.314(3), Cu1–O1 2.191(2), Cu1–O2 1.901(2). Selected bond lengths (Å) for 2: Cu1–N1 2.0271(19), Cu1–N2 2.0430(19), Cu1–N3 2.3984(19), Cu1–N4 2.3487(19), Cu1–Cl1 2.3145(6), Cu1–Cl2 2.2861(6).
The mononuclear complex 2 was obtained by recrystallization of 1 in 1 M HCl. Its X-ray structure reveals a Cu center in a distorted octahedral coordination that interacts with the four N atoms of N4 and two chloride anions (Figure 4, bottom). The Cu–Npyridine bond distances are 2.0271(19) and 2.0430(19) Å, while the amine N atoms occupy the axial positions and exhibit longer Cu–Namine bond distances of 2.3984(19) and 2.3487(19) Å. The choride anions occupy the other equatorial positions at distances of 2.3984(19) and 2.3487(19) Å from the Cu center, respectively. In general, the bond distances between the Cu center and the N atoms of N4 in 2 are longer than those in 1, likely because of the “opening” of the N4 chelate to allow for the intra- and intermolecular interactions of the Cu center with the acetate arms from two different L0 ligands.
Although X-ray-quality crystals for the L1-Cu complex 3 could not be obtained, the L1-Zn complex 4 was synthesized and single crystals were obtained by the slow evaporation of a MeOH/H2O solution. In 4, the Zn center exhibits a N3O3 octahedral coordination environment, with three N atoms from the tacn macrocycle, one phenolate O atom, and two O atoms from the two coordinated H2O molecules (Figure 5). The Zn–N bond distances are in the range of 2.163(5)–2.185(5) Å, while the Zn–N bond distances are in the range of 2.013(4)–2.258(4) Å. It is expected that the L1-Cu complex 3 may exhibit a more distorted octahedral or likely a five-coordinate geometry because of the Jahn–Teller effect, while the formation of a dinuclear complex in the solid state could not be excluded (see below).
Figure 5.

ORTEP plot of the cation of 4 at the 30% probability level. Perchlorate anions and H atoms are omitted for clarity. Selected bond lengths (Å) for 4: Zn1–N1 2.163(5), Zn1–N2 2.177(5), Zn1–N3 2.185(5), Zn1–O1 2.013(4), Zn1–O3 2.258(4), Zn1–O4 2.084(4).
Single crystals of the L2-Cu complex 5 were obtained by ether diffusion into a CH2Cl2 solution of 5. Interestingly, the complex consists of a discrete centrosymmetric [(L2)Cu]2 unit, where two phenolates are acting as bridging ligands between the two Cu centers (Figure 6). Each Cu center adopts a distorted octahedral geometry, with the pyridyl N atoms and the phenolate O atoms occupying the equatorial plane, while the amine N atoms take the axial positions. Notably, the two Cu centers are separated by 3.125 Å, and the Cu–O–Cu angle angle is 77.125°, which is the shortest phenolate bridging angle observed for diphenoxo-bridged copper complexes.72 The formation of such a dinuclear copper complex for L2 may be due to the lack of an N substituent on the second amine N atom of the N4 ligand, which limits steric clashes between the two L2 molecules. By comparison, the reactions of the ligands L3 and L4 with Cu2+ yield mononuclear complexes 6 and 7. Although these species could not be structurally characterized, it is expected that the presence of the bulkier methyl or acetate N substituent in L3 and L4 should sterically preclude the formation of dinuclear, phenolate-bridged complexes.
Figure 6.

ORTEP plot of the dication of 5 at the 30% probability level. Perchlorate anions and H atoms are omitted for clarity. Selected bond lengths (Å) for 5: Cu1–N1 2.002(4), Cu1–N2 2.015(4), Cu1–N3 2.387(4), Cu1–N4 2.283(4), Cu1–O1 2.002(3), Cu1–O2 1.995(3). Reproduced from ref (61).
The identity of ligand L5 was confirmed by X-ray crystallography (Figure S21),63 and single crystals of the L5-Cu complex 8 were obtained upon the slow evaporation from MeOH. Interestingly, the X-ray structure reveals a linear, trinuclear copper complex that is supported by only two L5 molecules that complete the distorted octahedral coordination environment of the two terminal Cu centers (Figure 7), while the square-pyramidal central Cu ion is coordinated by the four phenolate O atoms from the two L5 molecules and a H2O molecule. As expected, the amine N atoms occupy the axial positions of the two terminal Cu centers, at distances of ∼2.30 Å, while the pyridyl N atoms and phenolate O atoms are found in the equatorial plane. The Cu1–Cu2 distance is 3.044(3) Å and the Cu2–Cu3 distance is 3.054(3) Å, similar to other diphenoxo-bridged complexes.73 Notably, the Job’s plot analysis of 8 suggests the presence in an aqueous solution of a species with a 1:1 metal/ligand stoichiometry, which is expected given that H2O molecules should help dissociate the interactions between the central Cu ion and the phenolate O atoms.
Figure 7.

ORTEP plot of the dication of 8 at the 30% probability level. Perchlorate anions and H atoms are omitted for clarity. Selected bond lengths (Å) for 8: Cu1–N1 2.039(13), Cu1–N2 2.006(16) Cu1–N3, 2.302(15) Cu1–N4, 2.311(13), Cu1–O1 1.940(11), Cu1–O5 1.998(10), Cu2–O1 1.930(10), Cu2–O3 1.937(10), Cu2–O5 1.940(11), Cu2–O7 1.950(10), Cu2–O9 2.433(16), Cu3–N5 2.068(14), Cu3–N6 1.977(13), Cu3–N7 2.259(14), Cu3–N8 2.323(13), Cu3–O3 1.918(10), Cu3–O7 2.025(11), Cu1–Cu2 3.044(3), Cu2–Cu3 3.054(3). Reproduced from ref (61).
EPR Spectra of Copper Complexes
To further characterize the synthesized copper complexes, their X-band EPR spectra were recorded in frozen glasses at 77 K. The EPR spectrum of the L0-Cu mononuclear complex 2 in a 2:3 (v/v) 1 M HCl/glycerol frozen solution reveals a pseudoaxial EPR pattern with three different g values: gx = 2.290, gy = 2.075, and gz = 2.034 (Figure 8, top). Similarly, the EPR spectrum of the L1-Cu complex 3 in 1:3 MeCN/PrCN reveals a pseudoaxial EPR pattern with three different g values: gx = 2.256, gy = 2.075, and gz = 2.045 (Figure 8, bottom). In general, the R parameter [R = (gy – gz)/(gx – gy) with gx > gy > gz] can be indicative of the predominance of the dz2 or dx2–y2 orbital in the ground state of the unpaired electron of the Cu2+ ion. When R > 1, the greater contribution to the ground state arises from the dz2 orbital, while when R < 1, the greater contribution to the ground state comes from the dx2–y2 orbital.74,75 The R values of 0.19 determined for 2 and 0.16 for 3 are indicative of a predominantly dx2–y2 ground state, which is characteristic for copper(II) complexes with slightly rhombic symmetry and elongation of the axial bonds.48,76−78 The X-ray structure of 2 (see above) indeed suggests that all six metal–ligand bond distances are different and the Cu center is an axially elongated coordination environment, with the amine N atoms found in the axial positions. Because 3 has a EPR spectrum similar to that of 2, it can be assumed that the Cu center in 3 adopts an axially elongated geometry as well.
Figure 8.
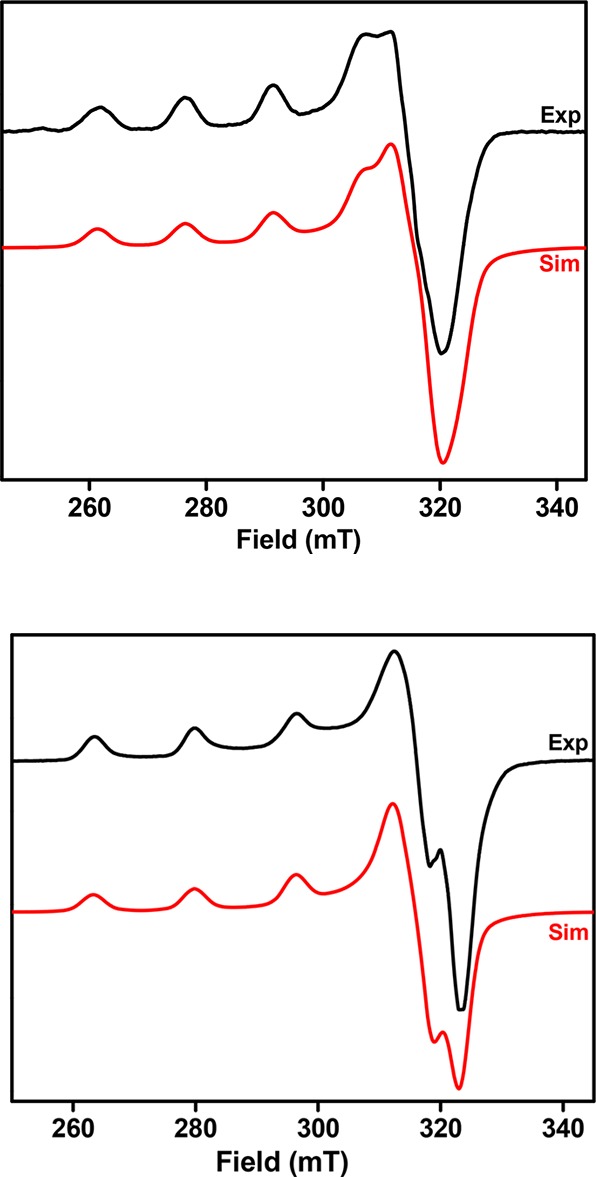
EPR spectra of the L0-Cu mononuclear complex 2 in 2:3 1 M HCl/glycerol (top) and the L1-Cu complex 3 in 1:3 MeCN/PrCN (bottom) at 77 K. The following parameters were used for the simulations: 2, gx = 2.290, Ax(Cu) = 150 G, gy = 2.075, and gz = 2.034; 3, gx = 2.256, Ax(Cu) = 165 G, gy = 2.075, and gz = 2.045.
Because the L2-Cu complex 5 is a diphenoxo-bridged dicopper complex, no EPR spectrum for this complex was observed, likely because of an antiferromagnetic coupling between the two Cu centers through the phenoxide bridging ligands. Finally, the L3-Cu complex 6 and L4-Cu complex 7, as well as the L5-Cu complex 8, exhibit intense EPR spectra (Figures S22–S24),63 suggesting that these complexes exist in solution as mononuclear species. However, the presence of closely spaced g values and hyperfine coupling to copper (I = 3/2) did not allow for an acceptable simulation of these EPR spectra.
Electrochemistry of Copper Complexes
The use of copper(II) complexes as radiopharmaceuticals could be hampered by demetalation of these complexes in vivo. The facile reduction of CuII to CuI by bioreductants in these complexes could facilitate the demetalation step, and thus complexes that exhibit more negative CuII/CuI redox potentials are desired. We set out to determine the CuII/CuI redox potentials of the synthesized copper complexes using CV in aqueous media at neutral pH to determine the CuII/CuI redox potentials versus Ag/AgCl reference electrode. The cyclic voltammograms of the L0-Cu complex 2 and the L2-Cu complex 5 are shown in Figure 9, while the cyclic voltammograms of all of the copper complexes 3, 6, 7, and 8 are shown in Figures S25–S28.63 The cyclic voltammograms of the L0-Cu complex 2, the L2-Cu complex 5, the L3-Cu complex 6, and the L4-Cu complex 7 show quasi-reversible CuII/CuI redox behavior, which indicates that these ligands can accommodate a CuI oxidation state as well. The cyclic voltammogram of the L1-Cu complex 3 was irreversible (Figure S25),63 while the cyclic voltammogram of the L5-Cu complex 8 did not show a clear cathodic peak, suggesting that the CuI oxidation state is quite unfavored because of the presence of two bridging phenolate O-atom donors. The electrochemical properties of these copper complexes are summarized in Table 4 and compared to other copper complexes used for similar imaging applications. Interestingly, all of the CuII/CuI redox potentials are fairly low in the range of −490 to −920 mV, similar to other copper complexes that have shown promise for radiolabeling and their potential use in in vivo imaging applications.48,49,79
Figure 9.

Cyclic voltammograms of the L0-Cu complex 2 (top; 0.1 M NaOAc/H2O) and the L2-Cu complex 5 (bottom; 0.1 M NaOAc in 1:1 MeCN/H2O) at 100 mV s–1 scan rates.
Table 4. Electrochemical Parameters for Complexes 2–8 and Other Relevant Copper Complexes.

Effect of L1–L5 on Aβ Aggregation
The BFCs L1–L5 were also evaluated for their ability to inhibit Aβ aggregation, in both the absence and presence of Cu2+ or Zn2+ ions. We have tested their effect on the inhibition of aggregation of the Aβ42 peptide, which was shown to be more prone to aggregate and form neurotoxic soluble Aβ oligomers.80−82 Freshly prepared monomeric Aβ42 solutions were treated with metal ions and/or BFCs, incubated for 24 h at 37 °C, and then analyzed by TEM and native gel electrophoresis/Western blotting. TEM analysis allows characterization of the larger, insoluble Aβ aggregates, while native gel electrophoresis/Western blotting probes the presence of smaller, soluble Aβ aggregates and their molecular weight distribution. As shown previously,51 the Aβ42 peptide forms large fibrils upon incubation for 24 h at 37 °C, and the metal ions affect the fibrilization process. Gratifyingly, all of the BFCs L1–L5 show good inhibition of the Aβ42 aggregation process, in both the absence or presence of Cu2+ or Zn2+. Western blot analysis shows that all of the BFCs tested reduce the formation of both insoluble Aβ42 aggregates (Figure 10) and large, neurotoxic soluble Aβ42 oligomers (Figure 11). Thus, none of the BFCs L1–L5 leads to an enhanced Aβ42 oligomerization in the absence or presence of metal ions and thus should not exhibit any neurotoxic side effects in in vivo studies.
Figure 10.

TEM images of Aβ42 species from inhibition experiments ([Aβ] = 25 μM, [M2+] = 25 μM, [BFC] = 25 μM, 24 h, and 37 °C). All scale bars represent 500 nm. Panels: 1, Aβ; 2, Aβ + Cu; 3, Aβ + Zn; 4, Aβ + L1; 5, Aβ + Cu + L1; 6, Aβ + Zn + L1; 7, Aβ + L2; 8, Aβ + Cu + L2; 9, Aβ + Zn + L2; 10, Aβ + L3; 11, Aβ + Cu + L3; 12, Aβ + Zn + L3; 13, Aβ + L4; 14, Aβ + Cu + L4; 15, Aβ + Zn + L4; 16, Aβ + L5; 17, Aβ + Cu + L5; 18, Aβ + Zn + L5. Reproduced from ref (61).
Figure 11.

Native gel electrophoresis/Western blot analysis of the inhibition of Aβ42 aggregation ([Aβ] = 25 μM, [M2+] = 25 μM, [compound] = 50 μM, 24 h, and 37 °C). Lanes: 1, Aβ; 2, Aβ + Cu; 3, Aβ + Zn; 4, Aβ + L1; 5, Aβ + Cu + L1; 6, Aβ + Zn + L1; 7, Aβ + L2; 8, Aβ + Cu + L2; 9, Aβ + Zn + L2; 10, Aβ + L3; 11, Aβ + Cu + L3; 12, Aβ + Zn + L3; 13, Aβ + L4; 14, Aβ + Cu + L4; 15, Aβ + Zn + L4; 16, Aβ + L5; 17, Aβ + Cu + L5; 18, Aβ + Zn + L5; 19, MW markers. Reproduced from ref (61).
Discussion
Because the in vivo stability of copper complexes is a critical factor for the design of optimal ligands 64Cu PET imaging applications, significant research has been devoted to the development of ligands that can form stable complexes of 64Cu. The use of macrocyclic ligands cyclam and cyclen, 1,4,7,10-tetraazacyclododecane-1,4,7,10-tetraacetic acid, triethylenetetramine, cross-bridged cyclam, and many other cyclic polyamines has been explored for this purpose,28 and many of these chelates have linked with targeting groups such as proteins, peptides, or antibodies to develop bifunctional imaging agents.32,83 For example, a family of bis(thiosemicarbazone) ligands, derived from 1,2-diones, have been under intense investigation as delivery vehicles for radioactive copper isotopes because they form stable and neutral, membrane-permeable copper complexes.68 However, in the context of neurodegenrative diseases like AD, to the best of our knowledge, only one recent report by Donnelly et al. describes the use of bifunctional 64Cu-labeled compounds that selectively bind Aβ aggregates.68 In that report bis(thiosemicarbazone) ligands appended with an amyloid-targeting stilbene functional group were employed, and their Cu complexes were shown to bind selectively to Aβ plaques in post-mortem samples of human brains from AD subjects. In the same report, the authors also employed a bis(thiosemicarbazone) ligand containing a benzothiazole moiety, yet it did not exhibit an appreciable affinity for Aβ plaques and thus it was not used in imaging studies.68
Benzothiazole- and stilbene-derived molecules display a high affinity for Aβ fibrils, most likely because these molecules interact with the hydrophobic pockets of amyloid fibrils through hydrophobic and π–π interactions. We have been using 2-phenylbenzothiazole-derived metal-chelating BFCs with high affinity for Aβ aggregates to control the metal-mediated aggregation and neurotoxicity of soluble Aβ oligomers.51,66 These bifunctional chelators are proposed to mediate interaction of the metal ions with the Aβ species and are of interest as potential therapeutics.84,85 Herein, we employed tacn and pyridinophane (N4) macrocycles, which are very strong copper chelators, and linked them with the amyloid-binding 2-phenylbenzothiazole fragment through Mannich reactions. These new BFCs could then be radiolabeled with 64Cu and thus become amyloid-binding PET imaging agents.
In general, a test to predict whether metal complexes are stable enough for in vivo applications is to investigate whether these complexes withstand demetalation in a strongly acidic medium. Harsh conditions (1–5 M HCl, 50–90 °C) are generally used to test the stability of copper complexes and whether they could be used for 64Cu radiopharmaceutical applications.28,49 In our case, we observed that the L0 ligand rapidly forms a stable copper complex in 1 M HCl, suggesting that the N4-derived ligands can be radiolabeled with 64Cu under mild conditions. In addition, the resulting L0-Cu complex is stable for days in 1 M HCl, suggesting that the N4 framework should instill appreciable kinetic stability of the corresponding complexes.56 While the copper complexes of the BFCs L2–L5 are expected to exhibit slightly lower stability constants than those for L0, UV–vis pH titrations reveal the presence of very few free Cu2+ ions in solution even at low pH values, thus suggesting their appreciable stability in acidic media. Importantly, we have previously shown that for BFCs related to those described herein, their stability constants for copper complexes are 2–3 orders of magnitude higher than those for the corresponding zinc complexes,51 thus suggesting that transmetalation with zinc for the copper complexes should not occur to an appreciable extent. In addition, the use of tacn as a metal chelator in the BFC L1 was inspired from the recently developed metal chelators with exceptional kinetic stability, both ex vivo and in vivo.49Finally, our recently published PET imaging and biodistribution studies strongly suggest that the BFCs L1–L5should be suitable as 64Cu chelating agents,70lending support to the coordination chemistry studies described herein.
The solution properties of the ligands L0–L5 were investigated in detail, as described above. All ligands exhibit very high stability constants for copper, and thus we can expect these chelators to be useful for Cu PET agents.61,70 Isolation and characterization of the corresponding copper complexes and their structural characterization enabled us to understand the coordination properties of the BFCs L1–L5. The calculated pCu values suggest that these chelators are stronger chelators than the conventionally used chelators such as DTPA. In addition, the formation of mononuclear complexes in solution with 1:1 metal/ligand stoichiometry is important for the development of low-molecular-weight PET imaging agents that need to cross the blood–brain barrier. Finally, another possible route of demetalation of copper complexes in vivo is the reduction of CuII to CuI by bioreductants; an estimated reduction potential of −400 mV versus NHE was determined for the typical bioreductants.27 CV experiments suggest that all of the copper complexes studied herein have lower reduction potentials than −400 mV and thus are expected to be less prone to reduction and demetalation in vivo.68
Conclusions
Metal complexes of macrocyclic chelators have increasingly versatile applications in the biomedical sciences, especially in radiopharmaceutical chemistry. The use of 64Cu radionuclide in PET imaging is a promising application, and one of the current challenges is to develop novel chelators that are able to meet the very strict metal-binding specifications for applications such as PET imaging or radiotherapy. In this report, we have presented the synthesis of five new copper chelators L1–L5. All chelators were prepared in good yields and were characterized by 1H and 13C NMR, UV–vis, and ESI-MS. The BFCs L1–L5 were designed to include the amyloid-binding 2-phenylbenzothiazole fragment, and thus upon labeling with 64Cu, they could be employed as PET imaging agents for the detection of Aβ aggregates in AD brains. As a first step, we have studied in detail the coordination chemistry of these chelators toward Cu2+. The copper complex of L0 is indefinitely stable in 1 M HCl, from which it can be isolated. In addition, the BFCs L1–L5 were shown to exhibit very high stability constants for Cu2+, as determined by pH-spectrophotometric titrations. The corresponding copper complexes of these BFCs were isolated, structurally characterized, and probed by UV–vis spectroscopy, EPR spectroscopy, and CV. Overall, these new BFCs are attractive candidates for the design of novel 64Cu-labeled agents for PET imaging applications in AD.61,70 Current studies in our laboratories are focused on probing the PET imaging properties of the 64Cu-labeled BFCs described herein.
Acknowledgments
We acknowledge research funding from the NIH (Grant R01GM114588), Alzheimer’s Association (Grant NIRG 12-259199), Washington University Alzheimer’s Disease Research Center (Grant NIH P50-AG05681), and McDonnell Center for Cellular and Molecular Neurobiology at Washington University School of Medicine.
Supporting Information Available
The Supporting Information is available free of charge on the ACS Publications website at DOI: 10.1021/acs.inorgchem.7b01883.
pH-spectrophotometric titrations for ligands and copper complexes, Job’s plots, UV–vis and EPR spectra and CVs of copper complexes, and X-ray structure characterization details (PDF)
Accession Codes
CCDC 1563650–1563655 contain the supplementary crystallographic data for this paper. These data can be obtained free of charge via www.ccdc.cam.ac.uk/data_request/cif, or by emailing data_request@ccdc.cam.ac.uk, or by contacting The Cambridge Crystallographic Data Centre, 12 Union Road, Cambridge CB2 1EZ, UK; fax: +44 1223 336033.
Author Present Address
‡ Department of Chemistry, Central University of Rajasthan, NH-8, Bandar Sindri, Ajmer, India 305801.
The authors declare no competing financial interest.
Supplementary Material
References
- Alzheimer’s Disease Facts and Figures: Annual Report from www.alz.org, 2017.
- Perrin R. J.; Fagan A. M.; Holtzman D. M. Multimodal techniques for diagnosis and prognosis of Alzheimer’s disease. Nature 2009, 461, 916–922. 10.1038/nature08538. [DOI] [PMC free article] [PubMed] [Google Scholar]
- Ferri C. P.; Prince M.; Brayne C.; Brodaty H.; Fratiglioni L.; Ganguli M.; Hall K.; Hasegawa K.; Hendrie H.; Huang Y.; Jorm A.; Mathers C.; Menezes P. R.; Rimmer E.; Scazufca M. Global prevalence of dementia: a Delphi consensus study. Lancet 2005, 366, 2112–2117. 10.1016/S0140-6736(05)67889-0. [DOI] [PMC free article] [PubMed] [Google Scholar]
- Hardy J. A.; Higgins G. A. Alzheimer’s disease: the amyloid cascade hypothesis. Science 1992, 256, 184–185. 10.1126/science.1566067. [DOI] [PubMed] [Google Scholar]
- Jakob-Roetne R.; Jacobsen H. Alzheimer’s Disease: From Pathology to Therapeutic Approaches. Angew. Chem., Int. Ed. 2009, 48, 3030–3059. 10.1002/anie.200802808. [DOI] [PubMed] [Google Scholar]
- Musiek E. S.; Holtzman D. M. Three dimensions of the amyloid hypothesis: time, space and ’wingmen’. Nat. Neurosci. 2015, 18, 800–806. 10.1038/nn.4018. [DOI] [PMC free article] [PubMed] [Google Scholar]
- Ising C.; Stanley M.; Holtzman D. M. Current Thinking on the Mechanistic Basis of Alzheimer’s and Implications for Drug Development. Clin. Pharmacol. Ther. 2015, 98, 469–471. 10.1002/cpt.200. [DOI] [PubMed] [Google Scholar]
- Mucke L. NEUROSCIENCE: Alzheimer’s disease. Nature 2009, 461, 895–897. 10.1038/461895a. [DOI] [PubMed] [Google Scholar]
- Mathis C. A.; Wang Y.; Klunk W. E. Imaging β-amyloid plaques and neurofibrillary tangles in the aging human brain. Curr. Pharm. Des. 2004, 10, 1469–1492. 10.2174/1381612043384772. [DOI] [PubMed] [Google Scholar]
- Selkoe D. J. Imaging Alzheimer’s amyloid. Nat. Biotechnol. 2000, 18, 823–824. 10.1038/78422. [DOI] [PubMed] [Google Scholar]
- Mathis C. A.; Wang Y.; Holt D. P.; Huang G.-F.; Debnath M. L.; Klunk W. E. Synthesis and Evaluation of 11C-Labeled 6-Substituted 2-Arylbenzothiazoles as Amyloid Imaging Agents. J. Med. Chem. 2003, 46, 2740–2754. 10.1021/jm030026b. [DOI] [PubMed] [Google Scholar]
- Klunk W. E.; Engler H.; Nordberg A.; Wang Y. M.; Blomqvist G.; Holt D. P.; Bergstrom M.; Savitcheva I.; Huang G. F.; Estrada S.; Ausen B.; Debnath M. L.; Barletta J.; Price J. C.; Sandell J.; Lopresti B. J.; Wall A.; Koivisto P.; Antoni G.; Mathis C. A.; Langstrom B. Imaging brain amyloid in Alzheimer’s disease with Pittsburgh Compound-B. Ann. Neurol. 2004, 55, 306–319. 10.1002/ana.20009. [DOI] [PubMed] [Google Scholar]
- Ono M.; Wilson A.; Nobrega J.; Westaway D.; Verhoeff P.; Zhuang Z.-P.; Kung M.-P.; Kung H. F. 11C-labeled stilbene derivatives as Aβ-aggregate-specific PET imaging agents for Alzheimer’s disease. Nucl. Med. Biol. 2003, 30, 565–571. 10.1016/S0969-8051(03)00049-0. [DOI] [PubMed] [Google Scholar]
- Zhang W.; Oya S.; Kung M.-P.; Hou C.; Maier D. L.; Kung H. F. F-18 Polyethyleneglycol stilbenes as PET imaging agents targeting Aβ aggregates in the brain. Nucl. Med. Biol. 2005, 32, 799–809. 10.1016/j.nucmedbio.2005.06.001. [DOI] [PubMed] [Google Scholar]
- Kudo Y.; Okamura N.; Furumoto S.; Tashiro M.; Furukawa K.; Maruyama M.; Itoh M.; Iwata R.; Yanai K.; Arai H. 2-(2-[2-Dimethylaminothiazol-5-yl]Ethenyl)-6- (2-[Fluoro]Ethoxy)Benzoxazole: A Novel PET Agent for In Vivo Detection of Dense Amyloid Plaques in Alzheimer’s Disease Patients. J. Nucl. Med. 2007, 48, 553–561. 10.2967/jnumed.106.037556. [DOI] [PubMed] [Google Scholar]
- Agdeppa E. D.; Kepe V.; Liu J.; Flores-Torres S.; Satyamurthy N.; Petric A.; Cole G. M.; Small G. W.; Huang S. C.; Barrio J. R. Binding characteristics of radiofluorinated 6-dialkylamino-2-naphthylethylidene derivatives as positron emission tomography imaging probes for beta-amyloid plaques in Alzheimer’s disease. J. Neurosci. 2001, 21, RC189. [DOI] [PMC free article] [PubMed] [Google Scholar]
- Zhang W.; Kung M.-P.; Oya S.; Hou C.; Kung H. F. 18F-labeled styrylpyridines as PET agents for amyloid plaque imaging. Nucl. Med. Biol. 2007, 34, 89–97. 10.1016/j.nucmedbio.2006.10.003. [DOI] [PubMed] [Google Scholar]
- Choi S. R.; Golding G.; Zhuang Z.; Zhang W.; Lim N.; Hefti F.; Benedum T. E.; Kilbourn M. R.; Skovronsky D.; Kung H. F. Preclinical Properties of 18F-AV-45: A PET Agent for Aβ Plaques in the Brain. J. Nucl. Med. 2009, 50, 1887–1894. 10.2967/jnumed.109.065284. [DOI] [PMC free article] [PubMed] [Google Scholar]
- Nordberg A. Amyloid imaging in Alzheimer’s disease. Curr. Opin. Neurol. 2007, 20, 398–402. 10.1097/WCO.0b013e3281a47744. [DOI] [PubMed] [Google Scholar]
- Archer H. A.; Edison P.; Brooks D. J.; Barnes J.; Frost C.; Yeatman T.; Fox N. C.; Rossor M. N. Amyloid load and cerebral atrophy in Alzheimer’s disease: an 11C-PIB positron emission tomography study. Ann. Neurol. 2006, 60, 145–7. 10.1002/ana.20889. [DOI] [PubMed] [Google Scholar]
- Kemppainen N. M.; Aalto S.; Wilson I. A.; Nagren K.; Helin S.; Bruck A.; Oikonen V.; Kailajarvi M.; Scheinin M.; Viitanen M.; Parkkola R.; Rinne J. O. Voxel-based analysis of PET amyloid ligand [11C]PIB uptake in Alzheimer disease. Neurology 2006, 67, 1575–80. 10.1212/01.wnl.0000240117.55680.0a. [DOI] [PubMed] [Google Scholar]
- Mintun M. A.; Larossa G. N.; Sheline Y. I.; Dence C. S.; Lee S. Y.; Mach R. H.; Klunk W. E.; Mathis C. A.; DeKosky S. T.; Morris J. C. [11C]PIB in a nondemented population: potential antecedent marker of Alzheimer disease. Neurology 2006, 67, 446–52. 10.1212/01.wnl.0000228230.26044.a4. [DOI] [PubMed] [Google Scholar]
- Engler H.; Forsberg A.; Almkvist O.; Blomquist G.; Larsson E.; Savitcheva I.; Wall A.; Ringheim A.; Langstrom B.; Nordberg A. Two-year follow-up of amyloid deposition in patients with Alzheimer’s disease. Brain 2006, 129, 2856–66. 10.1093/brain/awl178. [DOI] [PubMed] [Google Scholar]
- Choi S. R.; Golding G.; Zhuang Z.; Zhang W.; Lim N.; Hefti F.; Benedum T. E.; Kilbourn M. R.; Skovronsky D.; Kung H. F. Preclinical properties of 18F-AV-45: a PET agent for Abeta plaques in the brain. J. Nucl. Med. 2009, 50, 1887–94. 10.2967/jnumed.109.065284. [DOI] [PMC free article] [PubMed] [Google Scholar]
- Wong D. F.; Rosenberg P. B.; Zhou Y.; Kumar A.; Raymont V.; Ravert H. T.; Dannals R. F.; Nandi A.; Brasic J. R.; Ye W.; Hilton J.; Lyketsos C.; Kung H. F.; Joshi A. D.; Skovronsky D. M.; Pontecorvo M. J. In vivo imaging of amyloid deposition in Alzheimer disease using the radioligand 18F-AV-45 (florbetapir F18). J. Nucl. Med. 2010, 51, 913–20. 10.2967/jnumed.109.069088. [DOI] [PMC free article] [PubMed] [Google Scholar]
- Clark C. M.; Schneider J. A.; Bedell B. J.; Beach T. G.; Bilker W. B.; Mintun M. A.; Pontecorvo M. J.; Hefti F.; Carpenter A. P.; Flitter M. L.; Krautkramer M. J.; Kung H. F.; Coleman R. E.; Doraiswamy P. M.; Fleisher A. S.; Sabbagh M. N.; Sadowsky C. H.; Reiman E. P.; Zehntner S. P.; Skovronsky D. M.; Group A. A. S. Use of florbetapir-PET for imaging beta-amyloid pathology. J. Am. Med. Soc. 2011, 305, 275–83. [DOI] [PMC free article] [PubMed] [Google Scholar]
- Shokeen M.; Anderson C. J. Molecular Imaging of Cancer with Copper-64 Radiopharmaceuticals and Positron Emission Tomography (PET). Acc. Chem. Res. 2009, 42, 832–841. 10.1021/ar800255q. [DOI] [PMC free article] [PubMed] [Google Scholar]
- Wadas T. J.; Wong E. H.; Weisman G. R.; Anderson C. J. Copper chelation chemistry and its role in copper radiopharmaceuticals. Curr. Pharm. Des. 2007, 13, 3–16. 10.2174/138161207779313768. [DOI] [PubMed] [Google Scholar]
- Blower P. J.; Lewis J. S.; Zweit J. Copper radionuclides and radiopharmaceuticals in nuclear medicine. Nucl. Med. Biol. 1996, 23, 957–980. 10.1016/S0969-8051(96)00130-8. [DOI] [PubMed] [Google Scholar]
- Maheshwari V.; Dearling J. L. J.; Treves S. T.; Packard A. B. Measurement of the rate of copper(II) exchange for 64Cu complexes of bifunctional chelators. Inorg. Chim. Acta 2012, 393, 318–323. 10.1016/j.ica.2012.07.012. [DOI] [Google Scholar]
- Voss S. D.; Smith S. V.; DiBartolo N.; McIntosh L. J.; Cyr E. M.; Bonab A. A.; Dearling J. L. J.; Carter E. A.; Fischman A. J.; Treves S. T.; Gillies S. D.; Sargeson A. M.; Huston J. S.; Packard A. B. Positron emission tomography (PET) imaging of neuroblastoma and melanoma with 64Cu-SarAr immunoconjugates. Proc. Natl. Acad. Sci. U. S. A. 2007, 104, 17489–17493. 10.1073/pnas.0708436104. [DOI] [PMC free article] [PubMed] [Google Scholar]
- Anderson C. J.; Ferdani R. Copper-64 radiopharmaceuticals for PET imaging of cancer: advances in preclinical and clinical research. Cancer Biother.Radiopharm. 2009, 24, 379–93. 10.1089/cbr.2009.0674. [DOI] [PMC free article] [PubMed] [Google Scholar]
- Sun X.; Wuest M.; Weisman G. R.; Wong E. H.; Reed D. P.; Boswell C. A.; Motekaitis R.; Martell A. E.; Welch M. J.; Anderson C. J. Radiolabeling and In Vivo Behavior of Copper-64-Labeled Cross-Bridged Cyclam Ligands. J. Med. Chem. 2002, 45, 469–477. 10.1021/jm0103817. [DOI] [PubMed] [Google Scholar]
- Boswell C. A.; Sun X.; Niu W.; Weisman G. R.; Wong E. H.; Rheingold A. L.; Anderson C. J. Comparative in Vivo Stability of Copper-64-Labeled Cross-Bridged and Conventional Tetraazamacrocyclic Complexes. J. Med. Chem. 2004, 47, 1465–1474. 10.1021/jm030383m. [DOI] [PubMed] [Google Scholar]
- Wong E. H.; Weisman G. R.; Hill D. C.; Reed D. P.; Rogers M. E.; Condon J. S.; Fagan M. A.; Calabrese J. C.; Lam K.-C.; Guzei I. A.; Rheingold A. L. Synthesis and Characterization of Cross-Bridged Cyclams and Pendant-Armed Derivatives and Structural Studies of Their Copper(II) Complexes. J. Am. Chem. Soc. 2000, 122, 10561–10572. 10.1021/ja001295j. [DOI] [Google Scholar]
- Ferdani R.; Stigers D. J.; Fiamengo A. L.; Wei L.; Li B. T. Y.; Golen J. A.; Rheingold A. L.; Weisman G. R.; Wong E. H.; Anderson C. J. Synthesis, Cu(ii) complexation, 64Cu-labeling and biological evaluation of cross-bridged cyclam chelators with phosphonate pendant arms. Dalton Trans. 2012, 41, 1938–1950. 10.1039/C1DT11743B. [DOI] [PMC free article] [PubMed] [Google Scholar]
- Bartholomä M. D. Recent developments in the design of bifunctional chelators for metal-based radiopharmaceuticals used in Positron Emission Tomography. Inorg. Chim. Acta 2012, 389, 36–51. 10.1016/j.ica.2012.01.061. [DOI] [Google Scholar]
- Ratnakar S. J.; Viswanathan S.; Kovacs Z.; Jindal A. K.; Green K. N.; Sherry A. D. Europium(III) DOTA-tetraamide Complexes as Redox-Active MRI Sensors. J. Am. Chem. Soc. 2012, 134, 5798–5800. 10.1021/ja211601k. [DOI] [PMC free article] [PubMed] [Google Scholar]
- Rojas-Quijano F. A.; Tircsó G.; Tircsóné Benyó E.; Baranyai Z.; Tran Hoang H.; Kálmán F. K.; Gulaka P. K.; Kodibagkar V. D.; Aime S.; Kovács Z.; Sherry A. D. Synthesis and Characterization of a Hypoxia-Sensitive MRI Probe. Chem. - Eur. J. 2012, 18, 9669–9676. 10.1002/chem.201200266. [DOI] [PMC free article] [PubMed] [Google Scholar]
- Green K. N.; Viswanathan S.; Rojas-Quijano F. A.; Kovacs Z.; Sherry A. D. Europium(III) DOTA-Derivatives Having Ketone Donor Pendant Arms Display Dramatically Slower Water Exchange. Inorg. Chem. 2011, 50, 1648–1655. 10.1021/ic101856d. [DOI] [PMC free article] [PubMed] [Google Scholar]
- Carney C. E.; Tran A. D.; Wang J.; Schabel M. C.; Sherry A. D.; Woods M. Towards the Rational Design of MRI Contrast Agents: δ-Substitution of Lanthanide(III) NB-DOTA-Tetraamide Chelates Influences but Does Not Control Coordination Geometry. Chem. - Eur. J. 2011, 17, 10372–10378. 10.1002/chem.201101007. [DOI] [PMC free article] [PubMed] [Google Scholar]
- Varasteh Z.; Velikyan I.; Lindeberg G.; Sörensen J.; Larhed M.; Sandström M.; Selvaraju R. K.; Malmberg J.; Tolmachev V.; Orlova A. Synthesis and Characterization of a High-Affinity NOTA-Conjugated Bombesin Antagonist for GRPR-Targeted Tumor Imaging. Bioconjugate Chem. 2013, 24, 1144–1153. 10.1021/bc300659k. [DOI] [PubMed] [Google Scholar]
- Chang A. J.; Sohn R.; Lu Z. H.; Arbeit J. M.; Lapi S. E. Detection of Rapalog-Mediated Therapeutic Response in Renal Cancer Xenografts Using 64Cu-bevacizumab ImmunoPET. PLoS One 2013, 8, 1–8. 10.1371/journal.pone.0058949. [DOI] [PMC free article] [PubMed] [Google Scholar]
- Ferreira C. L.; Bayly S. R.; Green D. E.; Storr T.; Barta C. A.; Steele J.; Adam M. J.; Orvig C. Carbohydrate-appended 3-hydroxy-4-pyridinone complexes of the [M(CO)(3)](+) core (M) Re, Tc-99m, Re-186). Bioconjugate Chem. 2006, 17, 1321–1329. 10.1021/bc060085e. [DOI] [PubMed] [Google Scholar]
- Ferreira C. L.; Yapp D. T. T.; Mandel D.; Gill R. K.; Boros E.; Wong M. Q.; Jurek P.; Kiefer G. E. 68Ga Small Peptide Imaging: Comparison of NOTA and PCTA. Bioconjugate Chem. 2012, 23, 2239–2246. 10.1021/bc300348d. [DOI] [PubMed] [Google Scholar]
- Bailey G. A.; Price E. W.; Zeglis B. M.; Ferreira C. L.; Boros E.; Lacasse M. J.; Patrick B. O.; Lewis J. S.; Adam M. J.; Orvig C. H2azapa: a Versatile Acyclic Multifunctional Chelator for 67Ga, 64Cu, 111In, and 177Lu. Inorg. Chem. 2012, 51, 12575–12589. 10.1021/ic302225z. [DOI] [PMC free article] [PubMed] [Google Scholar]
- Boros E.; Cawthray J. F.; Ferreira C. L.; Patrick B. O.; Adam M. J.; Orvig C. Evaluation of the H2dedpa Scaffold and its cRGDyK Conjugates for Labeling with 64Cu. Inorg. Chem. 2012, 51, 6279–6284. 10.1021/ic300482x. [DOI] [PubMed] [Google Scholar]
- Esteves C. V.; Lamosa P.; Delgado R.; Costa J.; Désogère P.; Rousselin Y.; Goze C.; Denat F. Remarkable Inertness of Copper(II) Chelates of Cyclen-Based Macrobicycles with Two trans-N-Acetate Arms. Inorg. Chem. 2013, 52, 5138–5153. 10.1021/ic400015v. [DOI] [PubMed] [Google Scholar]
- Roger M.; Lima L. M. P.; Frindel M.; Platas-Iglesias C.; Gestin J.-F.; Delgado R.; Patinec V.; Tripier R. Monopicolinate-dipicolyl Derivative of Triazacyclononane for Stable Complexation of Cu2+ and 64Cu2+. Inorg. Chem. 2013, 52, 5246–5259. 10.1021/ic400174r. [DOI] [PubMed] [Google Scholar]
- Comba P.; Hunoldt S.; Morgen M.; Pietzsch J.; Stephan H.; Wadepohl H. Optimization of Pentadentate Bispidines as Bifunctional Chelators for 64Cu Positron Emission Tomography (PET). Inorg. Chem. 2013, 52, 8131–8143. 10.1021/ic4008685. [DOI] [PubMed] [Google Scholar]
- Sharma A. K.; Pavlova S. T.; Kim J.; Finkelstein D.; Hawco N. J.; Rath N. P.; Kim J.; Mirica L. M. Bifunctional Compounds for Controlling Metal-Mediated Aggregation of the Aβ42 Peptide. J. Am. Chem. Soc. 2012, 134, 6625–6636. 10.1021/ja210588m. [DOI] [PMC free article] [PubMed] [Google Scholar]
- Sharma A. K.; Kim J.; Prior J. T.; Hawco N. J.; Rath N. P.; Kim J.; Mirica L. M. Small Bifunctional Chelators That Do Not Disaggregate Amyloid β Fibrils Exhibit Reduced Cellular Toxicity. Inorg. Chem. 2014, 53, 11367–11376. 10.1021/ic500926c. [DOI] [PMC free article] [PubMed] [Google Scholar]
- Sharma A. K.; Pavlova S. T.; Kim J.; Kim J.; Mirica L. M. The effect of Cu2+ and Zn2+ on the A[small beta]42 peptide aggregation and cellular toxicity. Metallomics 2013, 5, 1529–1536. 10.1039/c3mt00161j. [DOI] [PMC free article] [PubMed] [Google Scholar]
- Zhang Y.; Rempel D. L.; Zhang J.; Sharma A. K.; Mirica L. M.; Gross M. L. Pulsed hydrogen–deuterium exchange mass spectrometry probes conformational changes in amyloid beta (Aβ) peptide aggregation. Proc. Natl. Acad. Sci. U. S. A. 2013, 110, 14604–14609. 10.1073/pnas.1309175110. [DOI] [PMC free article] [PubMed] [Google Scholar]
- Necula M.; Kayed R.; Milton S.; Glabe C. G. Small Molecule Inhibitors of Aggregation Indicate That Amyloid β Oligomerization and Fibrillization Pathways Are Independent and Distinct. J. Biol. Chem. 2007, 282, 10311–10324. 10.1074/jbc.M608207200. [DOI] [PubMed] [Google Scholar]
- Kim W. D.; Hrncir D. C.; Kiefer G. E.; Sherry A. D. Synthesis, Crystal Structure, and Potentiometry of Pyridine-Containing Tetraaza Macrocyclic Ligands with Acetate Pendant Arms. Inorg. Chem. 1995, 34, 2225–2232. 10.1021/ic00112a040. [DOI] [Google Scholar]
- Kim W. D.; Kiefer G. E.; Maton F.; McMillan K.; Muller R. N.; Sherry A. D. Relaxometry, Luminescence Measurement, Electrophoresis, and Animal Biodistribution of Lanthanide(III) Complexes of Some Polyaza Macrocyclic Acetates Containing Pyridine. Inorg. Chem. 1995, 34, 2233–2243. 10.1021/ic00112a041. [DOI] [Google Scholar]
- Bottino F.; Di Grazia M.; Finocchiaro P.; Fronczek F. R.; Mamo A.; Pappalardo S. Reaction of Tosylamide Monosodium Salt with Bis(halomethyl) Compounds: an Easy Entry to Symmetrical N-tosylazamacrocycles. J. Org. Chem. 1988, 53, 3521–9. 10.1021/jo00250a020. [DOI] [Google Scholar]
- Wessel A. J.; Schultz J. W.; Tang F.; Duan H.; Mirica L. M.. Improved Synthesis of Symmetrically & Asymmetrically N-Substituted Pyridinophane Derivatives. Org. Biomol. Chem. 2017, submitted [DOI] [PMC free article] [PubMed]
- Koek J. H.; Russell S. W.; vanderWolf L.; Hage R.; Warnaar J. B.; Spek A. L.; Kerschner J.; DelPizzo L. Improved syntheses, structures, spectral and electrochemical properties of [Mn-2(III)(mu-O)(mu-O(2)CMe)(2)L(2)](2+) and [Mn-2(IV)(mu-O)(3)L(2)](2+) complexes. Two homologous series derived from eight N-substituted 1,4,7-triazacyclononanes. J. Chem. Soc., Dalton Trans. 1996, 353–362. 10.1039/DT9960000353. [DOI] [Google Scholar]
- Mirica L. M.; Sharma A. K.; Schultz J. W.. Metal-Binding Bifunctional Compounds as Diagnostic Agents for Alzheimer’s Disease. U.S. Patent 2015/0209452, July 30, 2015.
- Sheldrick G. M. Bruker-SHELXTL. Acta Crystallogr., Sect. A: Found. Crystallogr. 2008, 64, 112–122. 10.1107/S0108767307043930. [DOI] [PubMed] [Google Scholar]
- See the Supporting Information.
- Gans P.; Sabatini A.; Vacca A. Determination of equilibrium constants from spectrophotometric data obtained from solutions of known pH: The program pHab. Ann. Chim. 1999, 45. [Google Scholar]
- Alderighi L. Hyperquad simulation and speciation (HySS): A utility program for the investigaion of equilibria involving soluble and partially soluble species. Coord. Chem. Rev. 1999, 184, 311. [Google Scholar]
- Sharma A. K.; Kim J.; Prior J. T.; Hawco N. J.; Rath N. P.; Kim J.; Mirica L. M. Small Bifunctional Chelators that Do Not Dissagregate Amyloid Fibrils Show Reduced Celular Toxicity. Inorg. Chem. 2014, 53, 11367–11376. 10.1021/ic500926c. [DOI] [PMC free article] [PubMed] [Google Scholar]
- Storr T.; Merkel M.; Song-Zhao G. X.; Scott L. E.; Green D. E.; Bowen M. L.; Thompson K. H.; Patrick B. O.; Schugar H. J.; Orvig C. Synthesis, characterization, and metal coordinating ability of multifunctional carbohydrate-containing compounds for Alzheimer’s therapy. J. Am. Chem. Soc. 2007, 129, 7453–7463. 10.1021/ja068965r. [DOI] [PubMed] [Google Scholar]
- Hickey J. L.; Lim S.; Hayne D. J.; Paterson B. M.; White J. M.; Villemagne V. L.; Roselt P.; Binns D.; Cullinane C.; Jeffery C. M.; Price R. I.; Barnham K. J.; Donnelly P. S. Diagnostic Imaging Agents for Alzheimer’s Disease: Copper Radiopharmaceuticals that Target A beta Plaques. J. Am. Chem. Soc. 2013, 135, 16120–16132. 10.1021/ja4057807. [DOI] [PubMed] [Google Scholar]
- Martell A. E.; Smith R. M.. Critical Stability Constants; Plenum: New York, 1976; Vol. IV, p 1. [Google Scholar]
- Bandara N.; Sharma A. K.; Krieger S.; Schultz J. W.; Han B. H.; Rogers B. E.; Mirica L. M. Evaluation of 64Cu-Based Radiopharmaceuticals that Target Aβ Peptide Aggregates as Diagnostic Tools for Alzheimer’s Disease. J. Am. Chem. Soc. 2017, 139, 12550–12558. 10.1021/jacs.7b05937. [DOI] [PMC free article] [PubMed] [Google Scholar]
- Khusnutdinova J. R.; Luo J.; Rath N. P.; Mirica L. M. Late First-Row Transition Metal Complexes of a Tetradentate Pyridinophane Ligand: Electronic Properties and Reactivity Implications. Inorg. Chem. 2013, 52, 3920–3932. 10.1021/ic400260z. [DOI] [PubMed] [Google Scholar]
- Chaudhuri P.; Querbach J.; Wieghardt K.; Nuber B.; Weiss J. Synthesis, electrochemistry, and magnetic properties of binuclear cobalt complexes containing the Co2(mu-x)(mu-carboxylato)2n+ core (x = oh, cl, or br - n = 1–3) - the crystal structures of [co2ii(mu-clh2cco2)2(mu-cl)l2]pf6 and [coiicoiii(mu-meco2)2(mu-oh)l2][clo4]2.0.5h2o(l = n,n′,n″-trimethyl-1,4,7-triazacyclononane). J. Chem. Soc., Dalton Trans. 1990, 271–278. 10.1039/DT9900000271. [DOI] [Google Scholar]
- Mukherjee A.; Lloret F.; Mukherjee R. Synthesis and Properties of Diphenoxo-Bridged CoII, NiII, CuII, and ZnII Complexes of a New Tripodal Ligand: Generation and Properties of MII-Coordinated Phenoxyl Radical Species. Inorg. Chem. 2008, 47, 4471–4480. 10.1021/ic701283b. [DOI] [PubMed] [Google Scholar]
- Garribba E.; Micera G. The determination of the geometry of Cu(II) complexes - An EPR spectroscopy experiment. J. Chem. Educ. 2006, 83, 1229–1232. 10.1021/ed083p1229. [DOI] [Google Scholar]
- Halcrow M. A. Interpreting and controlling the structures of six-coordinate copper(II) centres – when is a compression really a compression?. Dalton Trans. 2003, 4375–4384. 10.1039/B309242A. [DOI] [Google Scholar]
- Hathaway B. J.; Billing D. E. The electronic properties and stereochemistry of mono-nuclear complexes of the copper(II) ion. Coord. Chem. Rev. 1970, 5, 143–207. 10.1016/S0010-8545(00)80135-6. [DOI] [Google Scholar]
- Hathaway B. J.; Tomlinson A. A. G. Copper(II) ammonia complexes. Coord. Chem. Rev. 1970, 5, 1–43. 10.1016/S0010-8545(00)80073-9. [DOI] [Google Scholar]
- Lever A. B. P.Inorganic electronic spectroscopy; Elsevier, 1984. [Google Scholar]
- Woodin K. S.; Heroux K. J.; Boswell C. A.; Wong E. H.; Weisman G. R.; Niu W.; Tomellini S. A.; Anderson C. J.; Zakharov L. N.; Rheingold A. L. Kinetic Inertness and Electrochemical Behavior of Copper(II) Tetraazamacrocyclic Complexes: Possible Implications for in Vivo Stability. Eur. J. Inorg. Chem. 2005, 2005, 4829–4833. 10.1002/ejic.200500579. [DOI] [Google Scholar]
- Gong Y. S.; Chang L.; Viola K. L.; Lacor P. N.; Lambert M. P.; Finch C. E.; Krafft G. A.; Klein W. L. Alzheimer’s disease-affected brain: Presence of oligomeric A beta ligands (ADDLs) suggests a molecular basis for reversible memory loss. Proc. Natl. Acad. Sci. U. S. A. 2003, 100, 10417–10422. 10.1073/pnas.1834302100. [DOI] [PMC free article] [PubMed] [Google Scholar]
- Walsh D. M.; Selkoe D. J. A beta Oligomers - a decade of discovery. J. Neurochem. 2007, 101, 1172–1184. 10.1111/j.1471-4159.2006.04426.x. [DOI] [PubMed] [Google Scholar]
- Haass C.; Selkoe D. J. Soluble protein oligomers in neurodegeneration: lessons from the Alzheimer’s amyloid beta-peptide. Nat. Rev. Mol. Cell Biol. 2007, 8, 101–112. 10.1038/nrm2101. [DOI] [PubMed] [Google Scholar]
- Eiblmaier M.; Andrews R.; Laforest R.; Rogers B. E.; Anderson C. J. Nuclear uptake and dosimetry of Cu-64-labeled chelator-somatostatin conjugates in an SSTr2-transfected human tumor cell line. J. Nucl. Med. 2007, 48, 1390–1396. 10.2967/jnumed.107.039990. [DOI] [PubMed] [Google Scholar]
- Braymer J. J.; DeToma A. S.; Choi J.-S.; Ko K. S.; Lim M. H. Recent Development of Bifunctional Small Molecules to Study Metal-Amyloid-β Species in Alzheimer’s Disease. Int. J. Alzheimer's Dis. 2011, 2011, 623051. 10.4061/2011/623051. [DOI] [PMC free article] [PubMed] [Google Scholar]
- Choi J.-S.; Braymer J. J.; Nanga R. P. R.; Ramamoorthy A.; Lim M. H. Design of small molecules that target metal-Aβ species and regulate metal-induced Aβ aggregation and neurotoxicity. Proc. Natl. Acad. Sci. U. S. A. 2010, 107, 21990–21995. 10.1073/pnas.1006091107. [DOI] [PMC free article] [PubMed] [Google Scholar]
Associated Data
This section collects any data citations, data availability statements, or supplementary materials included in this article.