Significance
The thermal properties of crystalline solids follow universal laws that are explained by theories based on phonons. Amorphous solids are also characterized by universal laws that are, however, anomalous with respect to their crystalline counterparts. These anomalies begin to emerge at very low temperatures, suggesting that the vibrational properties of amorphous solids differ from phonons, even in the continuum limit. In this work, we reveal that phonons coexist with soft localized modes in the continuum limit of amorphous solids. Importantly, we discover that the phonons follow the Debye law, whereas the soft localized modes follow another universal non-Debye law. Our findings provide a firm theoretical basis for explaining the thermal anomalies of amorphous solids.
Keywords: amorphous solids, continuum limit, phonons, soft localized modes, non-Debye law
Abstract
The low-frequency vibrational and low-temperature thermal properties of amorphous solids are markedly different from those of crystalline solids. This situation is counterintuitive because all solid materials are expected to behave as a homogeneous elastic body in the continuum limit, in which vibrational modes are phonons that follow the Debye law. A number of phenomenological explanations for this situation have been proposed, which assume elastic heterogeneities, soft localized vibrations, and so on. Microscopic mean-field theories have recently been developed to predict the universal non-Debye scaling law. Considering these theoretical arguments, it is absolutely necessary to directly observe the nature of the low-frequency vibrations of amorphous solids and determine the laws that such vibrations obey. Herein, we perform an extremely large-scale vibrational mode analysis of a model amorphous solid. We find that the scaling law predicted by the mean-field theory is violated at low frequency, and in the continuum limit, the vibrational modes converge to a mixture of phonon modes that follow the Debye law and soft localized modes that follow another universal non-Debye scaling law.
The low-frequency vibrational and low-temperature thermal properties of amorphous solids have been a long-standing mystery in condensed matter physics. Crystalline solids follow universal laws, which are explained in terms of phonons (1, 2). Debye theory and phonon-gas theory predict that the vibrational density of states (vDOS) follows , the heat capacity follows , and the thermal conductivity follows in 3D systems, which indeed agree with experimental results ( is frequency, and is temperature). Similarly, amorphous solids are characterized by universal laws; however, these laws are anomalous with respect to those of crystalline solids (3). At K, the heat capacity of amorphous solids becomes larger than the value for crystalline solids (4), which directly reflects the excess vibrational modes around THz (5), often referred to as the boson peak (BP). At K, the thermal conductivity increases as rather than as (4), indicating that the vibrational modes are not phonons even at very low frequency THz (one order of magnitude lower than ). These behaviors are highly counterintuitive because any solid material, not only crystalline but also amorphous, is expected to behave as a homogeneous elastic medium in the continuum limit, and its vibrational modes are expected to converge to phonons (6–9).
A number of theoretical explanations for these anomalies have been proposed, and these explanations substantially differ. One approach (10–15) assumes that an inhomogeneity in the mechanical response at the nanoscale (16–18) plays the central role. In this approach, the heterogeneous elasticity equation is solved by using the effective medium technique to predict the BP and anomalous acoustic excitations (10, 11).
Another approach is the so-called soft potential model (19–24), which is an extension of the famous tunneling two-level systems model (25). This theory assumes soft localized vibrations to explain the anomalous thermal conductivity and the emergence of the BP. Soft localized vibrations have been numerically observed in a wide variety of model amorphous solids (26–31) and in the Heisenberg spin glass (32). Interestingly, these localized modes are also argued to affect the dynamics of supercooled liquids (33) and the yielding of glasses (34–36).
Recently, a quite different scenario has been emerging. This scenario is based on studies of the simplest model of amorphous solids (37), which is randomly jammed particles at zero temperature interacting through the pairwise potential,
| [1] |
where is the Heaviside step function and is the diameter of the particles. As the packing pressure is lowered, the particles lose their contacts at zero pressure , which is called the (un)jamming transition (37).
Importantly, the mean-field theory analysis of this model is now considerably advancing, thereby providing a new way to understand the anomalies of amorphous solids (38–48). Previous theoretical (38, 39) and numerical (49, 50) works have clearly established that the vDOS of this model exhibits a characteristic plateau at , where is the onset frequency of this plateau. The relevant region for the low-frequency anomalies of amorphous solids is located below this plateau, . First, the effective medium theory assuming marginal stability (i.e., that the system is close to the elastic instability) predicts the characteristic behavior of the vDOS at (41, 44). This prediction differs from the prediction of Debye theory because the prefactor is considerably larger than the Debye level . Thus, this prediction provides a new explanation of the BP in terms of marginal stability (41, 44). Second, the model is analyzed by using replica theory (40, 42, 45–48). This theory becomes exact in infinite dimensions (45); thus, it can be a firm starting point for considering the problem. Replica theory predicts that the transition from a normal glass to a marginally stable glass occurs at a finite pressure , which is called the Gardner transition (48). Near the Gardner transition, replica theory predicts non-Debye scaling of the vDOS at (47), which perfectly coincides with the prediction of the effective medium theory. Remarkably, in the marginally stable glass phase, the region of this scaling law extends down to , which means no Debye regime even in the continuum limit (the limit of ) (47). This non-Debye scaling law was recently shown to work at least near (51).
Considering these different theoretical arguments, it is absolutely necessary to numerically observe the nature of the low-frequency vibrations of amorphous solids and determine the laws that such vibrations obey. This task is not trivial because the lower is the frequency that we require, the larger is the system that we need to simulate. Here, we perform a vibrational mode analysis of the model amorphous solid defined by Eq. 1, composed of up to millions of particles (), which enables us to access extremely low-frequency modes even far below . Then, we investigate the nature of the modes in detail by calculating several different parameters. Notably, we find that the non-Debye scaling is violated at low frequency, and in the continuum limit, the vibrational modes converge to a mixture of phonon modes that follow the Debye law and soft localized modes that follow another universal non-Debye scaling law, the scaling law, which was recently first observed in refs. 31 and 32 by suppressing the effects of phonons.
Results and Discussion
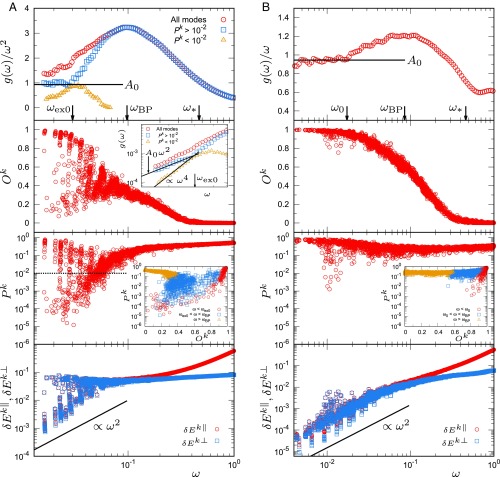
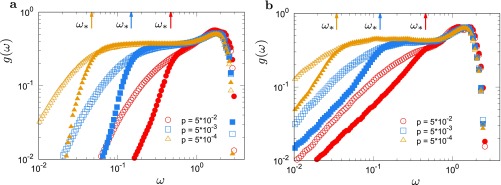
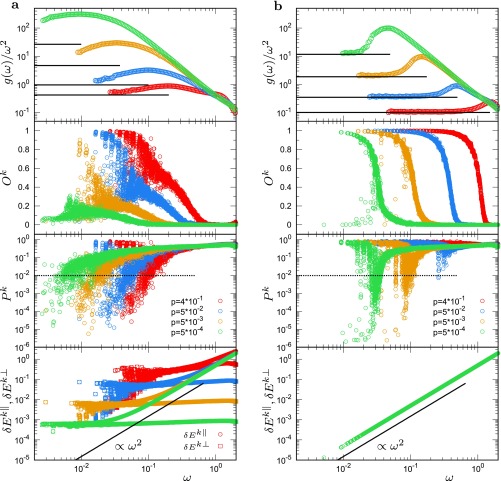
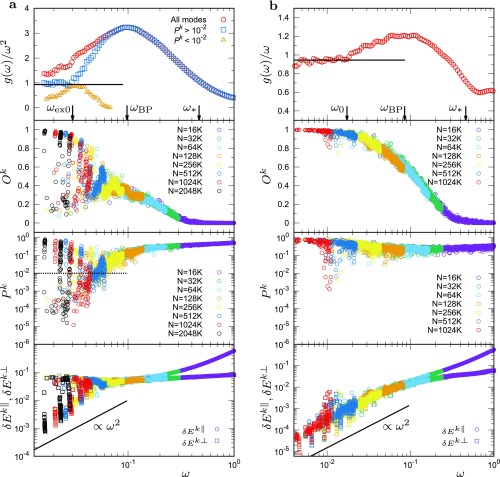
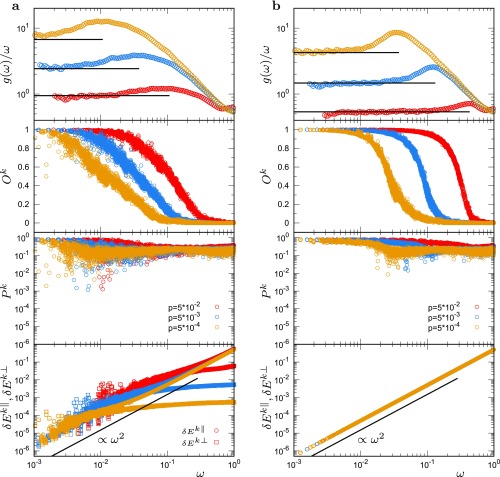
We first study the vibrational modes of the 3D model system at a pressure (density) above the unjamming transition (Materials and Methods). Fig. 1A (top image, red circles) presents the reduced vDOS at (packing fraction ) together with the Debye level . The value of is independently determined from the macroscopic mechanical moduli (Eq. 5). The reduced vDOS clearly exhibits a maximum (i.e., the BP). Because our data cover a wide range of frequencies, we can precisely identify the position of the BP . In Fig. 1, we place arrows that indicate and (the onset frequency of the plateau). Please refer to Fig. S1 for the plateau and its onset frequency in . The value of is approximately five times smaller than . As the frequency is further decreased below , decreases toward but does not reach in the frequency region that we studied. We will carefully discuss this result after characterizing the nature of the vibrational modes.
Fig. 1.
Vibrational modes in the model amorphous solid. Plots of and of the , , , and of each mode as functions of . (A) The 3D model system (). (B) The 2D model system (). The packing pressure is . Inset in the third image from the top in A and B presents the plot of vs. . For the 3D system in A, , the vDOS of extended modes () and , which is that of localized modes (), are also presented in A in the top image and Inset of the second image from the top.
Fig. S1.
The onset frequency of the plateau in vDOS. Plot of the vDOS against . (A) The 3D model system. (B) The 2D model system. The data of the original (stressed) system (open symbols) and of the unstressed system (filled symbols) are presented. The packing pressures are , , and . The onset frequency of the plateau is indicated by arrows.
To characterize the modes, we calculate three different parameters (Materials and Methods). First, the second image from the top in Fig. 1A presents the phonon order parameter , which is defined as the projection onto phonons (Eqs. 6 and 7), for each mode . measures the extent to which the mode is close to phonons, and it takes values from (phonon) to (nonphonon). At , is nearly zero, which confirms that these modes, called floppy modes (disordered extended modes) (38, 39), are largely different from phonons. As the frequency is decreased from to , smoothly increases to . This result indicates that the modes around the BP have a hybrid character of phonons and floppy modes. Remarkably, as the frequency is further decreased below , the modes are divided into two groups: increases with decreasing frequency in one group, whereas decreases in the other group. In the former group, converges to almost at (we provide the precise definition of later); namely, these modes are phonons. (The values of these phonon modes are close to but not exactly , which indicates that they are very weakly perturbed. Exact may be realized only in the limit of .) Second, the third image from the top in Fig. 1A plots the participation ratio , which evaluates the extent of spatial localization of mode (Eq. 9). takes values from 1 (extended over all particles equally) to (localized in one particle) (26–29). As shown in this image, also exhibits the division of modes into two groups: One approaches with decreasing , and the other approaches . The Inset shows that the nonphonon modes (small ) are localized (small ), whereas the phonon modes (large ) are extended (large ) at . Third, the bottom image of Fig. 1A presents the normal and tangential vibrational energies, (Eq. 10) (52). Again, the modes are split into two groups. The phonon modes follow the scaling behavior as in the case of crystalline solids, whereas the nonphonon localized modes are characterized by the -independent behavior of as in the case of the floppy modes at . These three coherent results demonstrate that the phonon modes and the nonphonon localized modes coexist at .
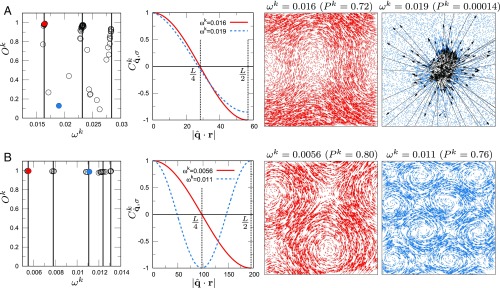
We now perform more stringent tests of the nature of these two types of modes. In Fig. 2A, in the leftmost image, the phonon order parameter is plotted against the frequency for each mode in the system of . Because this system is in a finite box, phonons should have discrete energy levels. We calculate these energy levels from the macroscopic elastic moduli and the linear dimension of the box (Materials and Methods), and we display them as vertical lines in the figure. Indeed, the phonon modes (modes with large ) sit on these levels. Conversely, the soft localized modes (modes with small ) are located in the gaps between the different levels. Furthermore, the two rightmost images in Fig. 2A show the eigen-vector field of the representative modes (highlighted as filled circles in the leftmost image), which demonstrates that the mode on the level has a phonon structure, whereas the other mode is localized. These results unambiguously establish the distinction between phonon modes and soft localized modes.
Fig. 2.
Vibrational modes in the low- regime. (A) of the 3D model system. (B) of the 2D model system. . The system sizes are N = 2,048,000, (3D) and N = 128,000, (2D). The leftmost image plots vs. for each mode (symbols) and the energy levels of phonons (vertical lines). The remaining images provide more detailed information on the two modes highlighted by red and blue filled circles in the left image. The second image from the left presents the spatial correlation function of the eigen-vector field , , along the transverse wave. The third and fourth images from the left visualize the eigen-vector fields of these two modes. For the 3D system in A, the vector fields are plotted at a fixed plane of a thickness of particle diameter, and the localized region is emphasized by black arrows.
We note that the soft localized modes present an extended vibrational character. This character is best observed in the spatial correlation function (Eq. 8), as shown in second image from the left of Fig. 2A. Here, we calculate the spatial correlation of the eigen-vector field along the transverse wave (Materials and Methods). This function exhibits a nice sinusoidal shape not only for the phonon mode, but also for the localized mode. This result indicates that the localized mode has disordered vibrational motions in the localized region; however, these motions are accompanied by extended phonon vibrations in the background. This feature is very similar to the quasilocalized modes in defect crystals, which are produced by hybridization of the extended phonon and the localized defect modes (2, 28). Consistent with this extended character, we observe that the participation ratios of the localized modes are independent of the system size at a fixed (26, 28). However, as the recent work (31) demonstrated, the localized modes lying below the lowest phonon mode exhibit -dependent participation ratios. We speculate that these localized modes are affected by phonon vibrations so weakly that only a tiny extended character is attached. Indeed, this is true for the localized modes (below the lowest phonon) in defect crystals (28).
A clear distinction between phonon modes and soft localized modes enables us to separately consider the vDOSs of these two types of modes. We define as the vDOS of modes with , and we define as the vDOS of modes with . Here, we set the threshold value as as in Fig. 1A (the third image from the top); however, the results are not sensitive to the choice of for (Fig. S2). We plot and in Fig. 1A (the top image and Inset in the second image from the top). As shown, converges exactly to the Debye behavior at a finite , which we define as . However, follows a different scaling law . Thus, we now conclude that the phonon modes that follow the Debye law and the soft localized modes that follow the other law coexist at . This result then suggests that the full vDOS eventually converges to the Debye vDOS in the limit of because decays faster than . Note that the scaling is the same law proposed in the soft-potential model (19–24). Moreover, it was recently reported that the law can be observed in the Heisenberg spin glass and in structural glasses if the effects of phonons are suppressed by introducing a random potential (32), tuning the system size to be sufficiently small (31), or focusing on the low-frequency regime below the lowest phonon mode (53). In the present work, we found that the vibrational modes are spontaneously divided into phonon modes and soft localized modes at and observed that these soft localized modes exactly follow the law.
Fig. S2.
Dependences of the vDOSs on the threshold value of participation ratio . (A) Plot of of the extended modes () against . (B) Plot of of the localized modes () against . The threshold value varies from to . In B, Inset, we plot . Although some quantitative differences are observed, the vDOSs are not sensitive to the choice of for .
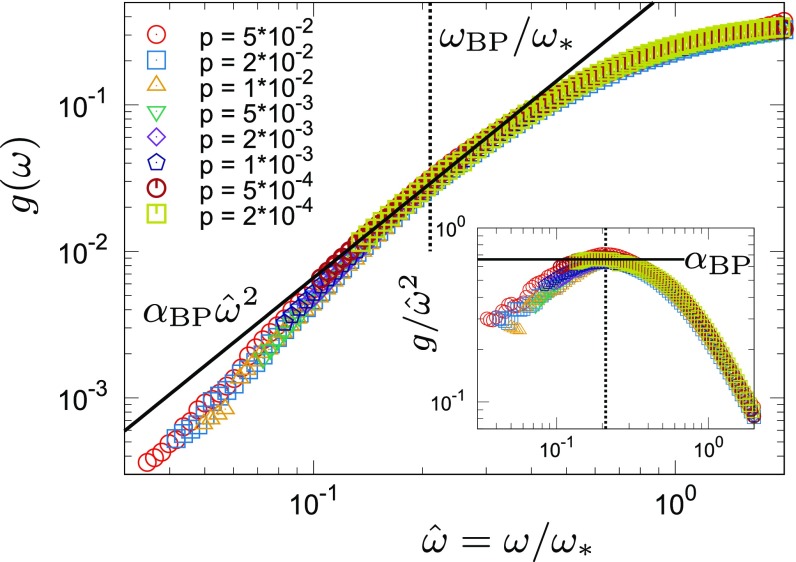
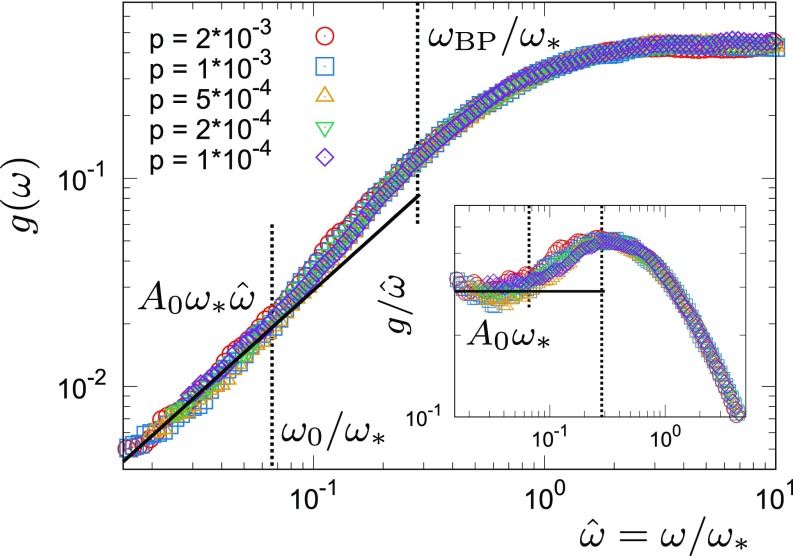
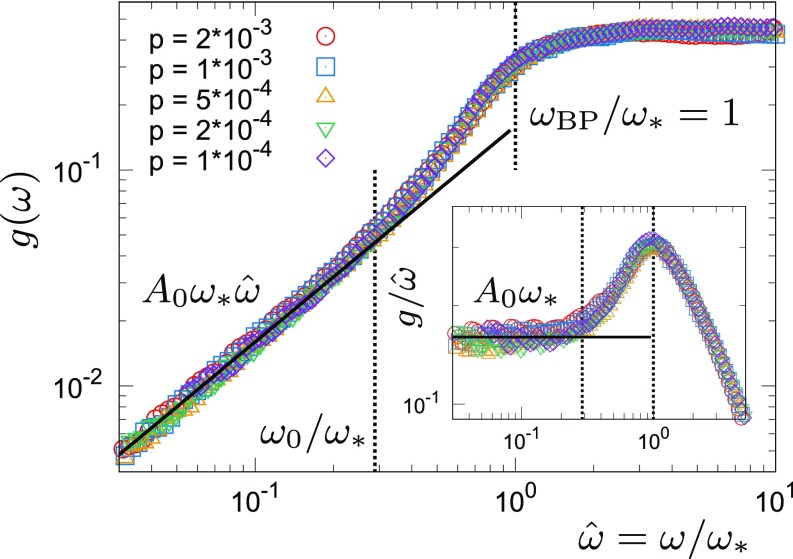
We repeat this analysis using different packing pressures (densities). We observe that the basic features are unchanged (Fig. S3A). Furthermore, we find that the vDOSs at different pressures can be summarized by the scaling laws. To illustrate this result, we determine for each pressure and introduce the scaled frequency . Here, we confirm the well-established property of (38, 39, 49, 50). Then, we plot and against at various pressures in Fig. 3. All of the data perfectly collapse around and above the BP. We emphasize that there are no adjustable parameters for this collapse. At , i.e., , exhibits a constant plateau (Fig. S1A). The BP is located at ; thus, at all pressures. The vDOS around the BP can be fitted to the non-Debye scaling with , as predicted by the mean-field theory (44, 47) and observed in simulations (51). However, the data systematically deviate from this scaling law around at all pressures. This result can be contrasted with the results of replica theory, which predicts that the present system has a marginally stable glass phase in some finite region of the density above the unjamming point (48), and the region of the non-Debye scaling law extends down to in this phase (47). Our result is more consistent with the results in refs. 44 and 54.
Fig. S3.
Vibrational modes in the 3D model system. Plots of and of the , , , and of each mode as functions of . (A) Original (stressed) system. (B) Unstressed system. The packing pressures are , , , and . In the top image, the horizontal lines show the Debye level . In the bottom image, the circles and squares present and , respectively. Note that of the unstressed system is invisible in B.
Fig. 3.
The vDOSs at different in the 3D model system. is plotted against the scaled frequency for several different . Inset is the same as the main image, but for the reduced vDOSs . Around , the vDOSs are collapsed onto the non-Debye scaling law with .
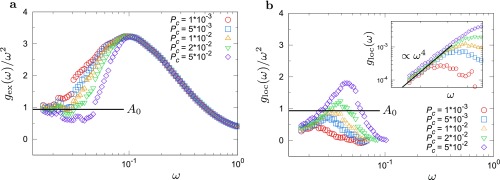
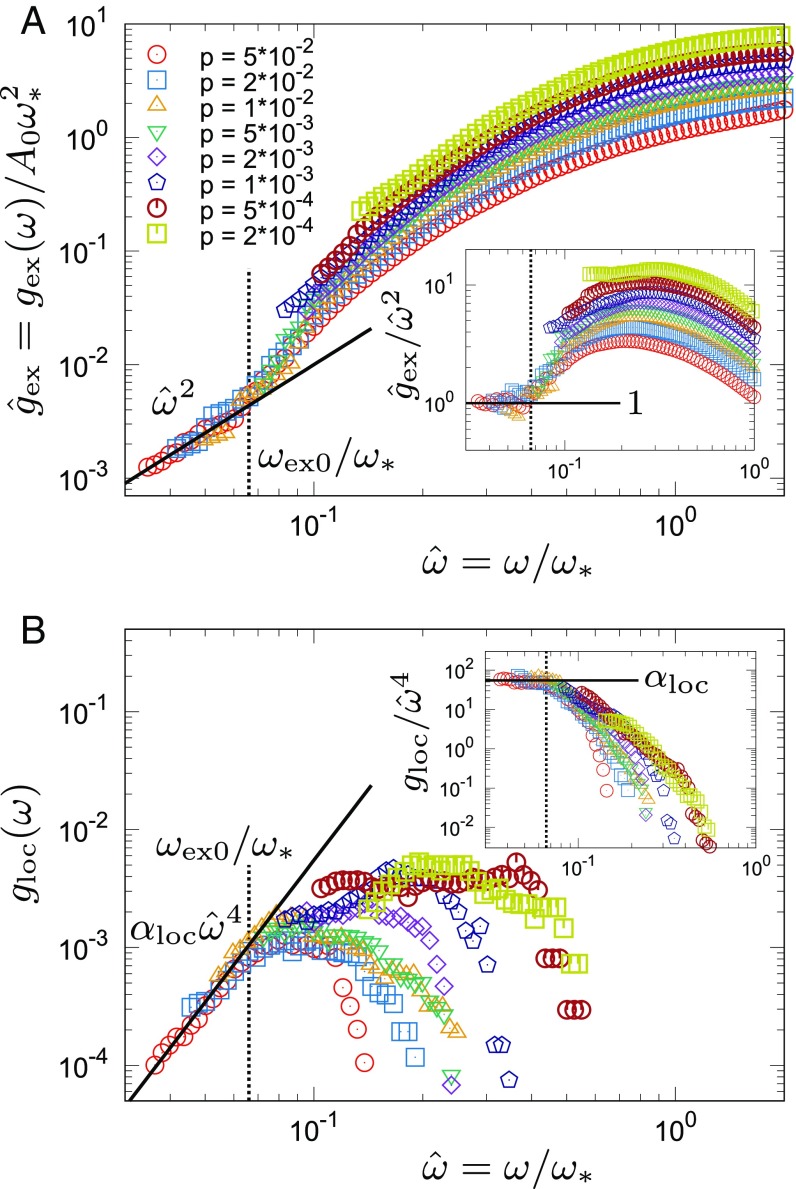
Rather, at lower frequency , we find that another scaling law works. In Fig. 4A, we plot against . We observe that the Debye level is related to as with . As decreases, all of the data at different pressures collapse and converge to , which is exactly the Debye behavior . This convergence occurs at ; thus, at all pressures. Next, we plot against in Fig. 4B. Remarkably, all of the data converge to another universal scaling law with . This convergence occurs at as in . These two results demonstrate that the full vDOS can be expressed as at .
Fig. 4.
The vDOSs of the extended modes and the soft localized modes in the 3D model system. (A) Plot of the scaled vDOSs of the extended modes (), , against the scaled frequency . (B) Plot of the vDOSs of the localized modes (), , against . Insets are the same as the main images, but for the reduced vDOSs in A and in B. Below , the vDOSs collapse onto and with .
Therefore, by collecting the results in all of the frequency regions, we can write the functional form of the vDOS that covers the continuum limit as follows:
| [2] |
with , , , , , and with . Strikingly, except for the phonon part , the vDOS takes the form of a universal function of the reduced frequency only. In other words, the nonphonon contribution to the vDOS can be expressed as , where for , for , and for . This result implies that all of the nonphonon vibrations, including the soft localized modes, are controlled by the physics of , namely, the isostaticity and the marginal stability. We note that the recent picture of soft potential model, considering the vibrational instability (22–24), predicts ; the exponent of is consistent with our result, but the coefficient is not. This theory can also predict the pressure dependence of that is, however, different from of the present system.
Based on the vDOS in Eq. 2, the heat capacity can be predicted within the harmonic approximation (1). At ( is the Boltzmann constant, and , where is Planck’s constant), consists of two terms: the Debye value and . This point was discussed in the soft potential model (20). Around , emerges from . Since is larger than , takes excess values over the Debye prediction. Finally, at , provides . Note that these predictions are within the harmonic description. Anharmonic effects provide additional contributions to the heat capacity; the two-level system provides the linear -dependent term through the quantum anharmonic effects (25, 55).
To further discuss the origin of the nonphonon behaviors, we perform a vibrational mode analysis of the “unstressed” system. The unstressed system is defined as the system in which the particle–particle contacts of the original system are replaced with relaxed springs (Materials and Methods). In the present model, the unstressed system is known to be far from the marginally stable state (39, 44, 54). Thus, by observing whether a mode disappears in the unstressed system, one can evaluate whether the mode originates from the marginal stability. We observe that the scaling region for is suppressed in the unstressed system (Fig. S5), which confirms that these modes originate from the marginal stability (44, 47). Furthermore, the soft localized modes are strongly quelled (Fig. S3B). [We observe that the unstressed system begins to exhibit soft localized modes when the system is brought close to the unjamming transition (elastic instability).] This result suggests that the soft localized modes also originate from the marginal stability, although they are not captured by the current mean-field framework.
Fig. S5.
The vDOSs at different in the 3D unstressed system. (A) Plot of the vDOSs against the scaled frequency for several different . (B) Plot of the scaled vDOSs against . Insets are the same as the main images, but for the reduced vDOSs in A and in B. Around , the vDOSs are collapsed onto the non-Debye scaling law with = 0.20.Below = 0.39 , the vDOSs are collapsed onto the Debye vDOS .
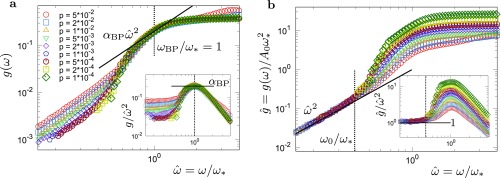
Finally, we focus on the vibrational modes of the 2D model system, where we encounter a surprisingly different situation. Fig. 1B shows that converges smoothly to the Debye vDOS at a finite frequency that we define as . Below , most of the modes are characterized by ; namely, these modes are phonons. This result is more evident in Fig. 2B for the system of ; all of the vibrational modes at sit on the energy levels of phonons, and they also have the spatial structures of phonons. Another interesting feature is that the full vDOSs at various pressures are expressed as a universal function of over the entire regime, as illustrated in Fig. 5. This result can be rationalized by observing that the Debye (phonon) vDOS is with ; thus, it also becomes a universal function of in 2D, as does the nonphonon contribution . Similar convergence to phonons and collapses of the vDOSs were reported for 2D Lennard–Jones systems in previous works (6, 56). The collapse also indicates that the BP amplitude scaled by the Debye level, (56), does not depend on the packing pressure in 2D. In contrast, in 3D, this quantity diverges as at the unjamming transition, as shown in Eq. 2 and in Fig. 4A (also see Eq. S3 and Figs. S7 and S8). However, note that some soft localized modes appear even below in 2D, although the number of these modes is so few that the vDOSs are dominated by phonon modes. The recent work (31) indicated that the law of localized modes can be observed even in 2D amorphous systems if the effects of phonons are suppressed.
Fig. 5.
The vDOSs at different in the 2D model system. is plotted against the scaled frequency for several different . Inset is the same as the main image, but for the reduced vDOSs . The full vDOSs are collapsed onto a universal function of the scaled frequency over the entire regime. At , converges to the Debye vDOS .
Fig. S7.
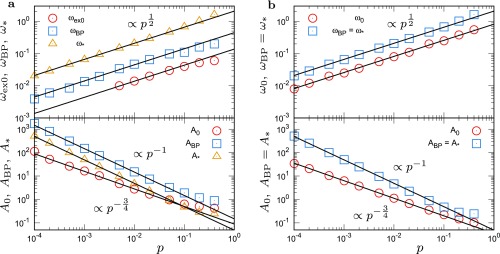
Dependence on of frequencies and amplitudes of the vDOS for the 3D model system. Plots of the characteristic frequencies, (), , and , and the corresponding amplitudes of , , , and A∗, as functions of . (A) Original (stressed) system. (B) Unstressed system. The lines indicate the power-law scalings with .
Fig. S8.
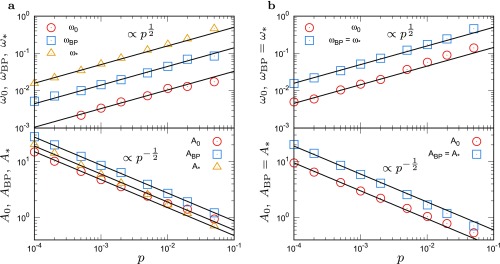
Dependence on of frequencies and amplitudes of the vDOS for the 2D model system. Plots of the characteristic frequencies, , , and , and the corresponding amplitudes of , , , and A∗, as functions of . (A) Original (stressed) system. (B) Unstressed system. The lines indicate the power-law scalings with .
In conclusion, we have used a large-scale numerical simulation to observe the continuum limit of the vibrational modes in a model amorphous solid. (In this work, we have studied an amorphous system of the harmonic potential defined by Eq. 1. However, we expect that our main results may persist in a variety of amorphous systems, e.g., the Lennard–Jones glasses, which requires further study.) In 3D, we have found that the vDOS follows the non-Debye scaling only around and above the BP, and below the BP, the vibrational modes are divided into two groups: The modes in one group converge to the phonon modes that follow the Debye law , and the modes in the other group converge to the soft localized modes that follow another universal non-Debye scaling . Strikingly, all of the nonphonon contributions to the vDOSs at different pressures can be expressed as a universal function of the reduced frequency . In contrast, completely different behaviors are observed in 2D: Vibrational modes smoothly converge to phonons without the appearance of the group of soft localized modes.
Our results, on the one hand, provide a direct verification of the basic assumption of the soft potential model (19–25). We showed the coexistence of phonon modes and soft localized modes, which is the central idea for explaining the low- anomalies of thermal conduction and the formation of BP in this phenomenological model. However, more quantitative predictions of this theory, such as the pressure dependence of and the coefficient of , are inconsistent with our results. [The pressure dependence of of the Lennard–Jones glasses seems to be consistent with the prediction of soft potential model (57), which needs further confirmation.] On the other hand, the violation of the non-Debye scaling at the BP, the emergence of soft localized modes with another non-Debye scaling, and the crucial difference between 2D and 3D appear to be beyond the reach of the current mean-field theory. However, the fact that the nonphonon contributions to the vDOS are expressed as a universal function of suggests that these features are linked to the isostaticity and the marginal stability, which are captured by the mean-field theory (38–48).
Materials and Methods
System Description.
We study 3D () and 2D () model amorphous solids, which are composed of randomly jammed particles (37). Particles interact via a finite-range, purely repulsive, harmonic potential [1], where is the distance between the two particles. The 3D system is monodisperse with a diameter of , whereas the 2D system is a - binary mixture with a size ratio of (the diameter of the smaller species is denoted by ). The particle mass is . Length, mass, and time are measured in units of , , and , respectively. To access low-frequency vibrational modes, we consider several different system sizes (number of particles), ranging from relatively small, N = 16,000, to extremely large, N = 2,048,000. We always remove the rattler particles that have less than contacting particles.
Mechanically stable amorphous packings are generated for a range of packing pressures from to . We first randomly place particles in a cubic (3D) or square (2D) box with periodic boundary conditions in all directions. The system is then quenched to a minimum energy state. Finally, the packing fraction is adjusted by compressive deformation (CO) until a target pressure is reached. We also study the shear-stabilized (SS) system (58) by minimizing the energy with respect to the shear degrees of freedom. No differences between the CO and SS systems have been confirmed for our systems of . In this work, we present the results obtained from the CO system.
In the packings obtained by using the above protocol, the interparticle forces are always positive . For this reason, we refer to this original state as the stressed system. In addition to the stressed system, we also study the unstressed system, where we retain the stiffness but drop the force in the analysis. Since the positive forces make the system mechanically unstable, dropping the forces makes the original stressed system more stable (39, 44, 54).
Vibrational Mode Analysis.
We perform the standard vibrational mode analysis (1, 2), where we solve the eigen-value problem of the dynamical matrix ( matrix) to obtain the eigen value and the eigen vector for the modes ( zero-, translational modes are removed). Here, the eigen vectors are orthonormalized as , where is the Kronecker delta function.
From the dataset of eigen frequencies, (), we calculate the vDOS as
| [3] |
where is the Dirac delta function.
In the present work, we analyze several different system sizes, ranging from N = 16,000 to N = 2,048,000. We first calculate all of the vibrational modes in the system of N = 16,000. We then calculate only the low-frequency modes in the larger systems of N > 16,000. Finally, the modes obtained from different system sizes are combined as a function of the frequency . We find that the results from different system sizes smoothly connect with each other, which provides the mode information in the very low-frequency regime (Fig. S9). The vDOS is calculated from these datasets, and the results of these different system sizes are presented together in the figures.
Fig. S9.
Vibrational modes of different system sizes . Plots of and of the , , , and of each mode as functions of . (A) The 3D model system (). (B) The 2D model system (). The packing pressure is . Data are the same as those presented in Fig. 1. Here, we plot values of different system sizes using different symbols. Data from different smoothly connect with each other in the entire regime.
The present system exhibits a characteristic plateau in at , where is defined as the onset frequency of this plateau (Fig. S1) (49, 50). Practically, we determine the value of as the BP position of the unstressed system (39, 52).
Phonon and Debye vDOS.
In an isotropic elastic medium, phonons are described as (1, 2),
| [4] |
is the wave vector, and . Due to the periodic boundary condition of the finite dimension , is discretized as for 3D and as for 2D ( are integers). The value of denotes one longitudinal () and two transverse () modes for 3D, and it denotes one longitudinal () and one transverse () modes for 2D. is a unit vector that represents the direction of polarization, and it is determined as (longitudinal) and (transverse). Note that the vectors are orthonormal as . Here, strictly speaking, for and for , which becomes exactly as (the thermodynamic limit).
In the low- limit, the continuum mechanics determine the dispersion relation as . is the phonon speed; and for 3D, and and for 2D. Here, is the mass density, and and are the bulk and shear elastic moduli, respectively. In this study, we calculate and using the harmonic formulation (52). Debye theory counts the number of phonons to yield the vDOS as
| [5] |
where is the Debye level and is the Debye frequency; for 3D, and for 2D, where is the number density. Close to the unjamming transition, (37, 49, 50, 52), and (also see Figs. S7 and S8).
Phonon Order Parameter.
We evaluate the extent to which the mode is close to phonons by introducing the phonon order parameter as follows. The eigen vector can be expanded in a series of phonons (Fourier series expansion) as . Then, we can calculate the projection onto one particular phonon as
| [6] |
Here, note that since .
If the mode is a phonon, then is described as the summation of a finite number of large overlapped phonons; . Here, we define “large overlapped” as , i.e., overlapped by the extent of more than modes. Considering the above, we define the phonon order parameter as
| [7] |
for a phonon, whereas for a mode that is considerably different from phonons. In the present study, was used; however, we confirmed that our results and conclusions do not depend on the choice of the value of .
In addition, we calculate the (normalized) spatial correlation function of projected to as
| [8] |
where denotes the average over all pairs of particles . If the vibrational mode is a phonon, then exhibits a sinusoidal curve.
Participation Ratio.
We measure the extent of vibrational localization using the participation ratio (26–29),
| [9] |
As extreme cases, for an ideal mode where all of the particles vibrate equally, and for a mode that involves only one particle. In the present study, modes with that involve less than of the total particles are assigned to the localized modes. However, the results are not sensitive to the choice of for (Fig. S2).
Vibrational Energy.
Finally, we calculate the vibrational energy . The vector represents the vibrational motion at the contact of particles , which can be decomposed into the normal and the tangential vibrations with respect to the bond vector (52); , and . Accordingly, the vibrational energy can be decomposed as
| [10] |
For the present repulsive system, is always positive. If mode is a phonon, then and are both proportional to . For the floppy mode, the tangential exhibits -independent behavior, (52).
SI Text
In the following, we report supporting data, including the onset frequency of the plateau in vDOS (Fig. S1), the dependences of the vDOSs on the threshold value (Fig. S2), vibrational modes at different (Figs. S3 and S4), the vDOSs in the unstressed system (Figs. S5 and S6), explicit plots of frequencies and amplitudes in the vDOS as functions of (Figs. S7 and S8), and vibrational modes of different system sizes (Fig. S9).
Fig. S4.
Vibrational modes in the 2D model system. Plots of and of the , , , and of each mode as functions of . (A) Original (stressed) system. (B) Unstressed system. The packing pressures are , , and . In the top image, the horizontal lines show the Debye level . In the bottom image, the circles and squares present and , respectively. Note that of the unstressed system is invisible in B.
Fig. S6.
The vDOSs at different in the 2D unstressed system. is plotted against the scaled frequency for several different . Inset is the same as the main image, but for the reduced vDOSs . The vDOSs are collapsed onto a universal function of the scaled frequency over the entire regime. At = 0.29, converges to the Debye vDOS .
Here, we summarize the power-law scalings with of the characteristic frequencies, (), , and , and the corresponding amplitudes of , , , , which are explicitly plotted in Figs. S7 and S8:
| [S1] |
| [S2] |
Particularly, we note that the BP amplitude scaled by the Debye level, , behaves differently between 3D and 2D:
| [S3] |
Supplementary Material
Acknowledgments
We thank H. Ikeda, Y. Jin, L. E. Silbert, P. Charbonneau, F. Zamponi, L. Berthier, E. Lerner, E. Bouchbinder, and K. Miyazaki for useful discussions and suggestions. This work was supported by Japan Society for the Promotion of Science Grant-in-Aid for Young Scientists B 17K14369, Grant-in-Aid for Young Scientists A 17H04853, and Grant-in-Aid for Scientific Research B 16H04034. The numerical calculations were partly performed on SGI Altix ICE XA at the Institute for Solid State Physics, The University of Tokyo.
Footnotes
The authors declare no conflict of interest.
This article is a PNAS Direct Submission.
This article contains supporting information online at www.pnas.org/lookup/suppl/doi:10.1073/pnas.1709015114/-/DCSupplemental.
References
- 1.Kittel C. Introduction to Solid State Physics. 7th Ed John Wiley and Sons; New York: 1996. [Google Scholar]
- 2.Leibfried G, Breuer N. 1978. Point Defects in Metals I, Introduction to the Theory, Springer Tracts in Modern Physics (Springer, Berlin), Vol 81.
- 3.Phillips WA. Amorphous Solids: Low Temperature Properties. 3rd Ed Springer; Berlin: 1981. [Google Scholar]
- 4.Zeller RC, Pohl RO. Thermal conductivity and specific heat of noncrystalline solids. Phys Rev B. 1971;4:2029–2041. [Google Scholar]
- 5.Buchenau U, Nücker N, Dianoux AJ. Neutron scattering study of the low-frequency vibrations in vitreous silica. Phys Rev Lett. 1984;53:2316–2319. [Google Scholar]
- 6.Tanguy A, Wittmer JP, Leonforte F, Barrat JL. Continuum limit of amorphous elastic bodies: A finite-size study of low-frequency harmonic vibrations. Phys Rev B. 2002;66:174205. [Google Scholar]
- 7.Leonforte F, Boissière R, Tanguy A, Wittmer JP, Barrat JL. Continuum limit of amorphous elastic bodies. iii. Three-dimensional systems. Phys Rev B. 2005;72:224206. [Google Scholar]
- 8.Monaco G, Mossa S. Anomalous properties of the acoustic excitations in glasses on the mesoscopic length scale. Proc Natl Acad Sci USA. 2009;106:16907–16912. doi: 10.1073/pnas.0903922106. [DOI] [PMC free article] [PubMed] [Google Scholar]
- 9.Shiba H, Yamada Y, Kawasaki T, Kim K. Unveiling dimensionality dependence of glassy dynamics: 2D infinite fluctuation eclipses inherent structural relaxation. Phys Rev Lett. 2016;117:245701. doi: 10.1103/PhysRevLett.117.245701. [DOI] [PubMed] [Google Scholar]
- 10.Schirmacher W, Ruocco G, Scopigno T. Acoustic attenuation in glasses and its relation with the boson peak. Phys Rev Lett. 2007;98:025501. doi: 10.1103/PhysRevLett.98.025501. [DOI] [PubMed] [Google Scholar]
- 11.Marruzzo A, Schirmacher W, Fratalocchi A, Ruocco G. Heterogeneous shear elasticity of glasses: The origin of the boson peak. Sci Rep. 2013;3:1407. doi: 10.1038/srep01407. [DOI] [PMC free article] [PubMed] [Google Scholar]
- 12.Mizuno H, Mossa S, Barrat JL. Elastic heterogeneity, vibrational states, and thermal conductivity across an amorphisation transition. Europhys Lett. 2013;104:56001. [Google Scholar]
- 13.Mizuno H, Mossa S, Barrat JL. Acoustic excitations and elastic heterogeneities in disordered solids. Proc Natl Acad Sci USA. 2014;111:11949–11954. doi: 10.1073/pnas.1409490111. [DOI] [PMC free article] [PubMed] [Google Scholar]
- 14.Gelin S, Tanaka H, Lemaitre A. Anomalous phonon scattering and elastic correlations in amorphous solids. Nat Mater. 2016;15:1177–1181. doi: 10.1038/nmat4736. [DOI] [PubMed] [Google Scholar]
- 15.Zhang L, et al. Experimental studies of vibrational modes in a two-dimensional amorphous solid. Nat Commun. 2017;8:67. doi: 10.1038/s41467-017-00106-5. [DOI] [PMC free article] [PubMed] [Google Scholar]
- 16.Yoshimoto K, Jain TS, VanWorkum K, Nealey PF, dePablo JJ. Mechanical heterogeneities in model polymer glasses at small length scales. Phys Rev Lett. 2004;93:175501. doi: 10.1103/PhysRevLett.93.175501. [DOI] [PubMed] [Google Scholar]
- 17.Tsamados M, Tanguy A, Goldenberg C, Barrat JL. Local elasticity map and plasticity in a model Lennard-Jones glass. Phys Rev E. 2009;80:026112. doi: 10.1103/PhysRevE.80.026112. [DOI] [PubMed] [Google Scholar]
- 18.Mizuno H, Mossa S, Barrat JL. Measuring spatial distribution of the local elastic modulus in glasses. Phys Rev E. 2013;87:042306. doi: 10.1103/PhysRevE.87.042306. [DOI] [PubMed] [Google Scholar]
- 19.Karpov VG, Klinger MI, Ignat’ev FN. Theory of the low-temperature anomalies in the thermal properties of amorphous structures. Sov Phys JETP. 1983;57:439–448. [Google Scholar]
- 20.Buchenau U, Galperin YM, Gurevich VL, Schober HR. Anharmonic potentials and vibrational localization in glasses. Phys Rev B. 1991;43:5039–5045. doi: 10.1103/physrevb.43.5039. [DOI] [PubMed] [Google Scholar]
- 21.Buchenau U, et al. Interaction of soft modes and sound waves in glasses. Phys Rev B. 1992;46:2798–2808. doi: 10.1103/physrevb.46.2798. [DOI] [PubMed] [Google Scholar]
- 22.Gurevich VL, Parshin DA, Schober HR. Anharmonicity, vibrational instability, and the boson peak in glasses. Phys Rev B. 2003;67:094203. [Google Scholar]
- 23.Gurevich VL, Parshin DA, Schober HR. Pressure dependence of the boson peak in glasses. Phys Rev B. 2005;71:014209. [Google Scholar]
- 24.Parshin DA, Schober HR, Gurevich VL. Vibrational instability, two-level systems, and the boson peak in glasses. Phys Rev B. 2007;76:064206. [Google Scholar]
- 25.Anderson PW, Halperin BI, Varma CM. Anomalous low-temperature thermal properties of glasses and spin glasses. Philosophical Mag. 1972;25(1):1–9. [Google Scholar]
- 26.Mazzacurati V, Ruocco G, Sampoli M. Low-frequency atomic motion in a model glass. Europhys Lett. 1996;34:681–686. [Google Scholar]
- 27.Taraskin SN, Elliott SR. Anharmonicity and localization of atomic vibrations in vitreous silica. Phys Rev B. 1999;59:8572–8585. [Google Scholar]
- 28.Schober HR, Ruocco G. Size effects and quasilocalized vibrations. Philos Mag. 2004;84:1361–1372. [Google Scholar]
- 29.Xu N, Vitelli V, Liu AJ, Nagel SR. Anharmonic and quasi-localized vibrations in jammed solids-modes for mechanical failure. Europhys Lett. 2010;90:56001. [Google Scholar]
- 30.Beltukov YM, Fusco C, Parshin DA, Tanguy A. Boson peak and Ioffe-Regel criterion in amorphous siliconlike materials: The effect of bond directionality. Phys Rev E. 2016;93:023006. doi: 10.1103/PhysRevE.93.023006. [DOI] [PubMed] [Google Scholar]
- 31.Lerner E, Düring G, Bouchbinder E. Statistics and properties of low-frequency vibrational modes in structural glasses. Phys Rev Lett. 2016;117:035501. doi: 10.1103/PhysRevLett.117.035501. [DOI] [PubMed] [Google Scholar]
- 32.Baity-Jesi M, Martín-Mayor V, Parisi G, Perez-Gaviro S. Soft modes, localization, and two-level systems in spin glasses. Phys Rev Lett. 2015;115:267205. doi: 10.1103/PhysRevLett.115.267205. [DOI] [PubMed] [Google Scholar]
- 33.Widmer-Cooper A, Perry H, Harrowell P, Reichman DR. Irreversible reorganization in a supercooled liquid originates from localized soft modes. Nat Phys. 2008;4:711–715. [Google Scholar]
- 34.Maloney CE, Lemaître A. Amorphous systems in athermal, quasistatic shear. Phys Rev E. 2006;74:016118. doi: 10.1103/PhysRevE.74.016118. [DOI] [PubMed] [Google Scholar]
- 35.Manning ML, Liu AJ. Vibrational modes identify soft spots in a sheared disordered packing. Phys Rev Lett. 2011;107:108302. doi: 10.1103/PhysRevLett.107.108302. [DOI] [PubMed] [Google Scholar]
- 36.Zylberg J, Lerner E, Bar-Sinai Y, Bouchbinder E. Local thermal energy as a structural indicator in glasses. Proc Natl Acad Sci USA. 2017;114:7289–7294. doi: 10.1073/pnas.1704403114. [DOI] [PMC free article] [PubMed] [Google Scholar]
- 37.O’Hern CS, Silbert LE, Liu AJ, Nagel SR. Jamming at zero temperature and zero applied stress: The epitome of disorder. Phys Rev E. 2003;68:011306. doi: 10.1103/PhysRevE.68.011306. [DOI] [PubMed] [Google Scholar]
- 38.Wyart M, Nagel SR, Witten TA. Geometric origin of excess low-frequency vibrational modes in weakly connected amorphous solids. Europhys Lett. 2005;72:486–492. [Google Scholar]
- 39.Wyart M, Silbert LE, Nagel SR, Witten TA. Effects of compression on the vibrational modes of marginally jammed solids. Phys Rev E. 2005;72:051306. doi: 10.1103/PhysRevE.72.051306. [DOI] [PubMed] [Google Scholar]
- 40.Parisi G, Zamponi F. Mean-field theory of hard sphere glasses and jamming. Rev Mod Phys. 2010;82:789–845. [Google Scholar]
- 41.Wyart M. Scaling of phononic transport with connectivity in amorphous solids. Europhys Lett. 2010;89:64001. [Google Scholar]
- 42.Berthier L, Jacquin H, Zamponi F. Microscopic theory of the jamming transition of harmonic spheres. Phys Rev E. 2011;84:051103. doi: 10.1103/PhysRevE.84.051103. [DOI] [PubMed] [Google Scholar]
- 43.Wyart M. Marginal stability constrains force and pair distributions at random close packing. Phys Rev Lett. 2012;109:125502. doi: 10.1103/PhysRevLett.109.125502. [DOI] [PubMed] [Google Scholar]
- 44.DeGiuli E, Laversanne-Finot A, During G, Lerner E, Wyart M. Effects of coordination and pressure on sound attenuation, boson peak and elasticity in amorphous solids. Soft Matter. 2014;10:5628–5644. doi: 10.1039/c4sm00561a. [DOI] [PubMed] [Google Scholar]
- 45.Charbonneau P, Kurchan J, Parisi G, Urbani P, Zamponi F. Exact theory of dense amorphous hard spheres in high dimension. iii. The full replica symmetry breaking solution. J Stat Mech Theor Exp. 2014;2014:P10009. [Google Scholar]
- 46.Charbonneau P, Kurchan J, Parisi G, Urbani P, Zamponi F. Fractal free energy landscapes in structural glasses. Nat Commun. 2014;5:3725. doi: 10.1038/ncomms4725. [DOI] [PubMed] [Google Scholar]
- 47.Franz S, Parisi G, Urbani P, Zamponi F. Universal spectrum of normal modes in low-temperature glasses. Proc Natl Acad Sci USA. 2015;112:14539–14544. doi: 10.1073/pnas.1511134112. [DOI] [PMC free article] [PubMed] [Google Scholar]
- 48.Biroli G, Urbani P. Breakdown of elasticity in amorphous solids. Nat Phys. 2016;12:1130–1133. [Google Scholar]
- 49.Silbert LE, Liu AJ, Nagel SR. Vibrations and diverging length scales near the unjamming transition. Phys Rev Lett. 2005;95:098301. doi: 10.1103/PhysRevLett.95.098301. [DOI] [PubMed] [Google Scholar]
- 50.Silbert LE, Liu AJ, Nagel SR. Normal modes in model jammed systems in three dimensions. Phys Rev E. 2009;79:021308. doi: 10.1103/PhysRevE.79.021308. [DOI] [PubMed] [Google Scholar]
- 51.Charbonneau P, Corwin EI, Parisi G, Poncet A, Zamponi F. Universal non-debye scaling in the density of states of amorphous solids. Phys Rev Lett. 2016;117:045503. doi: 10.1103/PhysRevLett.117.045503. [DOI] [PubMed] [Google Scholar]
- 52.Mizuno H, Saitoh K, Silbert LE. Elastic moduli and vibrational modes in jammed particulate packings. Phys Rev E. 2016;93:062905. doi: 10.1103/PhysRevE.93.062905. [DOI] [PubMed] [Google Scholar]
- 53.Gartner L, Lerner E. Nonlinear modes disentangle glassy and goldstone modes in structural glasses. SciPost Phys. 2016;1:016. [Google Scholar]
- 54.Lerner E, DeGiuli E, During G, Wyart M. Breakdown of continuum elasticity in amorphous solids. Soft Matter. 2014;10:5085–5092. doi: 10.1039/c4sm00311j. [DOI] [PubMed] [Google Scholar]
- 55.Pérez-Castañeda T, Rodríguez-Tinoco C, Rodríguez-Viejo J, Ramos MA. Suppression of tunneling two-level systems in ultrastable glasses of indomethacin. Proc Natl Acad Sci USA. 2014;111:11275–11280. doi: 10.1073/pnas.1405545111. [DOI] [PMC free article] [PubMed] [Google Scholar]
- 56.Shintani H, Tanaka H. Universal link between the boson peak and transverse phonons in glass. Nat Mater. 2008;7:870–877. doi: 10.1038/nmat2293. [DOI] [PubMed] [Google Scholar]
- 57.Leonforte F. Vibrational states and disorder in continuously compressed model glasses. J Non-Cryst Solids. 2011;357:552–558. [Google Scholar]
- 58.Dagois-Bohy S, Tighe BP, Simon J, Henkes S, van Hecke M. Soft-sphere packings at finite pressure but unstable to shear. Phys Rev Lett. 2012;109:095703. doi: 10.1103/PhysRevLett.109.095703. [DOI] [PubMed] [Google Scholar]


