Abstract
The field of medical image quality has relied on the assumption that metrics of image quality for simple visual detection tasks are a reliable proxy for the more clinically realistic visual search tasks. Rank order of signal detectability across conditions often generalizes from detection to search tasks. Here, we argue that search in 3D images represents a paradigm shift in medical imaging: radiologists typically cannot exhaustively scrutinize all regions of interest with the high acuity fovea requiring detection of signals with extra-foveal areas (visual periphery) of the human retina. We hypothesize that extra-foveal processing can alter the detectability of certain types of signals in medical images with important implications for search in 3D medical images. We compare visual search of two different types of signals in 2D vs. 3D images. We show that a small microcalcification-like signal is more highly detectable than a larger mass-like signal in 2D search, but its detectability largely decreases (relative to the larger signal) in the 3D search task. Utilizing measurements of observer detectability as a function retinal eccentricity and observer eye fixations we can predict the pattern of results in the 2D and 3D search studies. Our findings: 1) suggest that observer performance findings with 2D search might not always generalize to 3D search; 2) motivate the development of a new family of model observers that take into account the inhomogeneous visual processing across the retina (foveated model observers).
Keywords: 3D search, peripheral processing, visual field, foveated model observers
1. INTRODUCTION
Model observers are mathematical formulations that can be applied to images to predict human observer performance in clinically relevant visual tasks. The field has progressed from evaluation of models with simple filtered noise backgrounds to more anatomically realistic backgrounds, signals and tasks [1]–[4] to try to capture some of the complexities of the clinical task. Model observers have been extended to include signal variability [5], different types of internal noise [6], [7], and components of the human visual system [8].
One strong assumption has been that performance measures for simple visual detection tasks with a few known locations are a reliable proxy for performance with more clinically realistic tasks, which involve searching for the abnormality across a larger area in the image. Indeed, some studies have shown that signal detection methods (or extensions of such methods) allow to quantitatively relate performance across varying number of possible locations and even free search over an entire image [9]–[13]. In addition, rank order of signal detectability across conditions often generalizes from detection to search tasks.
In more recent years, investigators have highlighted the limitations of some of the simpler detection tasks and have motivated the need to create model observers that account for the process of visual search [14], [15]. Furthermore, a recent study has highlighted discrepancies between rank ordering of imaging systems based on location known detection and search tasks [16].
The goal of the current paper is to demonstrate experimentally how visual search in 3D images introduces a new component to human observer performance which can greatly influence signal detectability and create dissociations with search performance in 2D images. This new component of 3D search relates to visual processing of the image data with extra foveal regions of the retina (locations on the observer’s retina away from the point of fixation). Because of the large volume of 3D data sets radiologists typically cannot exhaustively fixate and scrutinize all regions of interest with the high acuity fovea requiring detection of signals with extra-foveal areas of the human retina. In contrast, the lower volume of data in 2-D images allows the radiologist to fixate a larger portion of the image and have to rely less on extra-foveal processing.
Extra-foveal visual processing, also referred to as the visual periphery, is mediated by a diminished density of retinal photoreceptors (cones), a higher degree of convergence of cones outputs onto retinal ganglion cells, and fewer neurons in primary visual cortex per millimeter of retina. Thus, the periphery does not have access to fine spatial discriminations. Spatial forms surrounding the signal will also have additional detrimental effects on signal detectability at the visual periphery [17], [18]. Extra-foveal processing can alter the detectability of certain types of signals in medical images [19].
Here, we compare visual search of two different types of signals (a small microcalcification-like signal and a larger mass-like signal) in 2D vs. 3D images. We show that a small microcalcification-like signal is more highly detectable than a larger mass-like signal in 2D search. However, the small signal’s detectability largely decreases relative to the larger signal in the 3D search task. We then utilize separate measurements of observer detectability as a function retinal eccentricity and eye position to explain the results in the 2D and 3D search studies.
2. METHODS
2.1 Search Task
The experiment consisted of a yes/no task (50 % probability of signal presence). The subject had unlimited time to find a signal. There were two experimental conditions: 2D or 3D search. There were two types of signals: a small microcalcification-like signal and a larger mass-like signal. The signals were additive on 1/f2.8 filtered noise (with 3D filtering for the 3D images). Observers were instructed to look for one or the other signal in separate trials. For the 3D search, the image was presented as a stack of 2D images and the user could scroll up and down in the stack of images in a similar manner to the way a clinician explores a digital breast tomosynthesis case (DBT). Observer responded using an 8-scale confidence rating. Decision ratings of 1 through 4 corresponded to signal absent decisions. Ratings of 5 through 8 corresponded to a signal present decision. For signal present trials, we provided feedback to the observers with a cue indicating the location. Five naive observers participated in 400 trials per condition. Observer’s eye position data was monitored during the experiment using an infra-red video eye tracker (Eyelink 1000, SR Research).
2.2 Forced fixation to measured d′ vs. eccentricity
A separate Yes/No experiment was conducted with the same group of observers to measure the detectability of the signals (MS and MC) as a function of retinal eccentricity (degrees away from the fovea) in a signal known exactly task. The observers were presented with a fixation point and a cue (highly visible fiduciary marks) indicating the potential location of the signal. They had to maintain their eyes fixated at that point while the stimuli were shown for 500ms and respond with the same 8-scale rating scale, if the signal was present or absent. An infrared video eye tracker was utilized to ensure that observers did not make eye movements. We measured detectability at eccentricities of 0, 1, 2, 3 and 4 degrees for the MC signal. For the MS signal, we measured detectability at eccentricities of 0, 3, 6, 9 and 12 degrees. Steady fixation was ensured utilizing a real time eye position monitoring and interrupting trials in which the observer broke fixation. There were a total of 8,000 trials across all conditions.
2.3 Generation of the Stimuli
Two different types of signals were used in the experiment: a 2D/3D Gaussian blob depending on the experiment (2D/3D). The standard deviation of the Gaussian signal was 10 pixels/voxels that resembled a mass (MS). For the microcalcification-like signal (MC) we used a sphere with 6 pixels/voxels of diameter, with a constant contrast equal to the maximum contrast of the mass (peak contrast = 0.58; (peak contrast – background mean)/background mean). The prevalence of the signals was 50% in a random location in the 2D/3D image, and only 50% of the stimuli had a signal present. The background of the stimuli was generated using a 2D/3D correlated Gaussian noise field tuned to be similar to the noise present in X-ray breast mammograms (Burgess et al. 2001) with 1/f2.8. In the 2D case the size of the image was 1024×820 pixels and in the 3D case the size was 1024×820×100 voxels. We used a Barco MDRC 1119 display calibrated to have linear relationship between grey level and luminance (maximum luminance: 111 cd/m2). Figure 1 shows an example for the MS (right) and MC (left) signals for the 2D and 3D images.
Figure 1.
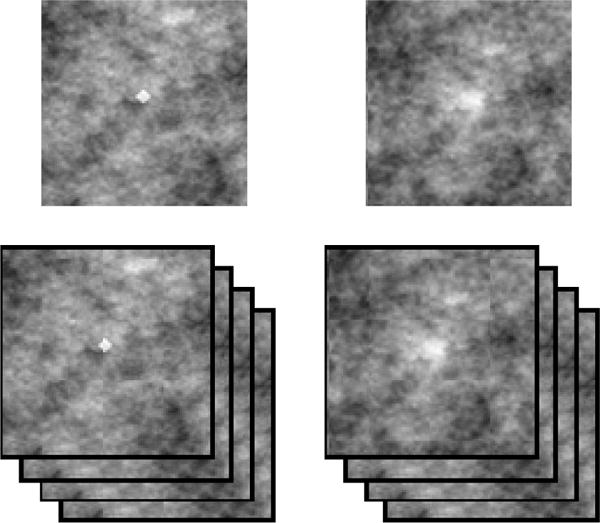
Example of the microcalcification-like signal (MC; left) and mass-like signal (MS; right). Top: 2D (top) and 3D case (bottom) showing the central slice.
3. RESULTS
Figure 2 shows the average index of detectability d′ for the human observers. The relative detectability between the MS and MC signals is significantly different (p < 0.05) across 2D and 3D search. For the 2D search, the smaller microcalcification-like signals (MC) led to a four-fold higher d′ than the MS signals. In contrast, for the 3D search both similar had a very similar detectability with a big increase for the MS signal and a noticeably decrease for the MC signal. We attribute this dissociation in the relationship between signal detectabilities across tasks to the interactions among the signal properties, the properties of visual processing in the visual periphery and the requirements of the search task for 2D and 3D images.
Figure 2.
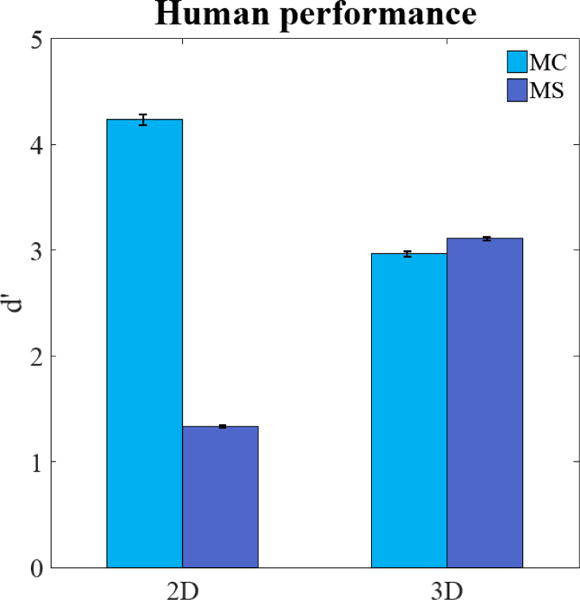
Average detectability index d′ for human observers for small microcalcification-like signal (MC) and larger mass-like signal (MS) in the 2-D and 3-D search task.
The continuous lines in Figure 3 show the detectability (d′; averaged across observers) as a function retinal eccentricity measured in a separate study for 2D images. Results show that d′ at the fovea is higher for the MC signal relative to the MS signal. In addition, the detectability falls more abruptly for the MC signals than for the MS signals.
Figure 3.
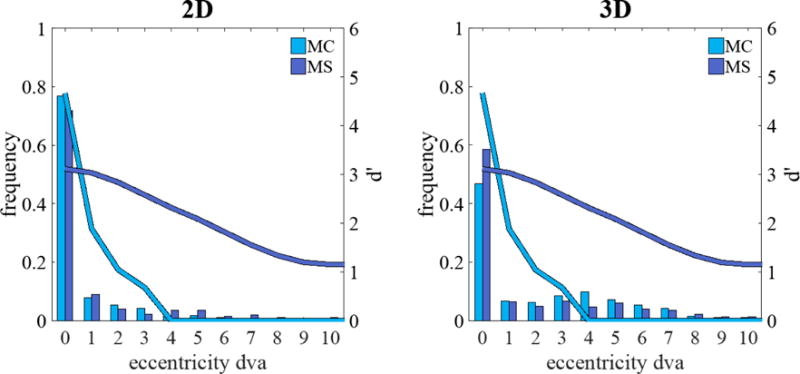
Average detectability index d′ (continuous lines) for human observers for microcalcification-like signal (MC) and mass-like signal (MS) as a function of retinal eccentricity in the 2D (left) and 3D (right) search tasks. Histograms show the frequency of the closest fixation across to the target location (in degrees of visual angle, dva)
The improvement for the detection of the masses from 2D to 3D images is related to the additional samples (slices) in 3D images providing more information. The finding is consistent with previous studies showing human detectability improvements in forced choice tasks with additional temporal samples [20]. Less clear is the explanation for the reduction in d′ for the MC signals from 2D to 3D search. It cannot be accounted by speed accuracy trade-offs. Response times for the MC are longer than the MS by a factor 1.16 in the 2D search and a factor of 1.84 in the 3D search (Figure 4).
Figure 4.
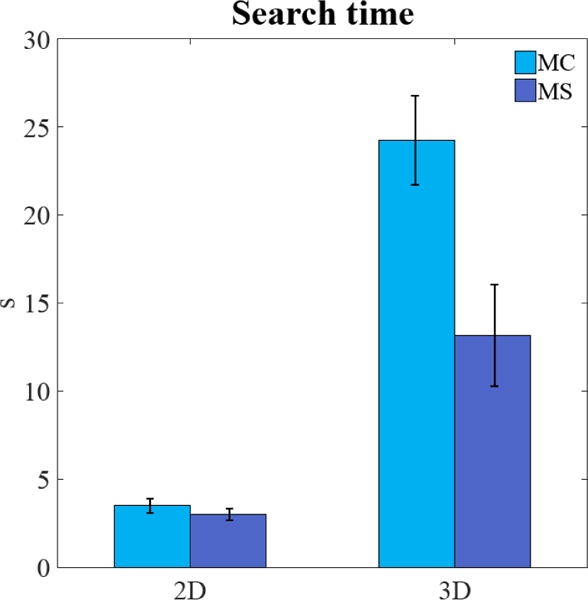
Average search time (seconds, s) for the observers in 2D and 3D for microcalcification-like signals (MC) and larger mass-like signals (MS).
We hypothesize that the dissociation in signal detectability is related to observer’s inability to fixate all regions in the 3D search and thus having to rely on peripheral processing. To assess the frequency of fixations on the signal in the two tasks we utilized our measurements from an infrared video eye tracker to generate a distribution of the closest distance of the observer’s fovea to the target location (for target present trials). Figure 3 shows the frequency distribution of minimum distances of the fovea to the signal (degrees visual angle) across all trials. For the 3D search, observers fixate (0–1 degrees eccentricity) the signal less often than they do for the 2D search. Such extra-foveal processing in 3D search differentially deteriorates d′ for the MC signal due to its high spatial frequency content relative to the MS signal (see continuous lines on Figure 3).
If our hypothesis relating search performance to peripheral processing is correct, it should be possible to calculate an estimated detectability for the search experiments using the distribution of retinal eccentricities of the closest fixations to the signal on each trial and detectabilities of each signal across eccentricities. The aggregate estimated detectability for a search task (d′search) was calculated as an average across trials of d′s for the retinal eccentricities of the signal for the closest fixation of each trial:
Here, d′(en) is the d′ corresponding to the retinal eccentricity of the signal, e, for the closest fixation to the signal for the nth trial. The eye position data was used to determine for each trial, the closest fixation to the signal and its associated eccentricity. Measurements for the detectability as a function eccentricity (Figure 3) were then used to calculate d′(en) for each trial. This method was used to estimate the d′search for the two signals (MS and MC) and the two modalities (2D and 3D). Figure 5 shows that the relative predicted performance for MC and MS signals for 2D and 3D modalities is in general agreement with the human experimental results: MC signals are more detectable in 2D images while, in 3D images, MS signals are more detectable.
Figure 5.
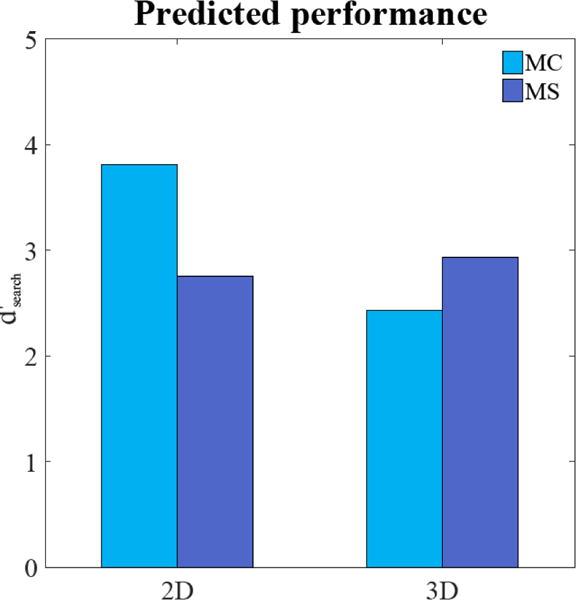
Predicted d′search for the micocalcification-like signal (MC) and mass-like signal (MS) utilizing information about the observer fixation patterns (eccentricity of closest fixation to the signal) and how detectability degrades as function of eccentricity.
4. DISCUSSION AND CONCLUSION
There has been an increase interest in 3D medical imaging modalities with the increasing use of digital breast tomosynthesis and computed tomography. Here, we show that search in 3D images introduces new complexities that make it distinct from 2D search. Visual detectability of signals in 2D images might not always be a good predictor of signal detectability in 3-D images. In particular, we report dissociations in the rank order of detectability of signals across the two imaging modalities. We hypothesized that the dissociation is caused by an inability of observers to exhaustively scrutinize the 3D images with their fovea. In 3D images, search decisions have to rely increasingly on peripheral retinal processing. Because of the different properties of peripheral vs. foveal visual processing, the increase utilization of peripheral processing for 3D imaging makes smaller micrcocalcification-like signal (MC) much harder to detect relative to 2D images. Larger mass-like signals (MS) are less affected by reduction in the frequency of foveations of the signal in 3D images because their detectability diminishes less abruptly with retinal eccentricity (Figure 3). Our hypothesis is supported by measurements of human detectability of the signals as a function of eccentricity and eye position data for 2D and 3D search. Predicted search performance utilizing information about the observer fixation patterns and detectability of the signals with eccentricity could predict the dissociation across 2D and 3D search.
The application of the findings to clinical practice rests on the assumption that radiologists do not exhaustively search each slice in 3D case image case. Radiologists typically 64–128 slices for computed tomography [21], [22] and 50–90 slices for digital breast tomosynthesis [23]–[25]). Based on clinical reading times of 2–3 minutes per case and fixation times of 250–350 ms per fixation, radiologist fixations could range from 4 to 14 fixations per slice (depending on the reading time and number of slices). This suggests that a majority of radiologists are relying on the visual periphery to process much of the data in 3-D images.
What are the implications of these findings? First, the results highlight that assessment of image quality from human observer performance studies with search with 2D images or detection tasks (location known) might not generalize to 3D search. Second, the findings are relevant to the development of model observers. Many groups are currently working the development of model observers for 3D image modalities [26] including digital breast tomosynthesis [27]–[29] and computed tomography [30], [31]. Our results suggest that model observers for 3D images require taking into account visual processing in the periphery. The findings motivate the development of a new family of foveated model observers for accurate assessment of image quality in 3D images (Lago, Abbey, & Eckstein, 2017).
References
- 1.Burgess AE, Jacobson FL, Judy PF. Human observer detection experiments with mammograms and power-law noise. Med Phys. 2001 Apr;28(4):419–437. doi: 10.1118/1.1355308. [DOI] [PubMed] [Google Scholar]
- 2.Chawla AS, Samei E, Saunders R, Abbey C, Delong D. Effect of dose reduction on the detection of mammographic lesions: a mathematical observer model analysis. Med Phys. 2007 Aug;34(8):3385–3398. doi: 10.1118/1.2756607. [DOI] [PubMed] [Google Scholar]
- 3.Rolland JP, Barrett HH. Effect of random background inhomogeneity on observer detection performance. J Opt Soc Am A. 1992 May;9(5):649–658. doi: 10.1364/josaa.9.000649. [DOI] [PubMed] [Google Scholar]
- 4.Zhang Y, Pham BT, Eckstein MP. Automated optimization of JPEG 2000 encoder options based on model observer performance for detecting variable signals in X-ray coronary angiograms. IEEE Trans Med Imaging. 2004 Apr;23(4):459–474. doi: 10.1109/TMI.2004.824153. [DOI] [PubMed] [Google Scholar]
- 5.Eckstein MP. Model observers for signal-known-statistically tasks (SKS) Proceedings of SPIE, San Diego, CA, USA. 2001:91–102. [Google Scholar]
- 6.Brankov JG. Optimization of the internal noise models for channelized Hotelling observer. 2011 IEEE International Symposium on Biomedical Imaging: From Nano to Macro. 2011:1788–1791. [Google Scholar]
- 7.Zhang Y, Pham BT, Eckstein MP. Evaluation of internal noise methods for Hotelling observer models. Med Phys. 2007 Aug;34(8):3312–3322. doi: 10.1118/1.2756603. [DOI] [PubMed] [Google Scholar]
- 8.Zhang Y, Pham BT, Eckstein MP. The effect of nonlinear human visual system components on performance of a channelized Hotelling observer in structured backgrounds. IEEE Trans Med Imaging. 2006 Oct;25(10):1348–1362. doi: 10.1109/tmi.2006.880681. [DOI] [PubMed] [Google Scholar]
- 9.Bochud FO, Abbey CK, Eckstein MP. Search for lesions in mammograms: statistical characterization of observer responses. Med Phys. 2004 Jan;31(1):24–36. doi: 10.1118/1.1630493. [DOI] [PubMed] [Google Scholar]
- 10.Burgess AE, Ghandeharian H. Visual signal detection. II. Signal-location identification. J Opt Soc Am A. 1984 Aug;1(8):906–910. doi: 10.1364/josaa.1.000906. [DOI] [PubMed] [Google Scholar]
- 11.Eckstein MP, Whiting JS. Visual signal detection in structured backgrounds. I. Effect of number of possible spatial locations and signal contrast. J Opt Soc Am A Opt Image Sci Vis. 1996 Sep;13(9):1777–1787. doi: 10.1364/josaa.13.001777. [DOI] [PubMed] [Google Scholar]
- 12.He X, Samuelson F, Zeng R, Sahiner B. Discovering intrinsic properties of human observers’ visual search and mathematical observers’ scanning. J Opt Soc Am A Opt Image Sci Vis. 2014 Nov;31(11):2495–2510. doi: 10.1364/JOSAA.31.002495. [DOI] [PubMed] [Google Scholar]
- 13.Swensson RG, Judy PF. Detection of noisy visual targets: models for the effects of spatial uncertainty and signal-to-noise ratio. Percept Psychophys. 1981 Jun;29(6):521–534. doi: 10.3758/bf03207369. [DOI] [PubMed] [Google Scholar]
- 14.Gifford HC. A visual-search model observer for multislice-multiview SPECT images. Med Phys. 2013 Sep;40(9):092505. doi: 10.1118/1.4818824. [DOI] [PMC free article] [PubMed] [Google Scholar]
- 15.Gifford HC, Liang Z, Das M. Visual-search observers for assessing tomographic x-ray image quality. Med Phys. 2016 Mar;43(3):1563–1575. doi: 10.1118/1.4942485. [DOI] [PMC free article] [PubMed] [Google Scholar]
- 16.He X, Samuelson FW, Zeng R, Sahiner B. Three scenarios of ranking inconsistencies involving search tasks. 2016;9787:97870U–97870U-8. [Google Scholar]
- 17.Rosenholtz R. Capabilities and limitations of peripheral vision. Annual Review of Vision Science. 2016;2:437–457. doi: 10.1146/annurev-vision-082114-035733. [DOI] [PubMed] [Google Scholar]
- 18.Strasburger H, Rentschler I, Jüttner M. Peripheral vision and pattern recognition: A review. Journal of Vision. 2011 May;11(5):13–13. doi: 10.1167/11.5.13. [DOI] [PMC free article] [PubMed] [Google Scholar]
- 19.Diaz I, Eckstein MP, Luyet A, Bize P, Bochud FO. Measurements of the detectability of hepatic hypovascular metastases as a function of retinal eccentricity in CT images. SPIE Medical Imaging. 2012:83180J–83180J. [Google Scholar]
- 20.Eckstein MP. Detection and contrast discrimination of moving signals in uncorrelated Gaussian noise. Proceedings of SPIE, Newport Beach, CA, USA. 1996:9–25. [Google Scholar]
- 21.Otero HJ, Steigner ML, Rybicki FJ. The ‘post-64’ era of coronary CT angiography: Understanding new technology from physical principles. Radiologic Clinics of North America. 2009 Jan;47(1):79–90. doi: 10.1016/j.rcl.2008.11.001. [DOI] [PMC free article] [PubMed] [Google Scholar]
- 22.Rogalla P, Kloeters C, Hein PA. CT technology overview: 64-Slice and beyond. Radiologic Clinics of North America. 2009 Jan;47(1):1–11. doi: 10.1016/j.rcl.2008.10.004. [DOI] [PubMed] [Google Scholar]
- 23.Chan H-P, et al. Computer-aided detection of masses in digital tomosynthesis mammography: Comparison of three approaches. Medical Physics. 2008 Sep;35(9):4087–4095. doi: 10.1118/1.2968098. [DOI] [PMC free article] [PubMed] [Google Scholar]
- 24.Good WF, et al. Digital breast tomosynthesis: A pilot observer study. American Journal of Roentgenology. 2008 Apr;190(4):865–869. doi: 10.2214/AJR.07.2841. [DOI] [PubMed] [Google Scholar]
- 25.Baker JA, Lo JY. Breast Tomosynthesis. Academic Radiology. 2011 Oct;18(10):1298–1310. doi: 10.1016/j.acra.2011.06.011. [DOI] [PubMed] [Google Scholar]
- 26.Platiša L, et al. Channelized Hotelling observers for the assessment of volumetric imaging data sets. J Opt Soc Am A Opt Image Sci Vis. 2011 Jun;28(6):1145–1163. doi: 10.1364/JOSAA.28.001145. [DOI] [PubMed] [Google Scholar]
- 27.Castella C, et al. Mass detection in breast tomosynthesis and digital mammography: a model observer study. Proceedings of SPIE, Lake Buena Vista, FL, USA. 2009:72630O–72630O-10. [Google Scholar]
- 28.Reiser I, Nishikawa RM. Task-based assessment of breast tomosynthesis: effect of acquisition parameters and quantum noise. Med Phys. 2010 Apr;37(4):1591–1600. doi: 10.1118/1.3357288. [DOI] [PMC free article] [PubMed] [Google Scholar]
- 29.Zeng R, Badano A, Myers K. Optimization of digital breast tomosynthesis (DBT) acquisition parameters for human observers: effect of reconstruction algorithms. Phys Med Biol, Feb. 2017 doi: 10.1088/1361-6560/aa5ddc. [DOI] [PMC free article] [PubMed] [Google Scholar]
- 30.Lorsakul A, et al. Numerical observer for atherosclerotic plaque classification in spectral computed tomography. J Med Imaging (Bellingham) 2016 Jul;3(3):035501. doi: 10.1117/1.JMI.3.3.035501. [DOI] [PMC free article] [PubMed] [Google Scholar]
- 31.Tseng H-W, Fan J, Kupinski MA, Sainath P, Hsieh J. Assessing image quality and dose reduction of a new x-ray computed tomography iterative reconstruction algorithm using model observers. Med Phys. 2014 Jul;41(7):071910. doi: 10.1118/1.4881143. [DOI] [PubMed] [Google Scholar]
- 32.Lago M, Abbey CK, Eckstein Miguel P. Foveated model observers to predict human performance in 3D images. SPIE Medical Imaging. 2017 doi: 10.1117/12.2252952. in press. [DOI] [PMC free article] [PubMed] [Google Scholar]


