

Abstract
Objective
Previous studies have reported that polyphenol-rich extracts from various sources can prevent obesity and associated gastro-hepatic and metabolic disorders in diet-induced obese (DIO) mice. However, whether such extracts can reverse obesity-linked metabolic alterations remains unknown. In the present study, we aimed to investigate the potential of a polyphenol-rich extract from cranberry (CE) to reverse obesity and associated metabolic disorders in DIO-mice.
Methods
Mice were pre-fed either a Chow or a High Fat-High Sucrose (HFHS) diet for 13 weeks to induce obesity and then treated either with CE (200 mg/kg, Chow + CE, HFHS + CE) or vehicle (Chow, HFHS) for 8 additional weeks.
Results
CE did not reverse weight gain or fat mass accretion in Chow- or HFHS-fed mice. However, HFHS + CE fully reversed hepatic steatosis and this was linked to upregulation of genes involved in lipid catabolism (e.g., PPARα) and downregulation of several pro-inflammatory genes (eg, COX2, TNFα) in the liver. These findings were associated with improved glucose tolerance and normalization of insulin sensitivity in HFHS + CE mice. The gut microbiota of HFHS + CE mice was characterized by lower Firmicutes to Bacteroidetes ratio and a drastic expansion of Akkermansia muciniphila and, to a lesser extent, of Barnesiella spp, as compared to HFHS controls.
Conclusions
Taken together, our findings demonstrate that CE, without impacting body weight or adiposity, can fully reverse HFHS diet-induced insulin resistance and hepatic steatosis while triggering A. muciniphila blooming in the gut microbiota, thus underscoring the gut-liver axis as a primary target of cranberry polyphenols.
Keywords: Akkermansia, Barnesiella, Obesity, Vaccinium macrocarpon, Flavonoids
Highlights
-
•
CE was shown to prevent obesity and its metabolic complications in DIO-mice.
-
•
CE did not reverse obesity but alleviated liver steatosis and glucose intolerance.
-
•
Liver inflammation was blunted in CE-treated mice.
-
•
CE treatment expanded Akkermansia muciniphila and Barnesiella in the gut microbiota.
-
•
CE targets the gut-liver axis to primarily improve glucose homeostasis.
1. Introduction
Obesity has reached pandemic proportions worldwide, significantly contributing to reduce life quality and lifespan at a global scale [1]. This condition is characterized by abnormal and excessive fat accumulation and is influenced by both genetic and environmental determinants. While several genetic loci have been associated with obesity, they explain only a fraction of the total variance within populations; moreover, genes deemed obesity-predisposing interact with environmental factors to regulate, for instance, satiety and energy expenditure [2]. Among the environmental determinants of obesity and its associated dysmetabolic conditions, dietary habits play a central role. Diet also strongly influences our “other genome” (i.e., the metagenome), modeling gut microbial community structure [3] and impacting host metabolism and energy partitioning [4]. Research conducted throughout the last decade has revealed a clear association between obesity and gut microbial dysbiosis, which is generally characterized by a reduction in bacterial richness and by major taxonomic and functional changes [5].
The consumption of fiberless diets rich in simple sugars and saturated fat (often referred to as Western diets) generates well-known detrimental metabolic consequences, leading to insulin resistance and glucose intolerance in the early-term, which later evolves to overt obesity, type 2 diabetes, and cardiovascular complications. NAFLD and NASH are highly prevalent diseases occurring in the setting of obesity and type 2 diabetes; they may eventually progress to hepatocellular carcinoma and contribute to dysregulate glucose and lipid homeostasis [6]. The gut exerts major influences on liver physiology as both organs are anatomically and functionally connected by means of the portal circulation, but also since bacteria and bacteria-derived molecules can translocate from the gut to the liver and can potentially contribute to diet-induced insulin resistance and liver disease [7], [8].
Plant-rich diets are abundant in fruits and vegetables and strongly linked to lean and healthy phenotypes [9], which prompts the search for bioactive phytonutrients to treat or prevent obesity and its related dysmetabolic conditions. The use of polyphenol-rich fruit extracts or isolated polyphenols as strategies to alleviate obesity-linked diseases have been demonstrated in humans [10], [11] and in animal models [12], [13], but the mechanisms of action are not yet fully elucidated. Several dietary polyphenols are generally poorly bioavailable and build up in the colon, where they are modified by gut microbial enzymes and, in turn, reshape gut microbial communities [14]. We have previously demonstrated that a polyphenol-rich cranberry extract prevents diet-induced obesity in high fat high sucrose-fed mice, and these findings were linked to improved gut-liver homeostasis and expansion of Akkermansia muciniphila population in the gut microbiota [12]. Similar effects were reported by others using a polyphenol-rich extract of concord grape [15] and apple proanthocyanidins [16], but no studies have yet tested whether polyphenols can reverse an already established obesity and more severe metabolic alterations, including hepatic steatosis and inflammation. In the present study, we investigated the potential of a polyphenol-rich cranberry extract to reverse an already established obesity, insulin resistance, and NAFLD, and whether such effects may be linked to the reshaping of the gut microbiota and blooming of A. muciniphila, a well-known target of food polyphenols.
2. Material and methods
2.1. Animals
All animal experiments reported in this manuscript comply with the Animal Research: Reporting of In Vivo experiments (ARRIVE) guidelines. Eight week-old C57Bl/6J male mice (Jackson, USA) were housed 2–3 animals per cage, kept on Sani-chips bedding and in controlled environment (12 h daylight cycle, lights off at 18:00) with food and water ad libitum in the animal facility of the Québec Heart and Lung Institute (Québec, Canada). After two weeks of acclimatization, mice were pre-fed either a healthy Chow (Teklad 2018, Harlan) or a High-Fat/High-Sucrose (HFHS) diet for 21 weeks. Diet composition was previously published [12] and, although the abbreviation HFHS particularly refers to the enriched presence of saturated fat and simple sugars, it is important to stress that the lack of soluble fibers is a major obesogenic component of this diet [17]. During the last 8 weeks of the study (i.e. from the beginning of week 13 to the beginning of week 21), control groups (Chow, n = 8 and HFHS, n = 8) were orally administered the animal facility's drinking water whereas the treated groups (Chow + CE, n = 11 and HFHS + CE, n = 10) received a cranberry extract (CE, 200 mg/kg, Nutra Canada, Québec, Canada). The polyphenolic profile of CE was published elsewhere [12], [18]. Body weight gain and food intake were assessed twice weekly. At week 21, animals were anesthetized in chambers saturated with isoflurane and then sacrificed by cardiac puncture. Organs and tissues were carefully collected and blood was drawn in tubes containing 2 IU of heparin and immediately centrifuged in order to separate plasma from cells. All interventions were carried out during the animals' light cycle. All procedures strictly followed the National Institutes of Health (NIH)’s Guide for the Care and Use of Laboratory Animals and were previously approved by the Laval University Animal Ethics Committee.
2.2. Glucose homeostasis
At week 17, mice were fasted for 6 h and insulin tolerance tests (ITT) were performed after intraperitoneal injections of insulin (0.75 UI/kg body weight). Glycemia was measured with an Accu-Check glucometer (Bayer) before (0 min) and after (10, 20, 30, 60, and 90 min) insulin injection. At the end of week 19, mice were fasted overnight (12 h) and oral glucose tolerance tests were carried out (OGTT, 1 g of glucose/kg body weight). Blood was collected before (0 min) and after (15, 30, 60, 90, and 120 min) glucose challenge for glycemia determination. Blood samples (∼30 μL) were collected at each time point during OGTT and insulinemia was determined using an ultra-sensitive ELISA kit (Alpco, USA). The homeostasis model assessment of insulin resistance (HOMA-IR) index was calculated based on the following formula: fasting insulinemia (μUI/mL) x fasting glycemia (mM)/22.5.
2.3. Oil red O staining
During necropsies, mouse livers were embedded in Tissue-Tek® OCT, immediately snap-frozen in liquid nitrogen, and stored at −80 °C. Staining of neutral lipids was based on the methods described by Mehlem et al. with some adaptations [19]. Briefly, 12 μm liver sections were allowed to equilibrate at room temperature for 5 min and then post-fixed with a Formalin (10%)/Calcium (2%) solution for 15 min. The sections were then incubated with oil red O (ORO) working solution at room temperature for 5 min, followed by a 5- minute clearing in 60% isopropyl alcohol and a counterstaining of 15 s with Mayer's hematoxylin.
2.4. Q-PCR and antioxidant enzymes
Gene mRNA expression analysis by q-PCR and quantification of antioxidant enzymes were carried out as previously described [12]. Primer sequences used were: (5′→ 3′) PPARα F- CGACCTGAAAGATTCGGAAA, R- GGCCTTGACCTTGTTCATGT; PPARγ F- CAGGCCTCATGAAGAACCTT, R- GCATCCTTCACAAGCATGAA; SREBP1c F- GACCCTACGAAGTGCACACA, R- TCATGCCCTCCATAGACACA; SREBP2 F- CGACCAGCTTTCAAGTCCTG, R- CCTGTACCGTCTGCACCTG; LXRα F- GGAGTGTCGACTTCGCAAAT, R- CTTGCCGCTTCAGTTTCTTC; LXRβ F- AAACGATCTTTCTCCGACCA, R- ATGGCTAGCTCGGTGAAGTG; COX2 F- GCTGTACAAGCAGTGGCAAA, R- CCCCAAAGATAGCATCTGGA; TNFα F- GAACTGGCAGAAGAGGCACT, R- AGGGTCTGGGCCATAGAACT; NFκB F- AGCTTCACTCGGAGACTGGA, R- ACGATTTTCAGGTTGGATGC; IκB F- TGGCCAGTGTAGCAGTCTTG, R- GACACGTGTGGCCATTGTAG.
2.5. Cecal mucin determination
Cecal contents were collected at week 21, snap-frozen in liquid nitrogen and stored at −80 °C. Cecal feces were freeze-powdered and the presence of mucins was determined using a fluorometric assay kit (Cosmo Bio, Japan) that discriminates O-linked glycoproteins (mucins) from N-linked glycoproteins.
2.6. Fecal samples
Fecal samples were freshly collected at baseline (week 13) and week 21 and immediately stored at −80 °C. Bacterial genomic DNA was extracted from approximately 50 mg of fecal material collected from each cage. Samples were resuspended in lysis buffer containing 20 mg/ml lysozyme and incubated for 30 min at 37 °C. Further lysis was performed by adding 10% SDS and proteinase K to 350 μg/ml followed by incubation for 30 min at 60 °C. Samples were homogenized using a bead beater and 0.1 mm zirconium beads and then processed using a DNA extraction kit (DNeasy, Qiagen). DNA yield was assessed using a NanoDrop ND-1000 spectrophotometer (Thermo Scientific). Extracted DNA was stored at −20 °C until use. Each DNA sample was subsequently used for 16S amplification of the V3-V4 region using the primers 341F (5′-CCTACGGGNGGCWGCAG-3′) and 805R (5′-GACTACHVGGGTATCTAATCC-3′) adapted to incorporate the transposon-based Illumina Nextera adapters (Illumina, USA) and a sample barcode sequence allowing multiplexed paired-end sequencing. Constructed 16S metagenomic libraries were purified using 35 μL of magnetic beads (AxyPrep Mag PCR Clean up kit; Axygen Biosciences, USA) per 50 μL PCR reaction. Library quality control was performed with a Bioanalyzer 2100 using DNA 7500 chips (Agilent Technologies, USA). An equimolar pool was obtained and checked for quality prior to further processing. The pool was quantified using picogreen (Life Technologies, USA) and loaded on a MiSeq platform using 2 × 300 bp paired-end sequencing (Illumina, USA). High-throughput sequencing was performed at the IBIS (Institut de Biologie Intégrative et des Systèmes - Université Laval). All raw sequences were deposited in the public European Nucleotide Archive server under accession number PRJEB23031.
2.7. 16S rRNA gene-based gut microbial analysis
Generated and demultiplexed sequences were analyzed using the QIIME software package (version 1.9.1). Paired-end sequences were merged with at least a 50-bp overlap using fastq-join. Resulting sequences containing ambiguous or low quality reads (Phred score ≤ 25) were removed from the dataset. Forward and reverse primers were trimmed from the filtered sequences; reads with at least one reverse primer mismatch or where the reverse primer was not found were discarded. Chimera checking and filtering was performed using UCHIME (4). OTU (Operational Taxonomic Units)-picking from post-filtering reads was performed using USEARCH 61 version 6.1.544 [20] with an open-reference methodology, which consisted of clustering sequences de novo at 97% identity threshold if they did not hit the reference sequence collection. Representative OTU sequences were assigned taxonomy against the Greengenes reference database (August 2013 release) [21] using the RDP-classifier [22]. Singleton OTUs and OTUs with a number of sequences <0.005% of total number of sequences were discarded at this step [23]. Unclassified OTUs at the genus level against Greengenes were further investigated with the RDP classifier against the RDP database (version September 30, 2016) [24] using a minimum bootstrap cutoff of 50% [25].
2.8. Statistical analysis
Two-way ANOVA with a Student-Newman-Keuls was used to assign significance to the comparisons between groups (Sigmaplot, USA). The significance of the differences between time points was calculated using two-way repeated measures ANOVA with a Student-Newman-Keuls post hoc test (Sigmaplot, USA). Data are expressed as mean ± SEM. All results were considered statistically significant at P < 0.05.
In order to illustrate β-diversity of metagenomic samples, weighted UniFrac distance matrix was calculated at the genus level based on taxa having at least 1% of total relative abundance. PCoA (Principal Coordinates Analysis) was performed on the resulting distance matrix using the 'phyloseq' R package (version 1.16.2). The statistical significance of differentially abundant and biologically relevant taxonomical biomarkers between two distinct biological conditions was measured using a linear discriminant analysis (LDA) effect size (LEfSe) [26]. Only taxa meeting an LDA significant threshold of 2.5 were considered. A P-value < 0.05 was considered to indicate statistical significance for the factorial Kruskal–Wallis rank-sum test.
3. Results
CE administration throughout 8 weeks did not reverse body weight gain in both Chow- and HFHS-fed mice (Figure 1A). Accordingly, we found similar energy intake and fat mass accumulation when comparing Chow versus Chow + CE and HFHS versus HFHS + CE (Figure 1B,C). Interestingly, the livers of CE-treated HFHS-fed mice tended to be lighter than those of untreated HFHS-fed mice (Figure 2A) and, during necropsies, we noted that the livers of untreated HFHS-fed mice were pale and clearly steatotic whereas those of HFHS + CE mice displayed a reddish healthy aspect (Figure 2C, top panel). Quantification of liver triglycerides and ORO staining revealed massive triglyceride accumulation in the livers of HFHS mice, which was fully reversed in HFHS + CE mice (Figure 2B–D). CE administration did not reduce triglyceride levels in the liver of healthy Chow-fed mice (Figure 2B–D) and fasting plasma triglycerides were not affected by diet or treatment (Figure 2E).
Figure 1.

Impact of CE on body features of Chow- and HFHS-fed mice. Mice were pre-fed a standard Chow diet or a high fat/high sucrose diet throughout 13 weeks and treated either with a cranberry extract (CE) or the vehicle for 8 additional weeks. (A) Weight gain and final body weight; (B) energy intake; (C) weight of visceral and subcutaneous fat pads. Two-way repeated measures RM-ANOVA with a Student-Newman-Keuls post hoc test was used to assign significance to the differences between time points within different groups. Two-way ANOVA with a Student-Newman-Keuls post hoc test was applied to calculate the significance of the differences between groups. Data are expressed as the mean ± SEM; n = 8–11; *P < 0.05, **P < 0.01 and ***P < 0.001.
Figure 2.

CE reverses hepatic steatosis and alleviates liver inflammation. (A) Liver weight, (B) hepatic triglyceride accumulation, (C) representative images of hepatic lipid accumulation by oil red O (ORO) staining, (D) quantification of ORO-positive area, and (E) plasma triglycerides. (F) Hepatic quantification of [MDA] malondialdehyde, [SOD] superoxide dismutase, [GPx] glutathione peroxidase, and catalase. (G) Liver mRNA expression of [COX2] cyclooxygenase 2, [TNFα] tumor necrosis factor α, [NFκB], nuclear factor κ-light-chain-enhancer of activated B cells, [IκB] NFκB inhibitor. (H) Liver mRNA expression of [PPARα/γ] peroxisome proliferator-activated receptor α and γ, [SREBP1c/2] sterol regulatory element-binding protein 1c and 2 and [LXRα/β] liver X receptor α and β. Two-way ANOVA with a Student-Newman-Keuls post hoc test was applied to calculate the significance of the differences between groups. Data are expressed as the mean ± SEM; n = 8–11; *P < 0.05, **P < 0.01 and ***P < 0.001.
Liver MDA levels were reduced in HFHS + CE mice when compared with vehicle-treated HFHS mice (Figure 2F), suggesting lower lipid peroxidation. Conversely, levels of superoxide dismutase (SOD, SOD2), glutathione peroxidase (GPx), and catalase, all important constituents of the cell's anti-oxidant defenses, were not affected by diet, treatment, or the interaction of both (Figure 2F). Interestingly, CE administration reversed the HFHS-induced mRNA overexpression of cyclooxygenase-2 (COX2), tumor necrosis factor-α (TNFα), nuclear factor κ-light-chain-enhancer of activated B cells (NFκB) and NFκB inhibitor (IκB), suggesting a broad resolution of diet-induced hepatic inflammation in HFHS-fed CE-treated mice (Figure 2G). Consistent with improved hepatic steatosis we found higher mRNA levels of peroxisome proliferator-activated receptor α (PPARα) and lower levels of both sterol regulatory element-binding protein 1 and 2 (SREBP1/2) transcripts in the livers of HFHS + CE mice versus HFHS mice (Figure 2H). Unexpectedly, the mRNA expression of PPARγ and liver X receptor α and β (LXRα/β), all nuclear factors linked to lipid anabolism, was upregulated in HFHS + CE in comparison with vehicle-treated HFHS-fed mice (Figure 2H).
We then sought to investigate whether glucose homeostasis and insulin sensitivity were affected by CE administration in diet-induced obese mice. We found lower glycemia 10 and 15 min after insulin injection (Figure 3A) and lower area under the ipITT curves (Figure 3B) in CE-treated versus vehicle-treated HFHS-fed mice. Despite lower glycemia 5 min after insulin injection in Chow + CE as compared with Chow mice (Figure 3A), the overall insulin response was not different between these two groups as suggested by similar area under the ipITT curves (Figure 3B). We found lower glucose excursions 30, 90, and 120 min after oral glucose challenge (Figure 3C) and reduced area under the OGTT curves (Figure 3D) in HFHS + CE versus HFHS mice. Importantly, determination of insulinemia during OGTT revealed that improved glucose tolerance in HFHS + CE mice was achieved despite lower basal and 15 min insulin levels post-glucose challenge (Figure 3E), which are in agreement with markedly improved insulin sensitivity in these animals. Glucose tolerance and insulinemia during OGTT were not different between CE-treated and vehicle treated mice on the Chow diet (Figure 3C–E).
Figure 3.

CE improves glucose homeostasis and insulin sensitivity in diet-induced obese mice. At week 17, mice were fasted for 6 h and (A, B) insulin tolerance tests (ipITT) were carried out after intraperitoneal insulin injections (ipITT, 0.65 IU/kg). At week 19, mice were fasted overnight (12 h) and submitted to (C, D) oral glucose tolerance tests (OGTT). (E) Blood was collected during OGTT and used to assess insulinemia after glucose challenge. (A, C, E) Two-way repeated measures ANOVA with a Student-Newman-Keuls post hoc test was used to assign significance to the differences between time points within groups. *P < 0.05, **P < 0.01 and ***P < 0.001 for Chow vs HFHS; #P < 0.05, ##P < 0.01; ###P < 0.001 for HFHS vs HFHS + CE; &P < 0.05 for Chow vs Chow + CE. (B, D, F) Two-way ANOVA with a Student-Newman-Keuls post hoc test was applied to calculate the significance of the differences between groups; n = 8–11; *P < 0.05, **P < 0.01 and ***P < 0.001. Data are expressed as the mean ± SEM.
Fecal DNA was extracted and 16S rRNA-based microbial profiling was performed in order to investigate whether the phenotypic traits of Chow, Chow + CE, HFHS, and HFHS + CE were associated with changes in gut microbial community structure. β-diversity was generally assessed by means of principal component analysis (PCoA) on weighted unifrac distances and revealed a clear diet-induced separation in the microbial composition of Chow- and HFHS-fed mice (PCo1, 57,1%) (Figure 4A). Treatment also importantly influenced the gut microbiota (PCo2, 21,3%) and separated vehicle- and CE-treated microbial communities of both Chow- and HFHS-fed mice (Figure 4A). β-diversity changes between HFHS and HFHS + CE were accompanied by a drop in the Firmicutes to Bacteroidetes ratio in HFHS + CE mice versus vehicle-treated HFHS-fed mice (Figure 4B). LEfSe analysis disclosed that obesity-driven dysbiosis was mostly explained by a reduction in the populations of Barnesiella, Bifidobacterium, Turicibacter, Anaerostipes, and Clostridium and an expansion of Peptostreptococcaceae, Clostridiales, Oscillospira, Oscillibacter, Clostridiaceae, and Anaerotruncus (Figure 4C). Administration of CE to Chow-fed mice was associated with an increase of Clostridiales, Lachnospiraceae and A. muciniphila (Figure 4D and Supplemental Figure 1), whereas in HFHS-fed mice CE-treatment was related to expansion of A. muciniphila, Coprobacillus, and Barnesiella (Figure 4E and Supplemental Figure 1).
Figure 4.

CE administration alters the taxonomic profile of Chow- and HFHS-fed mice. Genomic DNA was extracted from feces collected at week 21 and subsequent 16S rRNA-based gut microbial profiling was performed. Feces from mice housed in the same cage were pooled and considered as one biological sample (Chow n = 3; Chow + CE n = 4; HFHS n = 3 and HFHS + CE n = 4). (A) β-diversity among groups was initially observed by means of principal component analysis (PCoA) on weighted unifrac distances, and the (B) Firmicutes to Bacteroidetes ratio was calculated as a general index of obesity-driven dysbiosis. Linear discriminant analysis (LDA) effect size (LEfSe) was calculated in order to explore the taxa that more strongly discriminate between the gut microbiota of (C) Chow vs. HFHS, (D) Chow vs Chow + CE and (E) HFHS vs HFHS + CE. (B) Two-way ANOVA with a Student-Newman-Keuls post hoc test was applied to calculate the significance of the differences between groups. *P < 0.05, **P < 0.01 and ***P < 0.001.
Because the presence of A. muciniphila in the gut microbiota has been linked to improved intestinal barrier and mucus layer integrity [27], [28], we assessed fecal mucin as a readout of mucus layer thickness. We found a reduction in fecal mucin in HFHS-fed mice as compared to Chow-fed mice, which tended to be reversed in HFHS + CE (P = 0.06, HFHS vs HFHS + CE; two-way ANOVA with Student-Newman-Keuls post hoc test) (Figure 5). Regression analysis revealed that the abundance of A. muciniphila in the gut microbiota explains 91% of the increase in fecal mucin and 82% of the decrease in triglyceride deposition in the liver HFHS + CE mice (Suppl. Figure 2).
Figure 5.
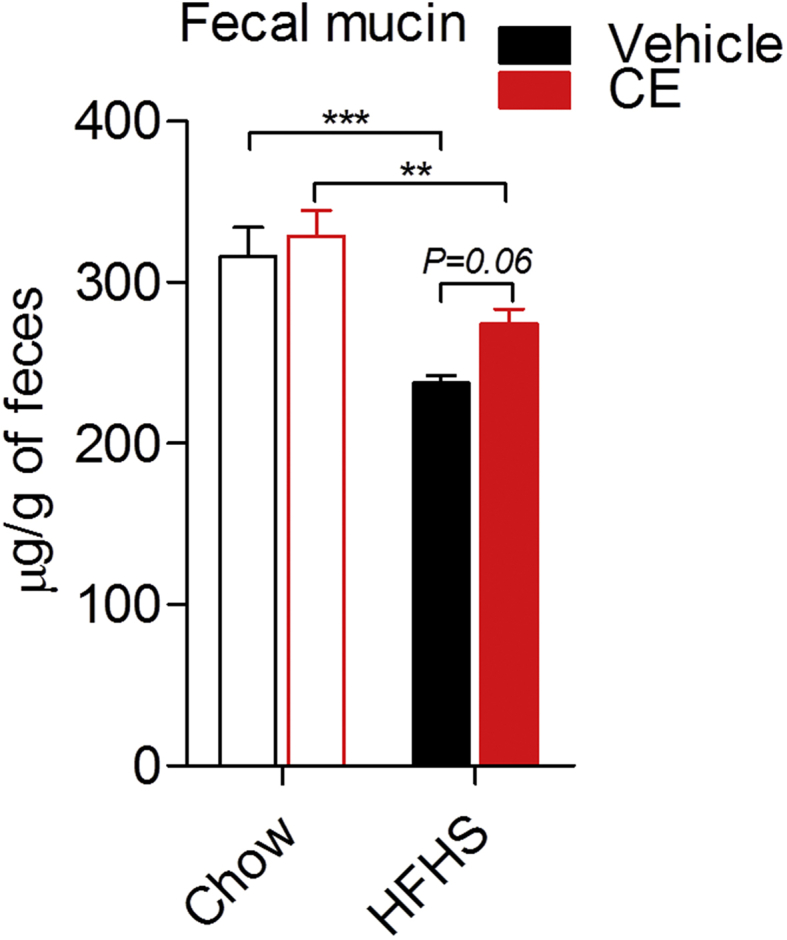
Fecal mucin quantification. Cecal contents were collected at week 21, snap-frozen in liquid nitrogen and stored at −80 °C. Cecal feces were freeze-powdered and the presence of mucins was determined using a fluorometric assay kit that discriminates O-linked glycoproteins (mucins) from N-linked glycoproteins. Two-way ANOVA with a Student-Newman-Keuls post hoc test was applied to calculate the significance of the differences between groups. *P < 0.05, **P < 0.01 and ***P < 0.001.
4. Discussion
We and others have previously shown that concomitant and sustained treatment of diet-induced obese mice with polyphenol-rich extracts protected against obesity and also resulted in reduced hepatic steatosis, alleviated intestinal inflammation and a drastic expansion of A. muciniphila in the gut microbiota [12], [15]. In these studies, however, it was not possible to determine to what extent the preventive effects of such extracts were secondary to lower body weight gain and reduced fat mass accretion. In the present study, we now document that CE can protect against two major metabolic complications of obesity, insulin resistance, and NAFLD, independently from changes in body weight or adiposity.
The marked reduction of fat deposition in the livers of CE-treated mice was accompanied by reduced hepatic inflammation, as suggested by downregulation of COX2, TNFα, NFκB and IκB mRNA expression. Conversely, enzymatic components of the cellular antioxidant machinery (i.e. SOD1, SOD2, GPx, catalase) were unaltered in the livers of HFHS + CE mice, and similar results were found in db/db mice supplemented with a cranberry powder [29]. Importantly, lower hepatic levels of MDA indicated that lipid peroxidation is decreased in HFHS + CE mice. This is possibly explained by the lower availability of triglycerides in the livers of HFHS-fed CE-treated mice. In addition, CE may counter ROS-induced lipid peroxidation in the liver by alleviating inflammation and thereby toning down ROS formation. Since CE did not alter the cells' antioxidant defense in the liver, it is also plausible that CE polyphenols directly neutralize ROS, which would further contribute to reduce lipid peroxidation.
Consistent with augmented lipid catabolism in the liver, we found higher mRNA levels of PPARα and lower amount of mRNA transcripts of SREBP1 and SREBP2 in HFHS + CE mice when compared with untreated HFHS-fed mice. However, in apparent contradiction with lower hepatic steatosis, CE treatment was associated with higher mRNA expression of PPARγ and upregulation of LXRα and LXRβ mRNA in HFHS-fed mice. PPARα is a key nuclear receptor to steatogenesis, being highly expressed in the liver and the principal activator of PPAR-responsive elements (PPREs) in this organ [30], [31], [32]. It is therefore conceivable that PPARα-related activation of β-oxidation genes likely overcomes PPARγ-driven stimulation of lipogenesis in the liver of HFHS-fed CE treated mice. Moreover, PPARγ and LXR are both highly expressed in Kupffer cells (liver resident macrophages), where their activation is linked to anti-inflammatory effects [33], [34]. Thus macrophage PPARγ and LXRα/β transcripts may account for the increased expression of these nuclear receptors in the livers of HFHS + CE mice and contribute to alleviate hepatic inflammation. Interestingly, since activation of hepatic PPARγ and LXR are both linked to reduced hepatic glucose output [30], [35], [36], our results also point to a role of these two nuclear receptors in the CE-related benefits to glucose homeostasis. Taken together, our findings suggest that CE alleviates steatogenesis by targeting PPARα, but also by upregulating PPARγ and LXRα/β. This mRNA expression profile is consistent with enhanced hepatic immune-metabolic status and increased lipid catabolism in the liver. It is noteworthy that the massive lipid deposition observed in the livers of HFHS-fed mice did not result in dyslipidemia in our model, as suggested by similar levels of fasting plasma triglycerides found among groups. While this is presumably linked to the fact that, as opposed to humans, mice have a low LDL/high HDL cholesterol profile, which might favor hepatic lipid storage and limit dyslipidemia in diet-induced obese mice [37], this observation indicates that the marked effect of CE on hepatic triglyceride accretion is not a consequence of increased lipid mobilization to the plasma, which is in accordance with enhanced lipid oxidation being the main mechanism of reduced liver fat accumulation in HFHS + CE mice.
Because gut microbial factors are increasingly recognized as key drivers of hepatic metabolism [7], [8], [38] and because CE has been previously linked to major gut microbial changes [12], we sought to investigate intestinal bacterial profiles in CE- and vehicle-treated mice. Similarly to our previous report using a preventive approach [12], we found that CE administration to already obese mice triggered a remarkable bloom of A. muciniphila in the gut microbiota of HFHS-fed mice. This effect of CE treatment was also observed, albeit to a lesser extent, in Chow-fed mice. A. muciniphila is a Gram-negative mucin degrading bacterium strongly correlated with healthy and lean phenotypes [5], [39], and its administration as a probiotic was shown to reverse diet-induced obesity in mice [27], [40]. Previous studies have demonstrated a particular association between higher A. muciniphila and better glycemic control, which was independent of reduced visceral fat mass deposition [41], [42]. These findings suggest that the interaction between A. muciniphila and host metabolism is context-specific, being likely dependent on factors such as gut community structure, the severity of the dysmetabolic condition and the host's genetic background. Indeed, Shin et al. showed that the metformin-like effects of A. muciniphila on glucose tolerance were only achieved with doses higher than 4 × 10⁷ CFU in diet-induced obese mice [28]. Our results revealed that, upon a 21-week long HFHS regimen, the CE-related increase in A. muciniphila population was not linked to lower fat accumulation, but it was associated with improved glucose metabolism and alleviated hepatic steatosis.
Despite the fact that LEfSe analysis did not classify A. muciniphila as a key-phylotype of Chow + CE mice, we found a small yet significant increase in this taxon in Chow-fed CE-treated mice versus vehicle-treated Chow-fed mice by applying a distinct statistical approach. Because Chow-fed mice are metabolically healthy, this finding was not associated with major changes in glucose homeostasis or weight gain. However, this result is of great relevance as it suggests that CE may still favor an expansion of A. muciniphila in healthy individuals, which might be protective in the long-term. Moreover, Lachnospiraceae and Clostridiales were both ranked as important discriminative taxa between Chow + CE and vehicle-treated Chow-fed mice. This may be related to the capacity of certain species within the family Lachnospiraceae and the order Clostridiales to resist to the antimicrobial effect of CE and/or utilize CE-polyphenols as substrates. More studies are warranted to further explore the gut microbial-related protective role of CE polyphenols in healthy mice.
Cranberry polyphenols have been shown to improve mucus layer and villi morphology in mice receiving elemental enteral nutrition [43]. Moreover, dietary polyphenols increased the amount of mucin in the feces of high fat-fed mice [44]. We therefore hypothesized that CE may create a favorable environment for A. muciniphila to thrive by boosting mucus secretion [12], [45]. In accordance with this hypothesis, we found a strong trend (P = 0.06) towards higher mucin concentration in the cecum of CE-treated HFHS-fed mice and that A. muciniphila is a strong predictor of fecal mucin and liver triglyceride accumulation. Consistently, enhanced mucus layer thickness was previously observed in DIO-mice treated with live A. muciniphila [27]. Our data suggest that the benefits of CE to gut barrier and hepatic homeostasis are tightly linked to expansion of A. muciniphila in the gut microbiota.
Polyphenols possess antimicrobial activity [46] and, because Gram-negative bacteria are generally more resistant to this effect [47], A. muciniphila may find a competitive advantage in the gut environment of CE-treated mice. Similar mechanism might favor the presence of Barnesiella spp in the gut microbiota of HFHS + CE mice. While little is known about the relevance of Barnesiella spp to the host, our data stress its beneficial impact on host metabolism as they classified this taxon as the main discriminative feature of Chow-fed mice when compared with HFHS-fed mice. Moreover, it has been suggested that Barnesiella spp. confer resistance to intestinal growth and bloodstream infection with vancomycin-resistant Enterococcus [48], which supports a beneficial interaction between host and Barnesiella. Coprobacillus was ranked a key-feature of HFHS + CE mice; however, its abundance is much lower than 1% and its relevance to host metabolism might be minor in this study.
Lower Firmicutes to Bacteroidetes ratio is often considered as a key feature of the “obese gut microbiota” [49], [50]. In our model, however, we found lower Firmicutes to Bacteroidetes ratio in association with improved glucose and insulin tolerance in HFHS + CE mice, traits that were unrelated with changes in body weight and fat mass accumulation. While suggesting that CE-driven gut microbial remodeling is primarily linked to hepatic homeostasis and the regulation of glucose metabolism/insulin sensitivity, our findings also indicate that lower Firmicutes to Bacteroidetes ratio seems to influence host glucose homeostasis prior to affect host fat mass accretion. Indeed, lower Firmicutes to Bacteroidetes ratio has been particularly associated with better glycemic control in humans [41], and reconstitution of germ-free mice with the fecal slurry of mice fed on a high-fat diet for 10 weeks rendered them glucose intolerant but not obese [51]. Future studies are warranted to determine whether CE administration for a longer period of time, therefore more chronically exposing the host to lower Firmicutes to Bacteroidetes ratio and higher A. muciniphila, would affect host fat mass storage.
The dose of CE used in this study (200 mg of extract/kg, 75 mg of polyphenols/kg) is equivalent to the consumption of approximately 120 g of fresh cranberries/day by a 60 kg individual [18]. The translation of this dose to humans, however, is probably not straightforward. Considering the US Food and Drug Administration's guidelines to calculate the human equivalent dose based on body surface area [52] we found that a 16 mg of extract/kg (6 mg of polyphenols/kg) dose would be the human equivalent of a 200 mg/kg dose in mice. Based on this, we estimated that obtaining 360 mg of polyphenols/60 kg from a cranberry juice cocktail (a very popular form of consuming cranberries) would require the daily consumption of 206.8 mL of this product (considering a cocktail containing 54% of cranberry juice and 1.74 mg of polyphenols/mL [53]). It is, however, important to stress that while the polyphenolic composition of cranberry juices or cranberry juice cocktails may be different from that of the extract, these preparations often contain added sugars and/or artificial sweeteners [53], which may contribute to metabolic disease. We believe that other sources of cranberry polyphenols, such as capsuled cranberry extract or unsweetened dried cranberries, are likely better options in order to target metabolic diseases.
As a prospect, changes in the bile acid profile may be investigated as a mechanism behind the metabolic benefits of CE. Bile acids can regulate their own synthesis and ileal re-uptake via binding to the nuclear receptor farnesoid-X-receptor (FXR). Furthermore, the role of bile acids goes beyond aiding lipid digestion and extends to regulation of glucose/lipid homeostasis and energy metabolism [54]. Interestingly, while changes in bile acid profile have been associated with NASH in clinical studies [55], pre-clinical analyses using mouse models of obesity have revealed that FXR agonism is protective against liver steatosis and insulin resistance [56], [57]. Since dietary polyphenols have been shown to bind to bile acids and alter their re-uptake (and possibly their ability to signal through FXR) [58], [59], it is possible that CE treatment changes the bile acid profile, which may in turn contribute to improve liver steatosis and insulin resistance. Bile acids are modified by the gut microbiota, yielding secondary bile acids. Since CE importantly affects gut microbial populations, it may also affect the microbial capacity to transform bile acids, which would further contribute to modify the bile acid profile and potentially modulate metabolic status. It is noteworthy that the ability of A. muciniphila and Barnesiella, the two best representative taxa of HFHS + CE, to modify or resist to bile acids is currently unknown.
5. Conclusions
Our findings shed light on novel mechanisms by which CE improves metabolic health. Using a reversal experimental design allowed us to demonstrate that CE polyphenols strongly target the liver, where it modulates key hepatic nuclear factors and genes involved in the modulation of steatogenesis and inflammation, thus markedly improving liver homeostasis. This was associated with improvements in glucose tolerance and full restoration of insulin sensitivity despite the maintenance of obesity in these animals. Our data also put forward A. muciniphila and Barnesiella spp. as potential microbial contributors to the effect of CE and that the abundance of these bacteria in the gut microbiota is not phenotypically linked to changes in obesity. Finally, while supporting the regular consumption of cranberries to help counteracting obesity-related diseases, our data provide the fundamental bases for future human trials with CE or CE-related products as a strategy against diet-induced NAFLD/NASH and metabolic syndrome.
Financial support
This work was funded by a Canadian Institutes of Health Research (CIHR) foundation grant (FDN#143247) to AM, J.D deSève grants to EL and AM and a Leahy Orchards Inc. & AppleActiv grant to EL.
Acknowledgements
We are grateful to Valérie Dumais, Christine Dion, Christine Dallaire, and Joannie Dupont-Morissette for their expert help with animal care.
Footnotes
Supplementary data related to this article can be found at https://doi.org/10.1016/j.molmet.2017.10.003.
Contributor Information
Fernando F. Anhê, Email: fernando.forato@criucpq.ulaval.ca.
Renato T. Nachbar, Email: renatotnt.uem@gmail.com.
Thibault V. Varin, Email: Thibaut.Varin.1@ulaval.ca.
Vanessa Vilela, Email: vilelarvanessa@hotmail.com.
Stéphanie Dudonné, Email: Stephanie.Dudonne.1@ulaval.ca.
Geneviève Pilon, Email: Genevieve.Pilon@criucpq.ulaval.ca.
Maryse Fournier, Email: fourniermaryse1@gmail.com.
Marc-André Lecours, Email: malecours@hotmail.com.
Yves Desjardins, Email: Yves.Desjardins@fsaa.ulaval.ca.
Denis Roy, Email: Denis.Roy@fsaa.ulaval.ca.
Emile Levy, Email: emile.levy@recherche-ste-justine.qc.ca.
André Marette, Email: Andre.Marette@criucpq.ulaval.ca.
Conflict of interest
The authors declare no conflict of interest.
Appendix A. Supplementary data
The following are the supplementary data related to this article:

Supplemental Figure 1Gut microbial profile at genus level. In order to eliminate the putative influence of baseline (week 13) gut microbiota, the Δ relative abundance week21- relative abundance week13 was calculated. Significance was calculated using Mann–Whitney U test with a Monte Carlo permutation test, *P < 0.05, **P < 0.01 and ***P < 0.001.

Supplemental Figure 1Linear regression analysis. How the abundance of A. muciniphila in each cage explains the variability in the amount of (A) fecal mucin and (B) liver triglyceride deposition was calculated by regression analysis. The phenotype per cage (n = 4) considers the average of mice housed together. r2 – coefficient of determination.
References
- 1.Finucane M.M., Stevens G.A., Cowan M.J., Danaei G., Lin J.K., Paciorek C.J. National, regional, and global trends in body-mass index since 1980: systematic analysis of health examination surveys and epidemiological studies with 960 country-years and 9.1 million participants. Lancet. 2011;377:557–567. doi: 10.1016/S0140-6736(10)62037-5. [DOI] [PMC free article] [PubMed] [Google Scholar]
- 2.Locke A.E., Kahali B., Berndt S.I., Justice A.E., Pers T.H., Day F.R. Genetic studies of body mass index yield new insights for obesity biology. Nature. 2015;518:197–206. doi: 10.1038/nature14177. [DOI] [PMC free article] [PubMed] [Google Scholar]
- 3.David L.A., Maurice C.F., Carmody R.N., Gootenberg D.B., Button J.E., Wolfe B.E. Diet rapidly and reproducibly alters the human gut microbiome. Nature. 2014;505:559–563. doi: 10.1038/nature12820. [DOI] [PMC free article] [PubMed] [Google Scholar]
- 4.Zietak M., Kovatcheva-Datchary P., Markiewicz L.H., Stahlman M., Kozak L.P., Backhed F. Altered microbiota contributes to reduced diet-induced obesity upon cold exposure. Cell Metabolism. 2016;23:1216–1223. doi: 10.1016/j.cmet.2016.05.001. [DOI] [PMC free article] [PubMed] [Google Scholar]
- 5.Le Chatelier E., Nielsen T., Qin J., Prifti E., Hildebrand F., Falony G. Richness of human gut microbiome correlates with metabolic markers. Nature. 2013;500:541–546. doi: 10.1038/nature12506. [DOI] [PubMed] [Google Scholar]
- 6.Margini C., Dufour J.F. The story of HCC in NAFLD: from epidemiology, across pathogenesis, to prevention and treatment. Liver International: Official Journal of the International Association for the Study of the Liver. 2016;36:317–324. doi: 10.1111/liv.13031. [DOI] [PubMed] [Google Scholar]
- 7.Cani P.D., Amar J., Iglesias M.A., Poggi M., Knauf C., Bastelica D. Metabolic endotoxemia initiates obesity and insulin resistance. Diabetes. 2007;56:1761–1772. doi: 10.2337/db06-1491. [DOI] [PubMed] [Google Scholar]
- 8.Amar J., Chabo C., Waget A., Klopp P., Vachoux C., Bermudez-Humaran L.G. Intestinal mucosal adherence and translocation of commensal bacteria at the early onset of type 2 diabetes: molecular mechanisms and probiotic treatment. EMBO Molecular Medicine. 2011;3:559–572. doi: 10.1002/emmm.201100159. [DOI] [PMC free article] [PubMed] [Google Scholar]
- 9.Wang X., Ouyang Y., Liu J., Zhu M., Zhao G., Bao W. Fruit and vegetable consumption and mortality from all causes, cardiovascular disease, and cancer: systematic review and dose-response meta-analysis of prospective cohort studies. BMJ: British Medical Journal. 2014;349 doi: 10.1136/bmj.g4490. [DOI] [PMC free article] [PubMed] [Google Scholar]
- 10.Bozzetto L., Annuzzi G., Pacini G., Costabile G., Vetrani C., Vitale M. Polyphenol-rich diets improve glucose metabolism in people at high cardiometabolic risk: a controlled randomised intervention trial. Diabetologia. 2015;58:1551–1560. doi: 10.1007/s00125-015-3592-x. [DOI] [PubMed] [Google Scholar]
- 11.Cases J., Romain C., Dallas C., Gerbi A., Cloarec M. Regular consumption of Fiit-ns, a polyphenol extract from fruit and vegetables frequently consumed within the Mediterranean diet, improves metabolic ageing of obese volunteers: a randomized, double-blind, parallel trial. International Journal of Food Sciences and Nutrition. 2015;66:120–125. doi: 10.3109/09637486.2014.971229. [DOI] [PubMed] [Google Scholar]
- 12.Anhe F.F., Roy D., Pilon G., Dudonne S., Matamoros S., Varin T.V. A polyphenol-rich cranberry extract protects from diet-induced obesity, insulin resistance and intestinal inflammation in association with increased Akkermansia spp. population in the gut microbiota of mice. Gut. 2015;64:872–883. doi: 10.1136/gutjnl-2014-307142. [DOI] [PubMed] [Google Scholar]
- 13.Thaiss C.A., Itav S., Rothschild D., Meijer M., Levy M., Moresi C. Persistent microbiome alterations modulate the rate of post-dieting weight regain. Nature. 2016;540:544–551. doi: 10.1038/nature20796. [DOI] [PubMed] [Google Scholar]
- 14.Manach C., Scalbert A., Morand C., Remesy C., Jimenez L. Polyphenols: food sources and bioavailability. The American Journal of Clinical Nutrition. 2004;79:727–747. doi: 10.1093/ajcn/79.5.727. [DOI] [PubMed] [Google Scholar]
- 15.Roopchand D.E., Carmody R.N., Kuhn P., Moskal K., Rojas-Silva P., Turnbaugh P.J. Dietary polyphenols promote growth of the gut bacterium Akkermansia muciniphila and attenuate high-fat diet-induced metabolic syndrome. Diabetes. 2015;64:2847–2858. doi: 10.2337/db14-1916. [DOI] [PMC free article] [PubMed] [Google Scholar]
- 16.Masumoto S., Terao A., Yamamoto Y., Mukai T., Miura T., Shoji T. Non-absorbable apple procyanidins prevent obesity associated with gut microbial and metabolomic changes. Scientific Reports. 2016;6:31208. doi: 10.1038/srep31208. [DOI] [PMC free article] [PubMed] [Google Scholar]
- 17.Chassaing B., Miles-Brown J., Pellizzon M., Ulman E., Ricci M., Zhang L. Lack of soluble fiber drives diet-induced adiposity in mice. American Journal of Physiology Gastrointestinal and Liver Physiology. 2015;309:G528–G541. doi: 10.1152/ajpgi.00172.2015. [DOI] [PMC free article] [PubMed] [Google Scholar]
- 18.Dudonné S., Varin T.V., Forato Anhê F., Dubé P., Roy D., Pilon G. Modulatory effects of a cranberry extract co-supplementation with Bacillus subtilis CU1 probiotic on phenolic compounds bioavailability and gut microbiota composition in high-fat diet-fed mice. PharmaNutrition. 2015;3:89–100. [Google Scholar]
- 19.Mehlem A., Hagberg C.E., Muhl L., Eriksson U., Falkevall A. Imaging of neutral lipids by oil red O for analyzing the metabolic status in health and disease. Nature Protocols. 2013;8:1149–1154. doi: 10.1038/nprot.2013.055. [DOI] [PubMed] [Google Scholar]
- 20.Edgar R.C. Search and clustering orders of magnitude faster than BLAST. Bioinformatics. 2010;26:2460–2461. doi: 10.1093/bioinformatics/btq461. [DOI] [PubMed] [Google Scholar]
- 21.DeSantis T.Z., Hugenholtz P., Larsen N., Rojas M., Brodie E.L., Keller K. Greengenes, a chimera-checked 16S rRNA gene database and workbench compatible with ARB. Applied and Environmental Microbiology. 2006;72:5069–5072. doi: 10.1128/AEM.03006-05. [DOI] [PMC free article] [PubMed] [Google Scholar]
- 22.Wang Q., Garrity G.M., Tiedje J.M., Cole J.R. Naive Bayesian classifier for rapid assignment of rRNA sequences into the new bacterial taxonomy. Applied and Environmental Microbiology. 2007;73:5261–5267. doi: 10.1128/AEM.00062-07. [DOI] [PMC free article] [PubMed] [Google Scholar]
- 23.Bokulich N.A., Subramanian S., Faith J.J., Gevers D., Gordon J.I., Knight R. Quality-filtering vastly improves diversity estimates from Illumina amplicon sequencing. Nature Methods. 2013;10:57–59. doi: 10.1038/nmeth.2276. [DOI] [PMC free article] [PubMed] [Google Scholar]
- 24.Cole J.R., Wang Q., Fish J.A., Chai B., McGarrell D.M., Sun Y. Ribosomal Database Project: data and tools for high throughput rRNA analysis. Nucleic Acids Research. 2014;42:D633–D642. doi: 10.1093/nar/gkt1244. [DOI] [PMC free article] [PubMed] [Google Scholar]
- 25.Claesson M.J., O'Sullivan O., Wang Q., Nikkila J., Marchesi J.R., Smidt H. Comparative analysis of pyrosequencing and a phylogenetic microarray for exploring microbial community structures in the human distal intestine. PloS One. 2009;4:e6669. doi: 10.1371/journal.pone.0006669. [DOI] [PMC free article] [PubMed] [Google Scholar]
- 26.Segata N., Izard J., Waldron L., Gevers D., Miropolsky L., Garrett W.S. Metagenomic biomarker discovery and explanation. Genome Biology. 2011;12:R60. doi: 10.1186/gb-2011-12-6-r60. [DOI] [PMC free article] [PubMed] [Google Scholar]
- 27.Everard A., Belzer C., Geurts L., Ouwerkerk J.P., Druart C., Bindels L.B. Cross-talk between Akkermansia muciniphila and intestinal epithelium controls diet-induced obesity. Proceedings of the National Academy of Sciences of the United States of America. 2013;110:9066–9071. doi: 10.1073/pnas.1219451110. [DOI] [PMC free article] [PubMed] [Google Scholar]
- 28.Shin N.R., Lee J.C., Lee H.Y., Kim M.S., Whon T.W., Lee M.S. An increase in the Akkermansia spp. population induced by metformin treatment improves glucose homeostasis in diet-induced obese mice. Gut. 2014;63:727–735. doi: 10.1136/gutjnl-2012-303839. [DOI] [PubMed] [Google Scholar]
- 29.Kim M.J., Chung J.Y., Kim J.H., Kwak H.K. Effects of cranberry powder on biomarkers of oxidative stress and glucose control in db/db mice. Nutrition Research and Practice. 2013;7:430–438. doi: 10.4162/nrp.2013.7.6.430. [DOI] [PMC free article] [PubMed] [Google Scholar]
- 30.Larsen T.M., Toubro S., Astrup A. PPARgamma agonists in the treatment of type II diabetes: is increased fatness commensurate with long-term efficacy? International Journal of Obesity and Related Metabolic Disorders. 2003;27:147–161. doi: 10.1038/sj.ijo.802223. [DOI] [PubMed] [Google Scholar]
- 31.Brocker C.N., Yue J., Kim D., Qu A., Bonzo J.A., Gonzalez F.J. Hepatocyte-specific PPARA expression exclusively promotes agonist-induced cell proliferation without influence from nonparenchymal cells. American Journal of Physiology Gastrointestinal and Liver Physiology. 2017;312:G283–G299. doi: 10.1152/ajpgi.00205.2016. [DOI] [PMC free article] [PubMed] [Google Scholar]
- 32.Montagner A., Polizzi A., Fouche E., Ducheix S., Lippi Y., Lasserre F. Liver PPARalpha is crucial for whole-body fatty acid homeostasis and is protective against NAFLD. Gut. 2016;65:1202–1214. doi: 10.1136/gutjnl-2015-310798. [DOI] [PMC free article] [PubMed] [Google Scholar]
- 33.Ahmadian M., Suh J.M., Hah N., Liddle C., Atkins A.R., Downes M. PPARgamma signaling and metabolism: the good, the bad and the future. Nature Medicine. 2013;19:557–566. doi: 10.1038/nm.3159. [DOI] [PMC free article] [PubMed] [Google Scholar]
- 34.Beaven S.W., Wroblewski K., Wang J., Hong C., Bensinger S., Tsukamoto H. Liver X receptor signaling is a determinant of stellate cell activation and susceptibility to fibrotic liver disease. Gastroenterology. 2011;140:1052–1062. doi: 10.1053/j.gastro.2010.11.053. [DOI] [PMC free article] [PubMed] [Google Scholar]
- 35.Ding L., Pang S., Sun Y., Tian Y., Yu L., Dang N. Coordinated actions of FXR and LXR in metabolism: from pathogenesis to pharmacological targets for type 2 diabetes. International Journal of Endocrinology. 2014;2014:751859. doi: 10.1155/2014/751859. [DOI] [PMC free article] [PubMed] [Google Scholar]
- 36.Tanaka N., Aoyama T., Kimura S., Gonzalez F.J. Targeting nuclear receptors for the treatment of fatty liver disease. Pharmacology & Therapeutics. 2017;179:142–157. doi: 10.1016/j.pharmthera.2017.05.011. [DOI] [PMC free article] [PubMed] [Google Scholar]
- 37.Yin W., Carballo-Jane E., McLaren D.G., Mendoza V.H., Gagen K., Geoghagen N.S. Plasma lipid profiling across species for the identification of optimal animal models of human dyslipidemia. The Journal of Lipid Research. 2012;53:51–65. doi: 10.1194/jlr.M019927. [DOI] [PMC free article] [PubMed] [Google Scholar]
- 38.Lelouvier B., Servant F., Paisse S., Brunet A.C., Benyahya S., Serino M. Changes in blood microbiota profiles associated with liver fibrosis in obese patients: a pilot analysis. Hepatology. 2016;64:2015–2027. doi: 10.1002/hep.28829. [DOI] [PubMed] [Google Scholar]
- 39.Dao M.C., Everard A., Aron-Wisnewsky J., Sokolovska N., Prifti E., Verger E.O. Akkermansia muciniphila and improved metabolic health during a dietary intervention in obesity: relationship with gut microbiome richness and ecology. Gut. 2016;65:426–436. doi: 10.1136/gutjnl-2014-308778. [DOI] [PubMed] [Google Scholar]
- 40.Plovier H., Everard A., Druart C., Depommier C., Van Hul M., Geurts L. A purified membrane protein from Akkermansia muciniphila or the pasteurized bacterium improves metabolism in obese and diabetic mice. Nature Medicine. 2017;23:107–113. doi: 10.1038/nm.4236. [DOI] [PubMed] [Google Scholar]
- 41.Ciubotaru I., Green S.J., Kukreja S., Barengolts E. Significant differences in fecal microbiota are associated with various stages of glucose tolerance in African American male veterans. Translational Research : The Journal of Laboratory and Clinical Medicine. 2015;166:401–411. doi: 10.1016/j.trsl.2015.06.015. [DOI] [PMC free article] [PubMed] [Google Scholar]
- 42.de la Cuesta-Zuluaga J., Mueller N.T., Corrales-Agudelo V., Velasquez-Mejia E.P., Carmona J.A., Abad J.M. Metformin is associated with higher relative abundance of mucin-degrading Akkermansia muciniphila and several short-chain fatty acid-producing microbiota in the gut. Diabetes Care. 2017;40:54–62. doi: 10.2337/dc16-1324. [DOI] [PubMed] [Google Scholar]
- 43.Pierre J.F., Heneghan A.F., Feliciano R.P., Shanmuganayagam D., Roenneburg D.A., Krueger C.G. Cranberry proanthocyanidins improve the gut mucous layer morphology and function in mice receiving elemental enteral nutrition. JPEN Journal of Parenteral and Enteral Nutrition. 2013;37:401–409. doi: 10.1177/0148607112463076. [DOI] [PMC free article] [PubMed] [Google Scholar]
- 44.Taira T., Yamaguchi S., Takahashi A., Okazaki Y., Yamaguchi A., Sakaguchi H. Dietary polyphenols increase fecal mucin and immunoglobulin A and ameliorate the disturbance in gut microbiota caused by a high fat diet. Journal of Clinical Biochemistry & Nutrition. 2015;57:212–216. doi: 10.3164/jcbn.15-15. [DOI] [PMC free article] [PubMed] [Google Scholar]
- 45.Anhe F.F., Pilon G., Roy D., Desjardins Y., Levy E., Marette A. Triggering Akkermansia with dietary polyphenols: a new weapon to combat the metabolic syndrome? Gut Microbes. 2016;7:146–153. doi: 10.1080/19490976.2016.1142036. [DOI] [PMC free article] [PubMed] [Google Scholar]
- 46.Cardona F., Andrés-Lacueva C., Tulipani S., Tinahones F.J., Queipo-Ortuño M.I. Benefits of polyphenols on gut microbiota and implications in human health. The Journal of Nutritional Biochemistry. 2013;24:1415–1422. doi: 10.1016/j.jnutbio.2013.05.001. [DOI] [PubMed] [Google Scholar]
- 47.Puupponen-Pimia R., Nohynek L., Hartmann-Schmidlin S., Kahkonen M., Heinonen M., Maatta-Riihinen K. Berry phenolics selectively inhibit the growth of intestinal pathogens. Journal of Applied Microbiology. 2005;98:991–1000. doi: 10.1111/j.1365-2672.2005.02547.x. [DOI] [PubMed] [Google Scholar]
- 48.Ubeda C., Bucci V., Caballero S., Djukovic A., Toussaint N.C., Equinda M. Intestinal microbiota containing Barnesiella species cures vancomycin-resistant Enterococcus faecium colonization. Infection and Immunity. 2013;81:965–973. doi: 10.1128/IAI.01197-12. [DOI] [PMC free article] [PubMed] [Google Scholar]
- 49.Ley R.E., Backhed F., Turnbaugh P., Lozupone C.A., Knight R.D., Gordon J.I. Obesity alters gut microbial ecology. Proceedings of the National Academy of Sciences of the United States of America. 2005;102:11070–11075. doi: 10.1073/pnas.0504978102. [DOI] [PMC free article] [PubMed] [Google Scholar]
- 50.Turnbaugh P.J., Backhed F., Fulton L., Gordon J.I. Diet-induced obesity is linked to marked but reversible alterations in the mouse distal gut microbiome. Cell Host & Microbe. 2008;3:213–223. doi: 10.1016/j.chom.2008.02.015. [DOI] [PMC free article] [PubMed] [Google Scholar]
- 51.Rabot S., Membrez M., Blancher F., Berger B., Moine D., Krause L. High fat diet drives obesity regardless the composition of gut microbiota in mice. Scientific Reports. 2016;6:32484. doi: 10.1038/srep32484. [DOI] [PMC free article] [PubMed] [Google Scholar]
- 52.Reagan-Shaw S., Nihal M., Ahmad N. Dose translation from animal to human studies revisited. The FASEB Journal. 2008;22:659–661. doi: 10.1096/fj.07-9574LSF. [DOI] [PubMed] [Google Scholar]
- 53.Flammer A.J., Martin E.A., Gossl M., Widmer R.J., Lennon R.J., Sexton J.A. Polyphenol-rich cranberry juice has a neutral effect on endothelial function but decreases the fraction of osteocalcin-expressing endothelial progenitor cells. European Journal of Nutrition. 2013;52:289–296. doi: 10.1007/s00394-012-0334-4. [DOI] [PMC free article] [PubMed] [Google Scholar]
- 54.Kuipers F., Bloks V.W., Groen A.K. Beyond intestinal soap–bile acids in metabolic control. Nature Reviews Endocrinology. 2014;10:488–498. doi: 10.1038/nrendo.2014.60. [DOI] [PubMed] [Google Scholar]
- 55.Puri P., Daita K., Joyce A., Mirshahi F., Santhekadur P.K., Cazanave S. The presence and severity of nonalcoholic steatohepatitis is associated with specific changes in circulating bile acids. Hepatology. 2017 doi: 10.1002/hep.29359. [Epub ahead of print] [DOI] [PMC free article] [PubMed] [Google Scholar]
- 56.Liu X., Xue R., Ji L., Zhang X., Wu J., Gu J. Activation of farnesoid X receptor (FXR) protects against fructose-induced liver steatosis via inflammatory inhibition and ADRP reduction. Biochemical and Biophysical Research Communications. 2014;450:117–123. doi: 10.1016/j.bbrc.2014.05.072. [DOI] [PubMed] [Google Scholar]
- 57.Zhang S., Wang J., Liu Q., Harnish D.C. Farnesoid X receptor agonist WAY-362450 attenuates liver inflammation and fibrosis in murine model of non-alcoholic steatohepatitis. Journal of Hepatology. 2009;51:380–388. doi: 10.1016/j.jhep.2009.03.025. [DOI] [PubMed] [Google Scholar]
- 58.Han Y., Haraguchi T., Iwanaga S., Tomotake H., Okazaki Y., Mineo S. Consumption of some polyphenols reduces fecal deoxycholic acid and lithocholic acid, the secondary bile acids of risk factors of colon cancer. Journal of Agricultural and Food Chemistry. 2009;57:8587–8590. doi: 10.1021/jf900393k. [DOI] [PubMed] [Google Scholar]
- 59.Ngamukote S., Makynen K., Thilawech T., Adisakwattana S. Cholesterol-lowering activity of the major polyphenols in grape seed. Molecules. 2011;16:5054–5061. doi: 10.3390/molecules16065054. [DOI] [PMC free article] [PubMed] [Google Scholar]