Abstract
In this paper, we present our system as submitted in the CEGS N-GRID 2016 task 2 RDoC classification competition. The task was to determine symptom severity (0–3) in a domain for a patient based on the text provided in his/her initial psychiatric evaluation. We first preprocessed the psychiatry notes into a semi-structured questionnaire and transformed the short answers into either numerical, binary, or categorical features. We further trained weak Support Vector Regressors (SVR) for each verbose answer and combined regressors’ output with other features to feed into the final gradient tree boosting classifier with resampling of individual notes. Our best submission achieved a macro-averaged Mean Absolute Error of 0.439, which translates to a normalized score of 81.75%.
Keywords: text classification, gradient tree boosting, severity prediction, bootstrap, psychiatric evaluation, nlp
Graphical Abstract
1. Introduction
The psychiatric clinical evaluation is one of the most challenging types of documentation within the field of medicine. Contributing to the difficulty in understanding psychiatric notes is the sometimes haphazard combination of narrative styles and structured styles (i.e. templates or standardized questionnaires). Additionally, in comparison to other medical specialties, psychiatry emphasizes patient-derived subjective communication that may lead to a disorganized psychiatric interview due to conveying the history in a non-linear, superfluous, confusing, and/or redundant manner. Some common surveys employed for psychiatry include questionnaires listing DSM-5 [1] criteria for mental disorders such as generalized anxiety disorder, major depression disorder, attention-deficit/hyperactivity disorder, etc.
An ideal psychiatric note should demonstrate internal consistency — the history, physical examination, assessment, and treatment plan should all support each other. An ideal psychiatric note strives for a firm diagnosis for the patient, utilizing all sources of information available, including laboratory results and other medical consults. An ideal psychiatric note should be as specific as possible, such as using “Major depressive disorder, recurrent, severe, currently in partial remission” versus using a vague description of “Major depressive disorder.” In practice, however, the rarity of such an ideal note makes it difficult for clinicians to interpret and share psychiatric notes. Therefore, efforts to computationally parse and assess psychiatric notes should aid in properly stratifying psychiatric patients in terms of disorder and severity. Severity classification allows for triaging of patients in order to identify those at acute risk so that prompt medical care can be provided. The implications of not having a severity classifier could prove to be costly in terms of morbidity and mortality, as those with moderate to severe illness may be inadvertently delayed treatment. The high prevalence of psychiatric disorders in a given population inevitably leads to some patients with incomplete or missing diagnoses. Advances in clinical natural language processing (cNLP) and machine learning could efficiently help alleviate adverse outcomes by flagging and noting documentation deficiencies. Furthermore, once patients are properly identified and classified by disorder and severity, subsequent data analysis on patient subgroups could be adequately performed in order to discover optimal treatment strategies.
The Research Domain Criteria (RDoC) is a research framework for new ways of studying mental disorders. It focuses on five psychiatric domains — positive valence, negative valence, cognitive, social processes, and arousal and regulatory systems. Track 2 of the 2016 CEGS N-GRID Shared Task in the Clinical Natural Language focuses on one domain: positive valence.[2] The organizers provided a corpus composed of initial psychiatric evaluation records of patients along with a general severity score (0–3) of positive valence domain for each note annotated by expert clinicians. The task was to build a system that can automatically predict an overall positive valence severity score based on the patients’ psychiatric notes.
A straightforward approach to this challenge is to treat it as a traditional text classification task.[3] However, psychiatric evaluation records are significantly different from common text documents. Psychiatric documents typically contain validated surveys that consist of templates with evaluation questions and answers. The answer to the question can vary from very short to a yes/no response, or it can be verbose in describing illness history. The simple “bag of words” model can neither associate questions with the corresponding answers, nor handle different answers appropriately based on its property. Another disadvantage of the traditional text classifier is that the model is a “black box” that takes the input of tens of thousands of features, which is very hard for clinicians to interpret and validate.[4]
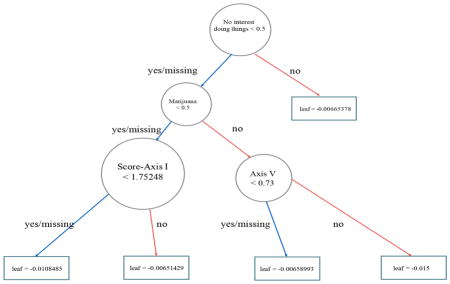
Our approach first carefully preprocessed the note into a structured format before applying classifiers. The questions were normalized into a standard template. The answers were handled in a manner based on the property of the questions. The formatted question-answer pairs were then directly used as feature-value pairs and processed by the final classifier. We specifically applied gradient tree boosting as our classifier because of its success in many recent data mining competitions.[5] The model output are decision trees which are much easier for physicians to interpret and validate. Our method also produced the formatted question-answer pairs as a side product, which can be stored into a structured database and could facilitate future investigation of the evaluation records.
Another distinction of our approach is to use bootstrapping to generate resampling of notes to accommodate the unbalanced and small size of training data. Annotated medical documents are found in much less quantity than other sources of annotated documents. The distribution of labels in the annotated corpus is often biased. Resampling the annotated documents with replacement is a simple yet effective method that can be applied in all related clinical natural language processing tasks.
The rest of the paper is organized as follows. Section 2 introduces related work in previous studies. Section 3 describes details of each step of our system. Section 4 presents the evaluation results and error analysis. Section 5 proposes several potential directions to improve our system. Section 6 concludes the paper.
2. Related work
Many previous works have applied natural language processing techniques to electronic health data to determine symptom severity of psychiatric diseases. Perils et al.[6] trained a logistic regression model to predict the probability of a patient being clinically depressed or not by analyzing words and phrases extracted from medical notes of patients with major depressive disorder. Howes et al.[7] applied topic modeling and sentiment analysis to texts of online therapy for depression. They found that using general features such as the discussion topic and sentiment can predict symptom severity with comparable accuracy to face-to-face data. Gorrell et al.[8] built a system to automatically extract the negative symptoms of schizophrenia from patient medical records. They applied the Support Vector Machine with unigrams and part of speech features and manually engineered rules to classify sentences of medical notes for each of the eleven negative symptoms of schizophrenia. Other than psychiatric diseases, Xia et al.[9] extracted narrative variables on symptoms, signs, and medications from notes using the clinical Text Analytics and Knowledge Extraction System (cTAKES) and mapped the concepts into either SNOMED-CT or RxNorm. They trained a logistic regression model with these variables to identify a cohort of multiple sclerosis (MS) patients.
3. Methods
In this section, we present our approach to symptom severity classification. We will first introduce the CEGS N-GRID 2016 dataset and the official evaluation metric, followed by three major steps of our classification system: (1) pre-processing, (2) feature extraction, and (3) classification using gradient tree boosting with resampling.
3.1. Corpus and evaluation metric
The corpus for this year’s competition contains 1000 de-identified initial psychiatric evaluation records provided by Partners Healthcare and the Neuropsychiatric Genome-Scale and RDoC Individualized Domains (N-GRID) project of Harvard Medical School. Each note describes one patient. Some of these notes have been rated on an ordinal scale of 0–3 (absent to severe) with respect to the patient’s symptom severity in the positive valence RDoC domain by expert clinicians. The distribution of the annotations in the training and test set is described in Table 1.
Table 1.
Distribution of annotations in training/test set
| Training | Test | |
|---|---|---|
|
| ||
| Total | 600 | 400 |
| Annotated with gold labels | 325 | 216 |
| Annotated by only one annotator | 108 | NA |
| Not annotated | 167 | 184 |
We used 325 notes with gold labels in the training set to train our classifiers. Each of these notes was annotated by two expert clinicians. A third expert clinician intervened in case of disagreements and acted as a tie-breaker. The 108 notes in the training set annotated by only one clinician were used as the hold-out data to evaluate our models’ performances before the official test set was released. We did not use the notes lacking annotations in our submission.
In this competition, the submitted results are evaluated against the gold standard using the macro-averaged Mean Absolute Error:
| (1) |
where C is the set of severity scores (0–3), Dj is the collection of records having severity score j, h(xi) and yi are the predicted score and gold standard respectively. Note that this measure gives the same importance to every class, regardless of its relative frequency.[2]
3.2. Pre-processing
We first preprocessed the raw notes into semi-structured question-answer pairs. Two steps of pre-processing are described below.
3.2.1. Text normalization
The text normalization step deals with the issue of concatenated words in this corpus (e.g. treatmentNeeds, husbandAxis). We first separated such strings at the position of the capital letter in the middle of the string. However, this approach cannot handle the erroneously concatenated uppercase abbreviations (e.g. “LSDADHD” should be “LSD ADHD”). For such cases, we constructed a dictionary of common psychiatric abbreviations and parsed the uppercase strings by simple dictionary matching.
3.2.2. Question-answer pair extraction
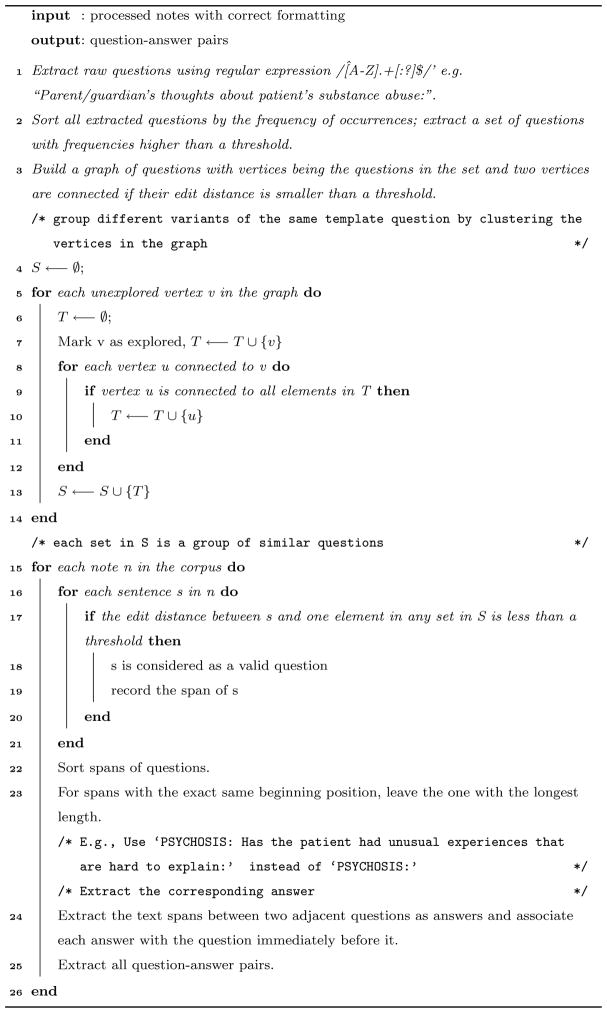
As mentioned above, many items in the psychiatric notes are structured as question-answer pairs. Most questions are template-based, but the wording is not identical across different notes. We iteratively identified and grouped the similar questions from the most frequently encountered ones. The details of this step were described in Algorithm 1. Table 2 shows some example question-answer pairs that were extracted from the raw notes. Note that not all questions were present in every note. We treated the answers to absent questions as missing data in our further analysis.
Table 2.
Examples of structured question-answer pairs after pre-processing
| Note ID | ADHD | Actions taken | ADL Bathing | Affect | … |
|---|---|---|---|---|---|
| 1 | NaN | Continue to monitor… | Independent | WNL | … |
| 2 | NaN | Consider med management… | Independent | Congruent to mood | … |
| 3 | NaN | Medication changes… | Independent | Full | … |
3.3. Feature Extraction
After extracting the question-answer pairs from the psychiatric notes, we treated each question as an individual feature and transformed the answer to the question as the feature value. The answers were each handled differently based on their length and the type of question they were derived from.
Specifically, we processed short answers into either numerical, binary, or categorical features. For answers such as exam results or scores, we treated them as numerical features and directly used their numerical values as the feature input. For yes or no answers, we treated them as binary features. For answers with a limited set of possible outcomes, we treated them as categorical features and applied “one-hot” encoding to translate the categorical information into binary vectors.
Algorithm 1.
We further trained Support Vector Machine regression (SVR) models as weak learners to handle verbose answers. Specifically, we trained one SVR model on a “bag-of-words” representation of each verbose answer to predict the severity score of the document which the answer belongs to. We chose from small C parameters of the SVR model and used only unigrams and bigrams that appear in at least 5% of the training documents to avoid overfitting. The hyperparameters of SVRs were tuned via cross-validations. The prediction scores of each weak SVR were then used as the feature values of each verbose answer with 5-fold stacking. Example question and answer pairs of different types are shown as follows:
-
Numerical
Audit C Score Current: 2
Cups per day: 1 cup of coffee
Pain level (Numeric Scale): 4
-
Binary
Cocaine: No
Marijuana: Yes
Hallucinations: None
-
Categorical
If outpatient treatment recommended please specify modality: Psychodynamic; Couples Therapy; Medication Treatment
Neurovegetative Symptom: sleep; interest; energy; concentration
-
Verbose
History of Present Illness and Precipitating Events: 62 year-old married woman with esophageal adenocarcinoma diagnosed in 2096 on FOLFOX…
Chief Complaint: “I still have a lot of anxiety”
3.4. Classification with gradient tree boosting
In the final step, we trained a gradient tree boosting multi-class classifier using XGBoost[5] with all the features extracted from the previous step. Gradient tree boosting, along with other tree ensemble learning methods, has been widely used in industry and data mining competitions. It is invariant to scaling of inputs and it can learn higher order interaction between features. Different from other tree ensemble methods, the gradient tree boosting is trained in an additive manner. At each time step t, it grows another tree to minimize the residual of the current model. Formally, the objective function can be described as follows:
| (2) |
where l denotes a loss function that measures the difference between the label of the i-th instance yi and the prediction at the last step plus the current tree output; and Ω(ft) is the regularization term that penalizes the complexity of the new tree. XGBoost is one of the most famous implementations of gradient boosting due to its high efficiency and success in various data mining competitions. It also handles missing value by default. Specifically, the algorithm learns the optimal default direction in each tree node from the training data. If the value of a feature is missing, the instance will be classified in the default direction for that feature.[5]
Since the training set only contains 325 notes with gold labels and are highly imbalanced across different severity scores, we experimented with resampling notes with replacement to increase the training data size and balance the number of notes with different scores. We further limited the maximum depth of the decision trees and the minimum child weights, and we added randomness to the training process by sampling features and training instances in each step to avoid overfitting. We used 5-fold cross-validation to tune all of the hyperparameters of our classifiers.
We also trained logistic regression (LR), decision tree (DT), and random forest (RF) multi-class classifiers using the scikit-learn library[10] with the same settings to compare their performances against the gradient tree boosting classifier.
3.5. Handling Missing-data
As mentioned above, not all notes in the corpus consist of the exact same set of questions. The physicians may ask different questions due to personal preference. It is also likely that certain questions do not apply to patients with certain diseases and disorders. We investigated the correlation between the presence of a question and the severity score of a note. Table 3 shows the top five questions with the highest Pearson correlation coefficients.
Table 3.
Top 5 questions with highest correlation coefficients between its presence and the severity score
| Question | Correlation Coefficient |
|---|---|
| How often did you have six or more drinks on one occasion in the past year | 0.20*** |
| How many drinks containing alcohol did you have on a typical day when you were drinking in the past year | 0.20*** |
| Prior medication trials | −0.18*** |
| History of drug use | 0.18*** |
| Hx of military service | −0.15*** |
Note: Significant at the:
0.1%,
1%, or
5% level
We treated answers to absent questions as missing data and experimented with two methods to impute the missing data. The first method was to use the mean value of other instances; the other method was to follow the algorithm designed by Chen et al.[5] to classify the missing value in the default direction of the tree node learned from data.
4. Experiments and results
In this section, we present and discuss the performance of the classifiers, assessed by the 325 notes with gold labels using 5-fold cross-validation.
4.1. Classifier performances
Table 4 summarizes the performance of each classification method averaging ten rounds of 5-fold cross-validation. Note that to make the comparison fair, we applied the mean imputation of missing data in this experiment since not all classifiers or their implementations support optimized-direction imputation. The result demonstrates that the GBT classifier almost consistently outperforms the other three classifiers, except that the LR classifier has better performance with no resampling. It also shows that both ensemble methods (LR and GBT) achieved better performance with larger resampling size, while non-ensemble methods (LR and DT) did not benefit from resampling.
Table 4.
Average MAE of all classifiers with ten rounds of 5-fold cross-validation
| Resample Size | Classifier | |||
|---|---|---|---|---|
|
| ||||
| LR | DT | RF | GBT | |
| 0 | 0.552*** | 0.644 | 0.613 | 0.605 |
| 250 | 0.602 | 0.737 | 0.629 | 0.548** |
| 500 | 0.593 | 0.696 | 0.582 | 0.542*** |
| 1000 | 0.605 | 0.686 | 0.568 | 0.509*** |
| 2000 | 0.666 | 0.705 | 0.566 | 0.504*** |
Note: Significant at the:
0.1%,
1%, or
5% level
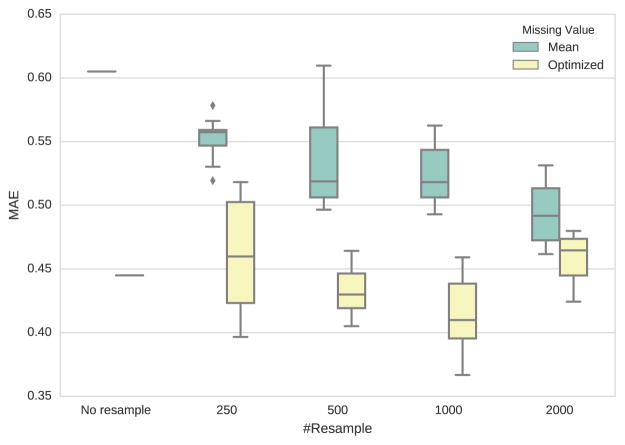
Figure 1 shows the MAEs of different missing-data imputation and resampling strategies. We reported the average performance of ten runs of each setting. It shows that using the optimal direction imputation learned from training data consistently outperforms mean imputation. Resampling notes of each score 1000 times yields the lowest mean MAE.
Figure 1.
Box plot of Mean Average Error for different strategies of resampling and missing-data imputation
4.2. Feature analysis
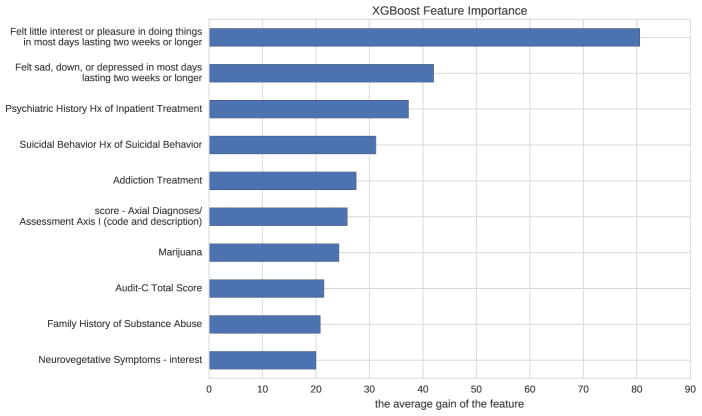
Figure 2 shows the most important features of the best model based on the average gain of each feature when it was used in a tree. The feature names beginning with “score-” are the scores predicted by SVRs from verbose answers. It shows that the patients’ interest in doing things, presence of depression, and history of inpatient treatment are the top three most important features to determine the patients’ severity score of positive valence domain based on our model.
Figure 2.
The relative importance of features based on how many times each feature is split on
We further investigated the contribution of the verbose-answer features of the SVR-predicted scores. Table 5 demonstrates that adding SVR-predicted score features significantly increased our classifiers’ performances. We also listed the answers with the highest and lowest predicted scores to some verbose questions below. Note that absent answers were, by default, considered as missing data and therefore had no predicted scores.
Table 5.
Average MAE of GBT with or without verbose-answer features with ten rounds of 5-fold cross-validation
| Resample Size | Features | |
|---|---|---|
|
| ||
| Short-answer features | Short-answer + verbose-answer features | |
| 0 | 0.617 | 0.445*** |
| 250 | 0.514 | 0.461** |
| 500 | 0.548 | 0.432*** |
| 1000 | 0.539 | 0.415*** |
| 2000 | 0.549 | 0.460*** |
Note: Significant at the:
0.1%,
1%, or
5% level
-
Axial Diagnoses/Assessment Axis I (code and description)
Highest: “Alcohol dependence Substance Related Disorders 303.90 Alcohol Dependence”
Lowest: “309.24”
-
Modifiable risk factors
Highest: “opiate user, other substance use, anxiety, lives away from familial support”
Lowest: “mood, pain”
-
Longitudinal Alcohol use History
Highest: “First use: College Heaviest Use: 2077 prior to deployment, reported drinking 3 to 4 times per week, 4–5 drinks. Denied any problematic drinking behaviors.”
Lowest: 0 no hx of problems
-
Family History of Psychiatric Illness/Hospitalization
Highest: “Mother Bipolar Sister ? diagnosis Father - paranoid schizophrenic”
Lowest: “mother: depression”
4.3. Error analysis
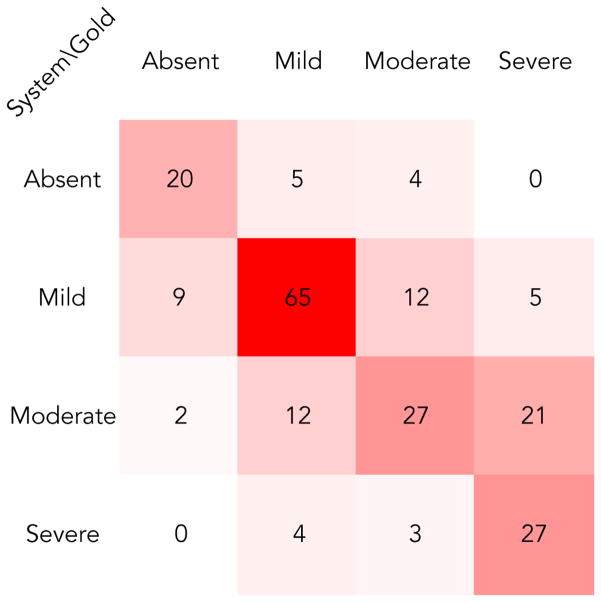
Our best submission yielded a macro-averaged Mean Absolute Error of 0.439 on the test set. Figure 3 shows the confusion matrix of our best submission. Most misclassifications were between mild/moderate and moderate/severe classes. Since annotators of expert clinicians also disagreed most among these classes[2], it seems hard to distinguish them solely based on psychiatric notes. Also, our system made the most errors within the moderate class, which happens to be the one that varied the most between the training and test set with respect to the frequency distribution among all classes.
Figure 3.
Confusion matrix of the best submission
5. Future work
There are several ways that we believe could improve our approach’s performance. First, our approach treats the severity score prediction task as a multi-class classification problem. Implementing a learning algorithm which can directly optimize MAE may improve our results. In addition, our weak SVR regressors of verbose answers only used simple unigram and bigram features. Since clinical terms can be expressed in very different ways, using features such as word embeddings or UMLS concepts may yield better results. Finally, feedback from clinical psychiatrists can help us design and select more powerful features.
6. Conclusion
Prediction of symptom severity using information in ill-formatted psychiatric notes is a novel and challenging task to the clinical NLP community. Our results showed that with careful pre-processing of the note and machine learning techniques, we were able to build an interpretable model and make accurate predictions which could estimate risk for adverse outcomes among psychiatric disorders and subsequently alert and help physicians decide the best course of treatment.
Highlights.
Preprocessing psychiatric notes into semi-structured question-answer pairs leads to better representation of the unstructured survey documents.
Training weak regressors and using predicted values as input of the final classifier is an effective way of handling verbose answers in the psychiatric notes.
Using gradient tree boosting with resampling can accurately predict patients’ severity in the positive valence domain base on their initial psychiatric evaluation.
Acknowledgments
We thank the participants of the 2016 CEGS N-GRID Workshop for helpful discussion. The CEGS N-GRID 2016 Shared Task in Clinical Natural Language Processing was supported by NIH P50 MH106933 (PI: Isaac Kohane) and NIH 4R13LM011311 (PI: Ozlem Uzuner).
Footnotes
Publisher's Disclaimer: This is a PDF file of an unedited manuscript that has been accepted for publication. As a service to our customers we are providing this early version of the manuscript. The manuscript will undergo copyediting, typesetting, and review of the resulting proof before it is published in its final citable form. Please note that during the production process errors may be discovered which could affect the content, and all legal disclaimers that apply to the journal pertain.
References
- 1.American Psychiatric Association. Diagnostic and Statistical Manual of Mental Disorders. 5. 2013. [Google Scholar]
- 2.Filannino M, Stubbs A, Uzuner Ö. Symptom severity prediction from neuropsychiatric clinical records: Overview of 2016 CEGS N-GRID Shared Tasks Track 2. Journal of Biomedical Informatics. doi: 10.1016/j.jbi.2017.04.017. [DOI] [PMC free article] [PubMed] [Google Scholar]
- 3.Yetisgen-Yildiz M, Pratt W. The effect of feature representation on med-line document classification. AMIA; 2005. [PMC free article] [PubMed] [Google Scholar]
- 4.Barakat N, Bradley AP. Rule extraction from support vector machines: Measuring the explanation capability using the area under the roc curve, in: Pattern Recognition, 2006. ICPR 2006. 18th International Conference on; IEEE; 2006. pp. 812–815. [Google Scholar]
- 5.Chen T, Guestrin C. XGBoost: A scalable tree boosting system. Proceedings of the 22Nd ACM SIGKDD International Conference on Knowledge Discovery and Data Mining, KDD ′16; ACM; pp. 785–794. http://doi.acm.org/10.1145/2939672.2939785. [DOI] [Google Scholar]
- 6.Perlis RH, Iosifescu DV, Castro VM, Murphy SN, Gainer VS, Minnier J, Cai T, Goryachev S, Zeng Q, Gallagher PJ, Fava M, Weilburg JB, Churchill SE, Kohane IS, Smoller JW. Using electronic medical records to enable large-scale studies in psychiatry: treatment resistant depression as a model. 42(1):41–50. doi: 10.1017/S0033291711000997. [DOI] [PMC free article] [PubMed] [Google Scholar]
- 7.Howes C, Purver M, McCabe R. Linguistic indicators of severity and progress in online text-based therapy for depression. Proceedings of the Workshop on Computational Linguistics and Clinical Psychology: From Linguistic Signal to Clinical Reality, Association for Computational Linguistics; pp. 7–16. http://www.aclweb.org/anthology/W14-3202. [Google Scholar]
- 8.Gorrell G, Jackson R, Roberts A, Stewart R. Finding negative symptoms of schizophrenia in patient records. Proceedings of the Workshop on NLP for Medicine and Biology associated with RANLP; 2013; INCOMA Ltd; pp. 9–17. [Google Scholar]
- 9.Xia Z, Secor E, Chibnik LB, Bove RM, Cheng S, Chitnis T, Cagan A, Gainer VS, Chen PJ, Liao KP, Shaw SY, Ananthakrishnan AN, Szolovits P, Weiner HL, Karlson EW, Murphy SN, Savova GK, Cai T, Churchill SE, Plenge RM, Kohane IS, De Jager PL. Modeling disease severity in multiple sclerosis using electronic health records. 8(11):1–9. doi: 10.1371/journal.pone.0078927. http://dx.doi.org/10.1371%2Fjournal.pone.0078927. [DOI] [PMC free article] [PubMed] [Google Scholar]
- 10.Pedregosa F, Varoquaux G, Gramfort A, Michel V, Thirion B, Grisel O, Blondel M, Prettenhofer P, Weiss R, Dubourg V, et al. Scikit-learn: Machine learning in python. Journal of Machine Learning Research. 2011;12(Oct):2825–2830. [Google Scholar]


