

Abstract
Fragile X syndrome (FXS) is a neurodevelopmental disorder that is a leading cause of inherited intellectual disability, and the most common known cause of autism spectrum disorder. FXS is broadly characterized by sensory hypersensitivity and several developmental alterations in synaptic and circuit function have been uncovered in the sensory cortex of the mouse model of FXS (Fmr1 KO). GABA-mediated neurotransmission and fast-spiking (FS) GABAergic interneurons are central to cortical circuit development in the neonate. Here we demonstrate that there is a delay in the maturation of the intrinsic properties of FS interneurons in the sensory cortex, and a deficit in the formation of excitatory synaptic inputs on to these neurons in neonatal Fmr1 KO mice. Both these delays in neuronal and synaptic maturation were rectified by chronic administration of a TrkB receptor agonist. These results demonstrate that the maturation of the GABAergic circuit in the sensory cortex is altered during a critical developmental period due in part to a perturbation in BDNF-TrkB signaling, and could contribute to the alterations in cortical development underlying the sensory pathophysiology of FXS.
SIGNIFICANCE STATEMENT Fragile X (FXS) individuals have a range of sensory related phenotypes, and there is growing evidence of alterations in neuronal circuits in the sensory cortex of the mouse model of FXS (Fmr1 KO). GABAergic interneurons are central to the correct formation of circuits during cortical critical periods. Here we demonstrate a delay in the maturation of the properties and synaptic connectivity of interneurons in Fmr1 KO mice during a critical period of cortical development. The delays both in cellular and synaptic maturation were rectified by administration of a TrkB receptor agonist, suggesting reduced BDNF-TrkB signaling as a contributing factor. These results provide evidence that the function of fast-spiking interneurons is disrupted due to a deficiency in neurotrophin signaling during early development in FXS.
Keywords: critical period, fast-spiking interneuron, fragile X syndrome, somatosensory cortex, synapse, TrkB
Introduction
Fragile X syndrome (FXS) is a neurodevelopmental disorder resulting from the transcriptional silencing of FMR1 gene that codes for the negative translational regulator FMRP (Richter et al., 2015). FXS causes intellectual disabilities and a range of behavioral and cognitive challenges, in addition to sensory hypersensitivity (Miller et al., 1999; Castren et al., 2003). Studies in the Fmr1 KO mouse have demonstrated that there is cortical network hyperexcitability (Contractor et al., 2015), and sensory responses in the cortex to both auditory (Rotschafer and Razak, 2013) and tactile stimuli (Arnett et al., 2014; Zhang et al., 2014) are exaggerated and do not show adaptation upon repetitive stimuli (He et al., 2017).
Several studies have demonstrated that there are disruptions in synapses (Harlow et al., 2010) and spines (Nimchinsky et al., 2001; Cruz-Martín et al., 2010) of principal cortical neurons early in development in the primary somatosensory cortex (S1 or barrel cortex) of Fmr1 KO mice. These disruptions coincide with a “critical period” when excitatory synapses in the barrel cortex can undergo plasticity when the NMDA receptor content of synapses is high and the number of silent NMDA-only synapses is elevated (Crair and Malenka, 1995). At the close of this window the synapses are no longer highly plastic and remapping of the somatotopic patterning of thalamic afferents in response to perturbations to the periphery is no longer observed (Schlaggar et al., 1993).
The critical period is a time window in which neuronal circuits are precisely refined, largely depending on environmental stimuli (Wiesel and Hubel, 1963; Hubel and Wiesel, 1970; Hensch, 2005). In rodents, the first few weeks after birth serve as a critical period in sensory regions (Hensch, 2004). In fragile X mice, the window for critical period plasticity is shifted (Harlow et al., 2010) and there are delays in the stabilization of spines (Cruz-Martín et al., 2010). The mechanisms that control critical period timing in the somatosensory cortex are not fully described, but in the visual cortex GABA neurotransmission plays a central role (Hensch, 2005). Recent studies have demonstrated that the maturation of GABA signaling onto principal neurons in the cortex of Fmr1 KO mice is disrupted (He et al., 2014). However, it remains unclear whether, during the critical period, there are any alterations in the development of GABAergic interneurons that provide feedforward inhibition in the sensory cortex.
Among the diverse population of cortical GABAergic interneurons (Markram et al., 2004), the fast-spiking (FS) interneurons have been primarily implicated in regulating critical period timing (Hensch, 2005). These perisomatic targeting large basket cells are characterized by the expression of calcium binding protein parvalbumin (PV), and have nonadapting, high-frequency firing patterns prompting their nomenclature as FS (Kawaguchi and Kubota, 1993; Cauli et al., 1997). The FS interneurons' functional properties, including their nonadapting spiking, develop over the course of the critical period as the interneurons mature and integrate into the local microcircuit in the cortex (Itami et al., 2007).
FS interneuron disruptions have been described in several mouse models of neurodevelopmental disorders including FXS (Gogolla et al., 2009). In adult Fmr1 KO mice there is a significant reduction in PV staining in the somatosensory cortex (Selby et al., 2007). In addition, intracortical excitatory input to FS interneurons is reduced and individual connections are weaker due to a reduction in presynaptic glutamate release probability in juvenile Fmr1 KO mice (Gibson et al., 2008; Patel et al., 2013). However, it remains unknown whether, and how, the functional properties of FS interneurons are altered in FXS during critical period development, a time when they influence the establishment of proper sensory circuits.
Here we provide evidence that the maturation of FS interneurons is delayed in the somatosensory cortex of Fmr1 KO mice. Measuring the functional and morphological properties of FS interneurons during the critical period, we found there was a delay in several markers of maturity including the development of nonadaptive spiking. The formation of excitatory synaptic input on to FS interneurons was also delayed in Fmr1 KO mice suggesting that their integration into the feedforward inhibitory cortical circuit will be altered during critical period development. Both the altered maturation of intrinsic properties and the deficit in synapses were corrected by a TrkB receptor agonist LM22A-4. These results demonstrate that alterations in FS interneuron development, because of impaired TrkB signaling, are a prominent disruption in the neonatal cortex of Fmr1 KO mice.
Materials and Methods
Animals.
All procedures related to the care and treatment of animals were in accordance with the policy of Northwestern University IACUC. Female Fmr1 KO mice (C57bl/6) were crossed with GAD67-EGFP mice [G42 lineTg(Gad1-EGFP)G42Zjh, The Jackson Laboratory], which specifically express GFP in PV-positive large basket cells (FS interneurons; Chattopadhyaya et al., 2004). Male offspring that were positive for GFP fluorescence were used for experiments. Experiments were conducted and data analyzed with the experimenter blind to the genotype, followed by post hoc PCR genotyping of DNA isolated from tail biopsies.
Immunostaining.
Immunostaining for GFP and PV was performed on sections from GAD67-EGFP mice (P5 and P15). Mice were decapitated and the brains were quickly placed in PBS containing 4% PFA and kept at 4°C for overnight. Thalamocortical sections were prepared on a Leica Vibratome and were treated with blocking solutions containing 5% normal goat serum, 5% normal donkey serum, and 1% Triton X-100 in PBS for 60 min at room temperature (RT). Samples were then incubated overnight in PBS at 4°C with chicken anti-GFP (Abcam; 1:10,000) and rabbit anti-PV (ThermoFisher Scientific; 1:2000). Sections were washed in PBS and incubated with AlexaFluor Green 488-conjugated goat anti-chicken and AlexaFluro Red 555-conjugated donkey anti-rabbit secondary IgG (1:1000) for 90 min at RT. Sections were washed in PBS, transferred onto glass slides, and covered by Vectashield mounting medium containing DAPI. Images were taken using a Nikon confocal microscope.
Electrophysiology.
Thalamocortical slices (400 μm thick) were prepared as described previously (Agmon and Connors, 1991; Harlow et al., 2010) from male P5–P25 Fmr1 KO; GAD67-EGFP mice and their male Fmr1 WT; GAD67-EGFP littermate controls. Briefly, sections were prepared using a Leica Vibratome in ice-cold sucrose-slicing artificial CSF (ACSF) containing the following (in mm): 85 NaCl, 2.5 KCl, 1.25 NaH2PO4, 25 NaHCO3, 25 glucose, 75 sucrose, 0.5 CaCl2, and 4 MgCl2, equilibrated with 95% O2 and 5% CO2 and including 10 μm dl-APV and 100 μm kynurenate. Slices were incubated in a recovery chamber containing the same sucrose ACSF for ∼30 min at 30°C, then the sucrose solution was gradually exchanged for a recovery ACSF containing the following (in mm): 125 NaCl, 2.4 KCl, 1.2 Na2PO4, 25 NaHCO3, 25 glucose, 1 CaCl2, and 2 MgCl2. Slices were transferred to a recording chamber after a recovery period of at least 1.5 h, and visualized using Dodt contrast optics. During recordings, slices were continuously perfused with normal ACSF containing the following (in mm): 125 NaCl, 2.4 KCl, 1.2 Na2PO4, 25 NaHCO3, 25 glucose, 2 CaCl2, and 1 MgCl2. The barrel cortex was visually identified, and recordings were made from GFP-expressing neurons within layer IV of the somatosensory cortex. Recording electrodes were manufactured from borosilicate glass pipettes and had tip resistances of 3–5 MΩ when filled with internal recording solution containing the following (in mm): 125 KCH3SO4, 5 KCl, 5 NaCl, 0.02 EGTA, 11 HEPES, 1 MgCl2, 10 phosphocreatine, 4 Mg-ATP, and 0.3 Na-GTP. Data were collected and analyzed using pClamp 10 software (Molecular Devices). Membrane capacitance and input resistance were determined by passing hyperpolarizing current pulses (−20 mV with 400 ms duration). Spike trains were evoked by a 500 ms square-step depolarizing current injection at low-frequency (0.05 Hz) or a 2 ms duration step depolarization given at 50 Hz during a 5 s train. Spike adaptation ratio (SAR) was measured for the 500 ms spike trains by dividing the first interspike interval (ISI) by the average of the last three ISIs. For each recording, incremental current injection was applied until the maximum firing frequency was achieved and SARs were calculated in each spike train in the series. The maximum SAR value measured for each cell was used as the quantified measure of SAR for each recording. ISIs were analyzed using MiniAnalysis software (Synaptosoft). For the 5 s (50 Hz) trains, action potential (AP) firing probability was analyzed for each 1 s bin. Resting membrane potential for each cell was measured immediately after formation of the whole-cell recording configuration. Action potential threshold was defined as the membrane potential at which the first derivative of the voltage (dV/dt; V and t represent voltage and time, respectively) showed an upward inflection. Hyperpolarization activated cation current (Ih) was measured as the voltage sag to a 500 ms hyperpolarizing current injection (from 0 to −200 pA in −20 pA increments). Neurons were voltage-clamped at −70 mV for the recordings of sEPSCs and mEPSCs, which were isolated by inclusion of picrotoxin (PTX; 50 μm) or for mEPSCs PTX and tetrodotoxin (TTX; 1 μm) in the ACSF. sEPSCs and mEPSCs were analyzed using MiniAnalysis software. For evoked EPSCs, a monopolar glass electrode filled with ACSF was positioned ∼100 μm lateral to the recorded FS interneuron within layer IV. The current stimulation intensity was gradually increased (0–100 μA or 0–60 μA in 10 μA increments for P9–P10 and P20–P22 cells, respectively) and input–output (I/O) relationship for the EPSC amplitude was examined. In evoked EPSC recording from adult cells (P20–P22), inclusion of PTX caused burst synaptic activity that contaminated the monosynaptic EPSCs. To prevent this, we recorded evoked EPSCs without PTX in the extracellular solution in recordings from adult mouse slices. At recording voltage close to the reversal potential for GABAA currents (−70 mV), we confirmed >90% (91.8 ± 1.8%, n = 7) of the current was blocked by the AMPA/kainate receptor blocker CNQX. Series resistance (Rs) was continuously monitored during recordings and data were discarded when Rs showed >20% change.
Morphological analysis.
Two-photon laser scanning microscopy (2PLSM) images of PV-positive FS interneurons in the barrel cortex were visualized using methods similar to those previously described (Day et al., 2006). Fluorescent images were acquired with femtosecond pulsed excitation at 790 nm (Mira 900P with a Verdi 10W pump, Coherent Laser). Laser power was modulated with an M350 (KD*P) series Pockels cells (ConOptics). A Prairie Ultima (Bruker Nano, Fluorescence Microscopy Unit) scan head on an Olympus BX-61 upright microscope was used for imaging the slice with two Hamamatsu R3982 side on photomultiplier tubes. All components were controlled and coordinated using PrairieView 9.0 software. Cells were filled with AlexaFluor 568 (50 μm) through the patch pipette. The dye was allowed to diffuse intracellularly for at least 20 min before imaging. Maximum projection images of the soma and dendritic field were acquired with 0.19 μm2 pixels with 15.2 μs pixel dwell time and consisted of ∼50–80 images taken at 2 μm focal steps. Dendritic morphology was quantified using three-dimensional reconstructions in NeuronStudio software (CNIC, Mount Sinai School of Medicine, New York).
ELISA assay.
Somatosensory cortices were visually identified and dissected. Brain tissue was homogenized in RIPA lysis buffer containing the following: 10 mm Tris, pH 7.2, 150 mm NaCl, 1% deoxycholate, 1% Triton X-100, 0.1% SDS, and 5 mm EDTA mixed with a protease inhibitor cocktail (Sigma-Aldrich), followed by centrifugation at 10,000 × g for 30 min. The supernatants were subjected to ELISA assay using total BDNF Quantikine ELISA kit (R&D systems) to determine BDNF expression. The calculated protein concentrations measured by the sample absorbance and the standard curves were normalized to total protein concentration of each sample determined by a BCA assay.
Immunoblot analysis.
Samples were prepared in same way as for the ELISA assay. The supernatants containing 10 μg proteins were mixed with 4× Laemmli sample buffer (Bio-Rad) containing 5% β-mercaptoethanol. Samples were boiled at 95°C for 10–30 min, and then subjected to separation using SDS PAGE. Proteins were transferred to Immun-Blot PVDF Membrane (Bio-Rad). Membranes were then blocked in 5% nonfat dry milk in Tris-buffered saline (TBS) and 0.1% Tween 20 (TBST; Sigma-Aldrich) for 1 h at RT, then incubated in primary antibody (TrkB, BD Biosciences; 1:1000; phospho-TrkB-Y515, Abcam; 1:1000). Membranes were washed in TBST for 10 min three times, and then treated with HRP-conjugated secondary antibody (Jackson ImmunoResearch; 1:10,000) for 1 h. Signals were developed using enhanced chemiluminescence (Luminata Forte, EMD Millipore) and quantified using Image Lab software (Bio-Rad). Immunosignals were normalized to the intensity of β-tubulin.
Array tomography.
Recorded neurons in slices were labeled with AlexaFluor 488 streptavidin (Life Technologies), 1:200 dilution, and processed as previously described (Neuman et al., 2015). Slices containing brightly fluorescent interneurons were microwave processed and embedded in LR White resin (Electron Microscopy Sciences). Arrays of 200–350 serial sections at a thickness of 70 nm were collected and mounted on carbon-coated silanized, high-precision coverslips (Aratome). Arrays were blocked for 15 min with 0.1% BSA-c and 0.05% Tween in TBS. Primary antibody incubation was at 4°C overnight (PSD-95, Cell Signaling Technology; 1:200; synaptophysin, Abcam; 1:50). Incubation in secondary was for 30 min (AlexaFluor 594 donkey anti-rabbit; AlexaFluor 647 donkey anti-mouse IgG, 1:150 in 0.1% BSA-c, 0.05% Tween in TBS). Arrays were stained with 0.1 μm DAPI solution for 15 min, rinsed with TBS, and mounted onto a slide with Slowfade Diamond Antifade reagent (Life Technologies). Arrays were visualized with a Zeiss Axio Imager M2 imaging system with an Axiocam MRm digital camera and AxioVision software (Carl Zeiss). A position list for the regions containing the recorded neuron was created with MosaicPlanner (Forrest Collman) at 10× magnification. One by two mosaics of the same location were acquired with a 63×/1.4 NA Plan Apochromat oil-immersion objective. Images were registered using AT plugins for Fiji provided by the Stephen Smith laboratory at Stanford University. 2D deconvolution was performed in AxioVision software and analyzed with Imaris (Bitplane). Only areas with overlap of GFP and PSD-95 on consecutive serial sections which lay within 100 nm of synaptophysin were considered putative synapses on the recorded neuron.
Data analysis.
Statistical analyses were done using Microsoft Excel, GraphPad Prism, and Origin Pro 9.0 software. Comparisons were made with an unpaired two-tailed Student's t test for two samples, if not indicated otherwise. For multiple comparisons, unrepeated one-way or repeated two-way ANOVA followed by post hoc Bonferroni's correction was used. Differences were defined significant when p < 0.05. Data are presented as mean ± SEM.
Results
Characterization of FS neurons in Fmr1; GAD67-EGFP mice
Using Fmr1; GAD67-EGFP mice (see Materials and Methods) to make targeted recordings from fluorescent cells in layer IV of the somatosensory cortex (Fig. 1A), we confirmed that GFP-expressing neurons displayed a distinct firing pattern from that of GFP-negative cells that was characterized by a relatively large and sharp fast afterhyperpolarization (AHP; fAHP amplitude: GFP-negative: 5.38 ± 0.46 mV, n = 7 cells from 3 mice; GFP-positive: 12.66 ± 1.27 mV, n = 7 cells from 3 mice at P9, p < 0.001; fAHP decay tau: GFP-negative: 226.5 ± 22.5 ms, n = 7 cells from 3 mice; GFP-positive: 68.7 ± 38.5 ms, n = 7 cells from 3 mice at P9, p < 0.001) and lower input resistance (GFP-negative: 505.4 ± 52.1 MΩ, n = 7 from 3 mice; GFP-positive: 267.7 ± 32.1 MΩ, n = 41 cells 9 mice at P9, p = 0.0025; Fig. 1A). These features are consistent with the functional characteristics of FS interneurons (Itami et al., 2007). Importantly, there was a marked increase in ISIs and a marked reduction in AP frequency during the train in the GFP-negative neurons, which was not observed in GFP-positive neurons (Fig. 1A). The gradual increase in ISIs and reduction in firing frequency is called “spike adaptation” or “spike accommodation”. One of the most characteristic features of FS neurons is that they lack spike adaptation (McCormick et al., 1985; Kawaguchi and Kubota, 1997). Coimmunostaining for GFP and PV confirmed GFP was expressed in PV-positive neurons, consistent with previous reports (Chattopadhyaya et al., 2004; Fig. 1B). Furthermore, we found that GFP and PV were both expressed in FS neurons as early as P5 (data not shown), the youngest age we used for the electrophysiology experiments in this study. These results confirm that GFP specifically labels FS interneurons in this mouse line.
Figure 1.
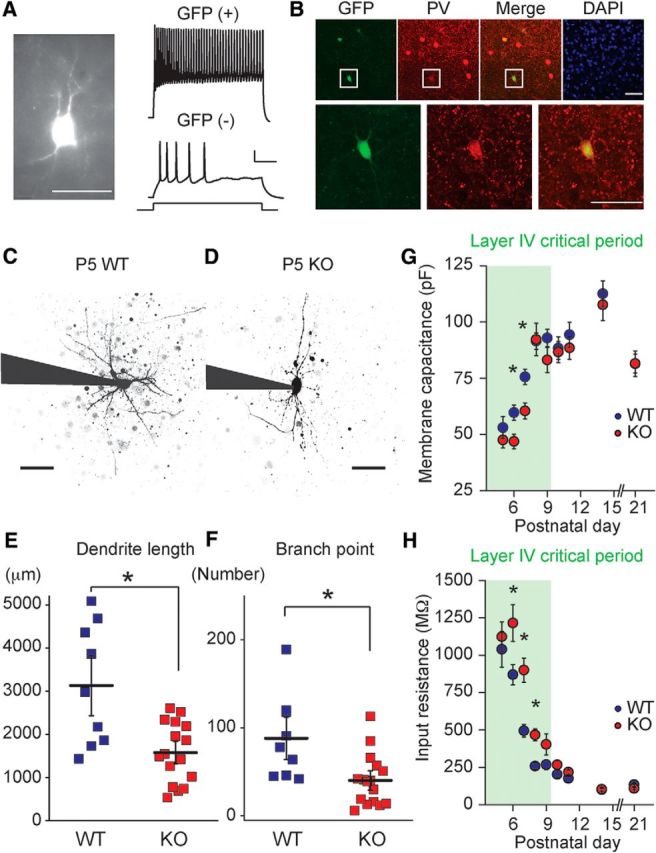
Immature dendritic morphology and delay in maturation of membrane properties in FS neurons of Fmr1 KO mice. A, Targeted recordings from GFP-expressing FS interneurons in P9 Fmr1; GAD67-EGFP mice. Representative GFP-positive cell (left) and AP trains recorded from GFP-positive (right, top) and GFP-negative (right, bottom) neurons in response to 100 pA (500 ms) current injection. Scale bars: Left, 50 μm; Right, 100 ms and 25 mV. B, Coimmunostaining for GFP (green) and PV (red) in layer IV of the primary somatosensory cortex. Magnified images of highlighted cell are shown in the bottom panels. GFP is expressed specifically in PV-positive large basket cells in Fmr1; GAD67-EGFP mice (P15). Scale bars: 50 μm. C, D, Representative 2PLSM images of FS neurons in P5 Fmr1 WT and KO mice. Recording electrodes are outlined in black. Scale bars, 100 μm. E, Grouped data for the total dendrite length and (F) the number of branch points. Dendrite length and branch point number are smaller in Fmr1 KO mice. *p < 0.05. G, Grouped data for Cm and (H) Rin recorded at each postnatal day starting at P5. Somatosensory layer IV critical period is highlighted. Cm is smaller at P6 and P7, whereas Rin remains higher from P6 to P8 in Fmr1 KO mice; n = 20–41 recordings from 3–8 mice. *p < 0.05.
FS neurons have immature dendritic morphology in Fmr1 KO mice during the critical period
To examine dendritic maturation of cortical FS neurons during the critical period we filled individual GFP-positive cells with AlexaFluor 568 through a patch electrode and generated maximum projection images of the soma and dendritic field using 2PLSM. Total dendritic length, the number of branch points, and the number of primary dendrites were examined as markers for morphological maturation. The average total dendritic length in P5-P6 Fmr1 KO mice was significantly lower compared with the dendritic length of FS neurons in WT mice (WT: 3129.9 ± 466.8 μm, n = 9 cell from 4 mice; KO: 1577.2 ± 174.4 μm, n = 16 cells from 5 mice, p = 0.011; Fig. 1C–E). The complexity of dendrites was also reduced in Fmr1 KO mice at this age as quantified by the number of branch points (WT: 88.1 ± 16.0, n = 9 cells from 4 mice; KO: 40.3 ± 7.3, n = 16 cells from 5 mice, p = 0.020; Fig. 1C,D,F). In line with reduced dendritic complexity there was also a significant reduction in the number of primary dendrites in Fmr1 KO mice (WT: 9.2 ± 1.0, n = 9 cells from 4 mice; KO: 6.8 ± 0.4, n = 16 cells from 5 mice, p = 0.037). Examination of FS interneuron morphology in older mice at the end of the critical period window in layer IV (P9–P10; Crair and Malenka, 1995) demonstrated that at these ages there were no detectable differences in neuronal morphology. At P9–P10, the dendritic length was 5173.6 ± 659.1 μm in WT mice and 4036.2 ± 693.1 μm in KO mice (p = 0.25). The number of branch points was 125.5 ± 19.5 in WT mice and 85.7 ± 19.9 in KO mice (p = 0.17; n = 13 and 9 cells from 8 and 5 WT and KO mice, respectively). Therefore, FS interneurons in S1 cortex of neonatal Fmr1 KO mice exhibit immature dendritic morphological parameters that are not present at the close of the critical period in the barrel cortex.
Maturation of intrinsic membrane properties is delayed in neonatal Fmr1 KO mice
FS interneurons undergo functional refinement in parallel with morphological maturation during early postnatal development. There are well defined changes in the membrane properties of neurons as they mature, and these have a profound effect on their ability to contribute to the local circuit (Daw et al., 2007; Itami et al., 2007). To determine whether there is an alteration in functional maturation of FS interneurons in Fmr1 KO mice, we examined intrinsic membrane properties of neurons on each postnatal day starting at P5 and spanning the close of the cortical critical period. As has been demonstrated previously the membrane capacitance (Cm) of FS interneurons increases, whereas the input resistance (Rin) decreases over this time (Daw et al., 2007; Itami et al., 2007), presumably reflecting dendritic growth and changes in expression of a diverse set of ion channels during development. Comparing the development of Cm in Fmr1 KO and WT neonates, we found that there was a significantly lower Cm in Fmr1 KO mice during the critical period at P6–P7, whereas at later time points Cm was identical in both genotypes (Fig. 1G). Measurement of Rin in the same neurons demonstrated that FS interneurons in Fmr1 KO mice had significantly higher Rin than recorded cells in WT mice at most postnatal days during the critical period, but again no difference was observed after critical period closure (Fig. 1H). Therefore, there is a delay in the development of the intrinsic membrane properties of FS interneurons in layer IV of S1 that parallels the immature morphology of these cells during the critical period. Similar to other cellular phenotypes during critical period development described in Fmr1 KO (Harlow et al., 2010), these differences are not observed after closure of the critical period, suggesting a delay that is specific to early neonatal cortical development.
Development of nonadapting FS properties of PV interneurons in Fmr1 KO mice
The nonadapting firing pattern of FS interneurons develops over several postnatal days during the course of the critical period (Itami et al., 2007). To determine whether this characteristic refinement of the spiking pattern was normal in the cortex of Fmr1 KO mice, we made recordings from labeled neurons at postnatal days spanning the critical period and measured the SAR of the elicited APs. SAR is the ratio of the initial spike frequency (first two APs) to the final spike frequency (average of the last three ISIs) during an AP train (Itami et al., 2007). A higher SAR indicates that there is less adaptation during the AP train, and is a reflection of a mature spiking pattern for FS interneurons. Representing functional maturation of FS interneurons, SAR increased between P5 and P10 in both Fmr1 WT and KO mice. However, SAR in the KO mice was significantly lower at all ages during the critical period, indicating a delay in the maturation of the spiking properties of FS interneurons (Fig. 2A–D). There was no difference in SAR between the genotypes after the end of the critical period (P11 and beyond; n = 22 and 25 cells from 3 and 4 mice in WT and KO at P11, respectively; p = 0.44) again demonstrating that the prominent delay in maturation of FS interneurons during early cortical development progresses to normal functional properties in more mature interneurons. As an additional measure of FS interneuron maturation, we compared the hyperpolarization activated cation current (Ih) between Fmr1 WT and KO mice. Ih is relatively large in FS interneurons in young mice and declines over the course of development of the cortex (Itami et al., 2007). Consistent with the other delays in functional measures of maturation of FS interneurons, we found that Ih, measured as the voltage sag response to incremental hyperpolarizing current injection, was larger in Fmr1 KO mice at P9 (WT: n = 13 from 6 mice; KO: n = 10 from 3 mice; two-way ANOVA, F(1,21) = 10.17, p = 0.0044; Fig. 2E). At developmental time points after P9 we did not find a genotype-associated difference in Ih (P11 WT: n = 13 from 3 mice; P11 KO: n = 18 from 4 mice; two-way ANOVA, F(1,29) = 0.15, p = 0.70; Fig. 2F) and at P13–P15 (WT: n = 31 from 5 mice; P13–15 KO: n = 17 from 3 mice; two-way ANOVA, F(1,46) = 0.017, p = 0.90). In addition there were no correlated, consistent, alterations in the resting membrane potential (RMP) and AP threshold of FS neurons between the two genotypes across the same developmental time period (Fig. 3A–C). We also measured neuronal excitability as the number of APs evoked both by incremental current injection (500 ms square pulse) and using short 2 ms suprathreshold (1 nA) steps given at 50 Hz for 5 s. We found that using either of these methods to elicit APs there was a developmental increase in the number of APs but we did not detect significant differences between the genotypes at P9 or P13–P15 (Fig. 3D–H). Together these results demonstrate that there is a delay in the development of the characteristic firing pattern of FS interneurons during the critical period in Fmr1 KO mice without an observed change in the total AP output.
Figure 2.
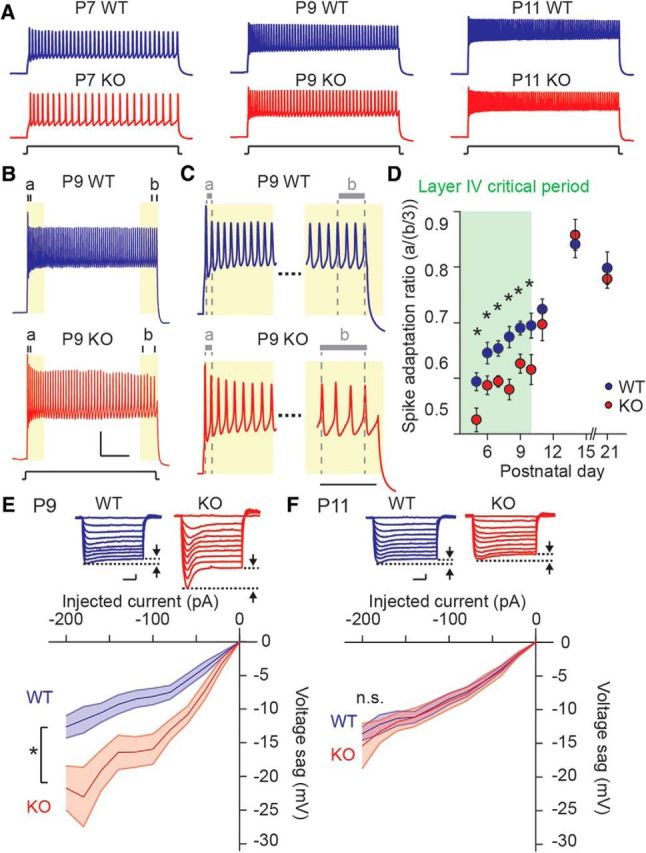
Maturation in FS functional phenotype is delayed in Fmr1 KO mice. A, Representative AP responses evoked by 500 ms (200 pA) current injection recorded from FS neurons at P7 (left), P9 (middle), and P11 (right) in Fmr1 WT (top) and Fmr1 KO mice (bottom). The firing frequency becomes higher and the firing pattern becomes less adaptive during development. B, Representative voltage responses to 500 ms (300 pA) current injection in P9 Fmr1 WT (top) and Fmr1 KO mice (bottom). The first and last three ISIs are indicated as “a” and “b”, respectively. Scale bar: 100 ms and 25 mV. C, Magnified traces to highlight initial and final ISI. Scale bar, 50 ms. D, Grouped data for SAR calculated as [a/(b/3)] recorded at postnatal days starting at P5. SAR is smaller from P5 to P10 in Fmr1 KO mice, n = 20–37 (from 3–8 mice). *p < 0.05. E, F, Top, Representative voltage sag responses evoked by 500 ms hyperpolarizing current injection (0 to −200 pA with −20 pA increment) in Fmr1 WT (left) and KO (right) mice at P9 (E) and P11 (F). Voltage sag is indicated by arrowheads. Scale bars: 100 ms and 10 mV. E, F, Bottom, Collective data for voltage sag at P9 (E) and P11 (F). Voltage sag becomes smaller during development, but is larger in Fmr1 KO mice at P9; n = 10–18 recordings from 3–4 mice. *p < 0.05, n.s. at p ≥ 0.05.
Figure 3.
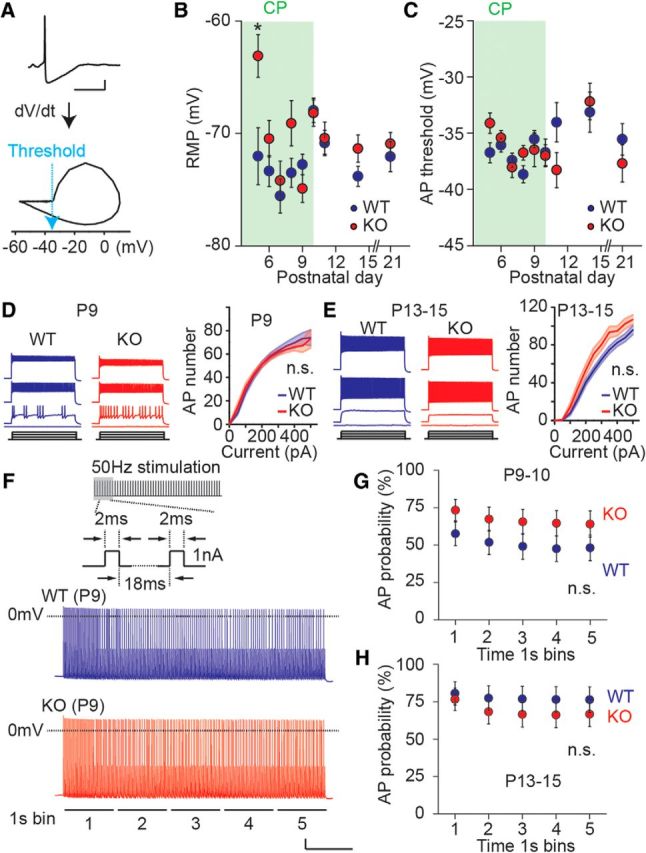
Neuronal excitability is not altered in FS interneurons in Fmr1 KO mice. A, Representative AP trace (top) and derivative (dV/dt) of AP (bottom). AP threshold is defined as the voltage where dV/dt starts to rise up. Scale bar: 50 ms and 10 mV. B, C, Collective data for RMP (B) and AP threshold (C) in FS interneurons in Fmr1 WT and KO mice. There is no difference in these parameters except for a small depolarizing shift in RMP in Fmr1 KO mice at P5. Critical period (CP) of somatosensory cortex is highlighted as green; n = 17–37 (from 3–7 mice). *p < 0.05. D, E, Representative AP traces evoked by incremental depolarizing current injections (0–300 pA with 100 pA increments; left) and collective data for AP I/O curves (right) at P9 (D) and P13–P15 (E). There is no difference in AP numbers during development between genotypes (two-way ANOVA, F(1,42) = 0.19, p = 0.66 at P9; F(1,25) = 1.73, p = 0.20 at P13–P15; n = 9–29 from 3–7 mice). n.s. at p ≥ 0.05. F, Schematic trace of suprathreshold (1 nA) short latency (2 ms) high-frequency (50 Hz) depolarizing current injection (top). Representative AP traces evoked by 5 s current injection in P9 Fmr1 WT (middle) and KO (bottom) mice. Membrane voltage at 0 mV is indicated by dashed line. Scale bar: 1 s and 10 mV. G, H, Collective data for AP probability for each 1 s bin of the AP trains evoked by 50 Hz stimulation at P9–P10 (G) and P13–P15 (H). There is no difference in AP probability between genotypes at both time points (two-way ANOVA, F(1,39) = 1.94, p = 0.17 at P9; F(1,35) = 0.55, p = 0.49 at P13–P15; n = 17–21 from 3–5 mice). n.s. at p ≥ 0.05.
Delayed FS interneuron maturation in Fmr1 KO mice is normalized by a TrkB receptor agonist
BDNF-TrkB signaling is critical for the maturation of FS neurons (Itami et al., 2007; Zheng et al., 2011), and there is increasing evidence indicating that there is a deficit in BDNF signaling during early development in Fmr1 KO mice (Castrén and Castrén, 2014). Prior work has demonstrated that there is a decrease in the expression of BDNF in the cortex of adult 2–4 month Fmr1 KO mice (Louhivuori et al., 2011), however, it is not known whether BDNF or TrkB expression is altered in S1 of neonates during the critical period. We isolated tissue from S1 cortex and developmentally examined the protein expression levels of the TrkB receptor and BDNF. We first quantified the expression of BDNF using ELISA at two postnatal time points. We found a significant reduction of BDNF expression in samples from P5 Fmr1 KO mice, whereas no significant difference was observed in tissue from P10 mice (P5: 56 ± 8% of WT, n = 8 and 6 for WT and KO, p < 0.01; P10: 81 ± 12% of WT, n = 10 and 10 for WT and KO, p = 0.19; Fig. 4A). Conversely, using immunoblot analysis of tissue isolated from both P5 and P9 neonates we observed significantly higher expression of TrkB receptor in Fmr1 KO mouse cortex than Fmr1 WT (P5: 137 ± 13% of WT, n = 12 and 14 for WT and KO, p = 0.046; P9: 143 ± 10% of WT, n = 8 and 10 for WT and KO, p = 0.017; Fig. 4B). These data demonstrate that during critical period development there is a deficit in BDNF expression in the somatosensory cortex of perinatal mice and expression of the TrkB receptor is upregulated similar to what has been reported in the hippocampus of adult mice (Uutela et al., 2014).
Figure 4.
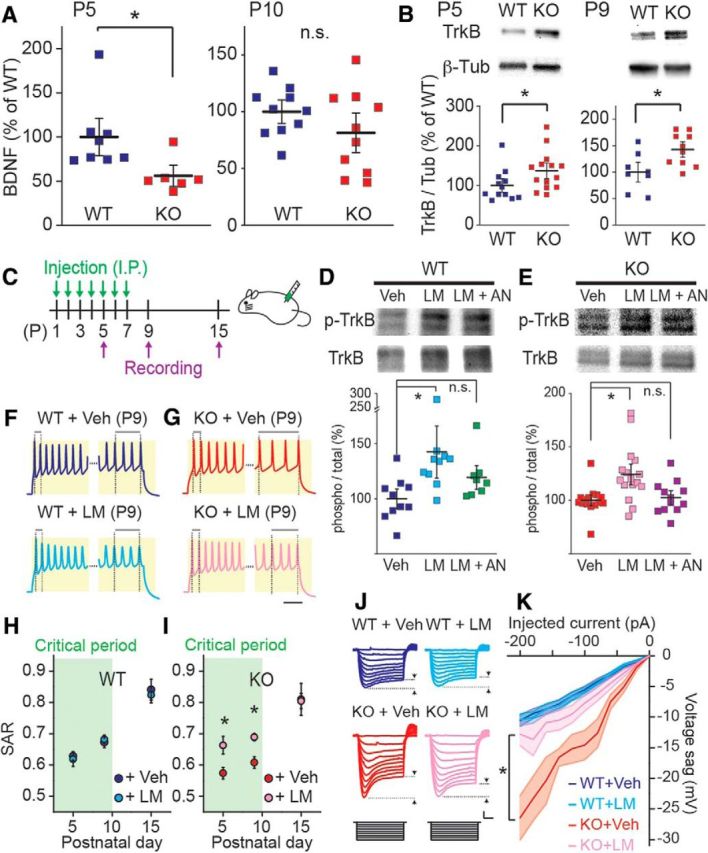
Delayed maturation in FS phenotype is rescued by LM22A-4. A, BDNF protein expression level in developing S1 cortex determined by ELISA. Protein levels were normalized and presented as percentage of WT mean. BDNF is lower in Fmr1 KO mice at P5, but is not at P10. *p < 0.05, n.s. at p ≥ 0.05. B, Representative immunoblot images (top) and calculated relative expression from all experiments (below) for TrkB protein level at P5 (left) and P9 (right). Protein levels were normalized by β-tubulin (β-Tub) and data are presented as percentage of WT mean. TrkB expression (TrkB/Tub) is higher in Fmr1 KO mice at P5 and P9. *p < 0.05. C, Experimental paradigm for drug administration and ex vivo recordings. Mice were randomized and treated with vehicle (Veh) or LM22A-4 (LM) 100 mg/kg daily intraperitoneally (I.P.) from P1 to P7. Saline was used as a vehicle control. Recordings were made at P5, P9, and P15. D, E, Evidence that LM22A-4 specifically activates TrkB. Representative immunoblot images (top) and relative protein levels (below) for total TrkB and phosphorylated (Y515) TrkB (p-TrkB) in Fmr1 WT (D) and KO (E) mice. p-TrkB level (phospho) were divided by total TrkB level (total) in each sample and data are presented as percentage of mean in Veh-treated group. LM increases p-TrkB level in both WT and KO samples, which is not observed in ANA 12 coadministrated group (LM + AN; WT: vehicle-treated: n = 10 from 10 mice; LM22A-4-treated: n = 10 from 10 mice; LM22A-4 and ANA 12-treated: n = 8 from 8 mice; one-way ANOVA, F(2,25) = 3.99, p = 0.028 for Veh vs LM, 0.71 for Veh vs LM + AN; KO: vehicle-treated: n = 15 from 15 mice; LM22A-4-treated: n = 16 from 16 mice; LM22A-4 and ANA 12-treated: n = 12 from 12 mice; one-way ANOVA, F(2,40) = 7.38, p < 0.01 for Veh vs LM, 1.0 for Veh vs LM + AN). *p < 0.05, n.s. at p ≥ 0.05. F, G, Representative voltage responses to 500 ms (300 pA) current injections recorded from vehicle- (top) and LM22A-4- (bottom) treated Fmr1 WT (F) and Fmr1 KO (G) mice at P9. Initial and final portion of the traces were enlarged to highlight initial and final ISIs. Scale bar, 25 ms. H, I, Grouped data for SAR after vehicle and LM22A-4 treatment in Fmr1 WT (H) and KO (I) mice. Calculated SARs are lower in vehicle-treated KO mice at P5 and P9, whereas SARs in LM22A-4-treated KO mice are similar level as WT mice; n = 13–39 recordings from 3–5 mice. *p < 0.05. LM22A-4 has no effect on SARs in WT mice. J, Representative voltage responses to 500 ms hyperpolarizing current injections (0 to −200 pA with −20 pA increment) recorded from vehicle- (left) and LM22A-4- (right) treated Fmr1 WT (top) and KO (bottom) mice at P9. Scale bar, 100 ms and 10 mV. K, Collective data for voltage sag after vehicle and LM22A-4 treatment in WT and KO mice. LM22A-4 treatment corrects exaggerated Ih in Fmr1 KO mice to similar level as WT mice; n = 15–25 (from 4–5 mice). *p < 0.05.
We next hypothesized that a deficit in BDNF-TrkB signaling might underlie the altered development of FS neurons in S1 cortex, and this might be rescued by administration of a TrkB agonist to mice. To test this we administered the small molecule TrkB receptor partial agonist LM22A-4 daily to neonates (P1–P7; 100 mg/kg, once a day, i.p.; Massa et al., 2010; Schmid et al., 2012; Fig. 4C). Previous studies have demonstrated directly that LM22A-4 crosses the blood–brain barrier after systemic administration by liquid chromatography/tandem mass spectrometry and specifically activates TrkB (Massa et al., 2010; Schmid et al., 2012). To confirm that LM22A-4 was acting centrally we first performed immunoblots for activated TrkB after intraperitoneal injection in P3 mice. Phospho-TrkB (Y515) was significantly elevated in both Fmr1 WT (Fig. 4D) and Fmr1 KO mice (Fig. 4E) 2 h after a single dose of LM22A-4 (100 mg/kg) and this increase in phosphorylation was blocked in both cases by the in vivo coadministration of the TrkB antagonist ANA 12 (0.5 mg/kg; Cazorla et al., 2011; Fig. 4D,E). To determine whether TrkB activation corrected interneuron maturation, SAR (P5, P9, and P15) and Ih (P9 and P15) were examined as parameters for functional maturation for FS neurons (Fig. 4F–K). We found that the reduced SAR of FS interneurons in Fmr1 KO mice at P5 and P9 that signified a delay in maturation, was normalized by the chronic, systemic administration of LM22A-4 (Fig. 4F–I). The SAR in vehicle-treated Fmr1 KO was significantly different to vehicle-treated Fmr1 WT at both P5 and P9 (P5 vehicle-treated WT: n = 31 from 4 mice; P5 vehicle-treated KO: n = 24 from 3 mice; one-way ANOVA, F(3,98) = 2.85, p = 0.029; P9 vehicle-treated WT: n = 27 from 4 mice; P9 vehicle-treated KO: n = 35 from 5 mice; one-way ANOVA, F(3,124) = 6.50, p < 0.001; Fig. 4H,I), whereas in recordings from the LM22A-4-treated group the SAR was not different compared with the SAR recorded in interneurons of the vehicle-treated Fmr1 WT mice (P5 vehicle-treated WT: n = 31 from 4 mice; P5 LM22A-4-treated KO: n = 22 from 3 mice; one-way ANOVA, F(3,98) = 2.85, p = 1.0; P9 vehicle-treated WT: n = 27 from 4 mice; P9 LM22A-4-treated KO: n = 39 from 5 mice; one-way ANOVA, F(3,124) = 6.50, p = 0.46; Fig. 4H,I). Interestingly LM22A-4 did not have any effect on the SAR of interneurons recorded at any of these time points in Fmr1 WT mice suggesting a ceiling effect of TrkB signaling on SAR maturation (Fig. 4H). In addition at developmental time points after the closure of the critical period (P15) we saw no effect of LM22A-4 in either genotype (Fig. 4H,I). We also measured the voltage sag as a measure of Ih in FS neurons and found that the elevated Ih was also rectified in Fmr1 KO mice at P9 (Fig. 4J,K). There was a significant difference in Ih recorded in vehicle-treated Fmr1 KO and WT mice (P9 vehicle-treated WT: n = 23 from 4 mice; P9 vehicle-treated KO: n = 15 from 3 mice; two-way ANOVA, F(3,76) = 10.0, p < 0.001), but no difference was observed between the LM22A-4-treated KO and control-treated Fmr1 WT mice (P9 vehicle-treated WT: n = 23 from 4 mice; P9 LM22A-4-treated KO: n = 25 from 5 mice; two-way ANOVA, F(3,76) = 10.0, p = 0.93; Fig. 4J,K). In addition, LM22A-4 administration did not affect Ih in Fmr1 WT mice (P9 vehicle-treated WT: n = 23 from 4 mice; P9 LM22A-4-treated WT: n = 17 from 4 mice; two-way ANOVA, F(3,76) = 10.0, p = 1.0; Fig. 4J,K). Finally in mice treated during the critical period (P1–P7) with LM22A-4 and in which recordings were made at P15, we observed no differences in Ih between any of the genotype or treatment groups (two-way ANOVA, F(3,62) = 0.76, p = 0.52; data not shown).
Formation of synaptic contacts is delayed in Fmr1 KO mice
PV interneurons receive both intracortical and thalamic excitatory input, which develops during the cortical critical period (Daw et al., 2007; Chittajallu and Isaac, 2010). Excitatory synapses on FS interneurons form during this time to connect the feedforward inhibitory circuit that is critical to the precise timing of sensory inputs to layer IV neurons (Daw et al., 2007; Chittajallu and Isaac, 2010). To establish whether synaptic input onto FS interneurons in layer IV S1 was normal in Fmr1 KO mice we recorded spontaneous EPSCs (sEPSCs) during the critical period. The frequency of sEPSCs increased across development in both Fmr1 WT and KO mice, reflecting circuit synaptic maturation (Fig. 5A–D; Table 1). However, a comparison of sEPSC frequencies in Fmr1 WT and KO mice between ages P5–P9 demonstrated there was a significant reduction in the frequency of spontaneous events in Fmr1 KO mice (Fig. 5D; Table 1). In recordings in which we applied TTX to measure mEPSCs, we found that AP-independent mEPSC frequency was also reduced in Fmr1 KO mice at P5–P9 (Table 1), indicating delayed maturation of excitatory inputs to FS neurons. There was no consistent difference in sEPSC and mEPSC amplitudes and kinetics between the genotypes, although there was a small but significant reduction in the amplitude of sEPSC at P5 (WT: 20.0 ± 1.4 pA, n = 19 from 4 mice; KO: 15.2 ± 1.5 pA, n = 14 from 3 mice, p = 0.026; Fig. 5C,E) and mEPSC at P5 (Table 1). To further examine excitatory synapses onto FS interneurons in P9–P10 mice we quantified the synapse density of identified neurons filled with AlexaFluor 488 using immunofluorescence array-tomography. Putative excitatory synapses were identified by overlapping staining of GFP and PSD-95 on consecutive serial sections that lay within 100 nm of the presynaptic marker synaptophysin (i.e., colocalization of recorded neuron, postsynaptic marker, and presynaptic marker). Analysis of secondary and tertiary dendrites demonstrated that there was a significant reduction in the synapse density in Fmr1 KO mice (Fig. 6A–E) compared with Fmr1 WT mice, which is consistent with the reduced frequency of synaptic events recorded in these neurons at the same developmental age. To further confirm the deficit in functional synaptic inputs to FS neurons, we isolated evoked EPSCs using intracortical extracellular stimulation and examined the I/O relationship by incrementally increasing the extracellular stimulating current (Fig. 6F). We found that there was a significant difference in the amplitude of the evoked EPSC (WT: n = 14 from 4 mice; KO: n = 20 from 5 mice; two-way ANOVA, F(1,32) = 22.86, p < 0.001; Fig. 6F). In recordings from young mice beyond the critical period (P20–P22) there was no significant difference in the EPSC I/O relationship in FS neurons in Fmr1 KO mice demonstrating that this deficit is also normalized later in development (Fig. 6G). Together these results indicate that there is a significant delay in the formation of excitatory contacts onto FS interneurons, which likely has a large impact on the integration of feedforward inhibitory circuits in the developing S1 cortex in Fmr1 KO mice.
Figure 5.
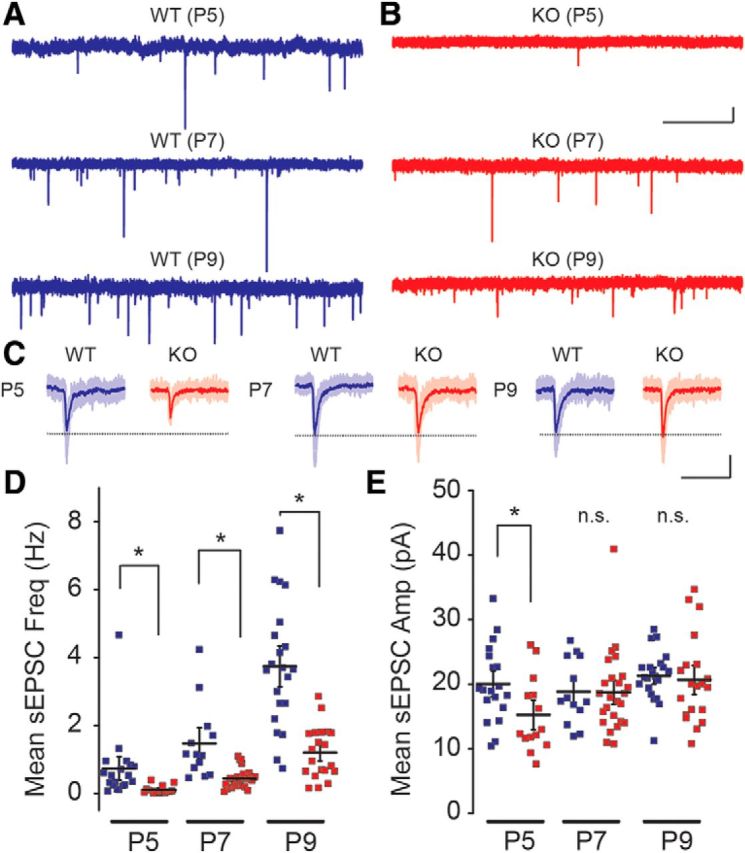
Development in excitatory synapses onto FS interneurons is delayed in Fmr1 KO mice. A, B, Representative sEPSC traces recorded in FS interneurons from Fmr1 WT (A) and Fmr1 KO (B) mice at P5 (top), P7 (middle), and P9 (bottom). Scale bar, 1 s and 10 pA. C, Individual sEPSC events recorded from Fmr1 WT and Fmr1 KO mice at P5 (left), P7 (middle), and P9 (right). Ten EPSC traces (opaque lines) were averaged in each group (solid line). Scale bar, 25 ms and 10 pA. D, Collective data for sEPSC frequency. sEPSC frequency increases during development (P5–P9), but remains lower in Fmr1 KO mice. E, Grouped data for sEPSC amplitude. sEPSC amplitude is not significantly changed during development (P5–P9), and are not different between genotypes except for at P5; n = 13–25 (from 3–5 mice). * p < 0.05. n.s at. p ≥ 0.05.
Table 1.
Measured properties of sEPSC and mEPSC in FS interneurons
| Age | Frequency, Hz |
p | Amplitude, pA |
p | ||
|---|---|---|---|---|---|---|
| WT | KO | WT | KO | |||
| sEPSC | ||||||
| P5 | 0.73 ± 0.23 (n = 19) | 0.11 ± 0.03 (n = 14)* | 0.02 | 20.0 ± 1.4 (n = 19) | 15.2 ± 1.5 (n = 14)* | 0.03 |
| P7 | 1.47 ± 0.31 (n = 13) | 0.44 ± 0.06 (n = 25)* | <0.01 | 18.8 ± 1.4 (n = 13) | 18.7 ± 1.3 (n = 25) | 0.96 |
| P9 | 3.74 ± 0.40 (n = 21) | 1.21 ± 0.17 (n = 20)* | <0.01 | 21.3 ± 0.8 (n = 21) | 20.7 ± 1.5 (n = 20) | 0.71 |
| mEPSC | ||||||
| P5 | 0.72 ± 0.16 (n = 22) | 0.09 ± 0.02 (n = 18)* | <0.01 | 19.5 ± 1.0 (n = 22) | 15.9 ± 1.3 (n = 18)* | 0.03 |
| P7 | 1.29 ± 0.32 (n = 15) | 0.24 ± 0.03 (n = 26)* | <0.01 | 18.7 ± 1.2 (n = 15) | 18.8 ± 1.0 (n = 26) | 0.94 |
| P9 | 3.48 ± 0.48 (n = 19) | 0.67 ± 0.09 (n = 21)* | <0.01 | 19.3 ± 1.0 (n = 19) | 19.8 ± 1.4 (n = 21) | 0.78 |
Frequency and amplitude of sEPSC and mEPSC in Fmr1 WT and KO mice at P5–P9.
*p < 0.05.
Figure 6.
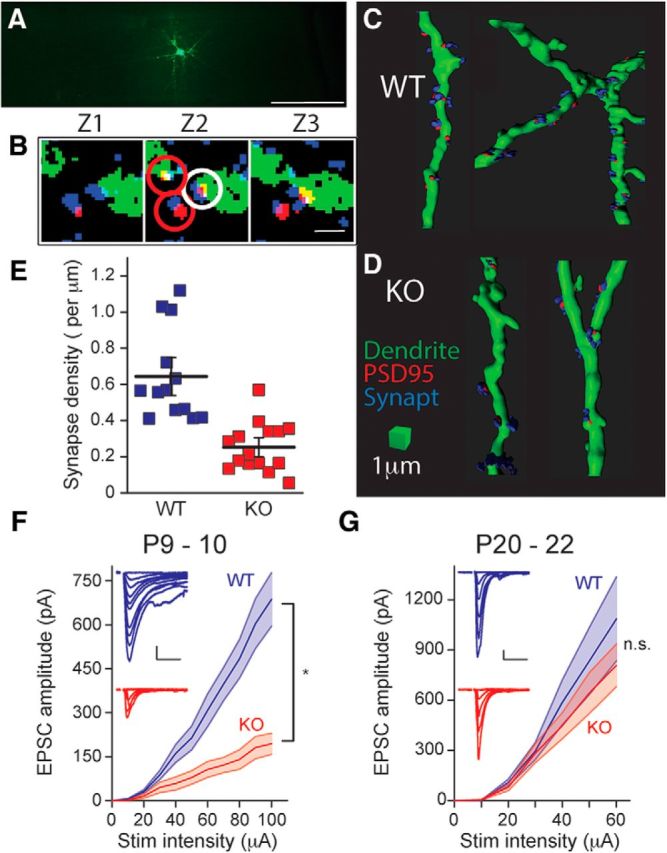
Synapse density and intracortical evoked EPSCs are reduced in Fmr1 KO mice. A, Layer IV interneurons filled with biocytin and tagged with streptavidin-conjugated AlexaFluor 488. Slice containing labeled cell was embedded in LR White resin and trimmed for ultrathin cutting of 70-nm-thick sections. Scale bar, 200 μm. B, Seventy-nanometer-thick serial sections through a segment of dendrite with example of inclusion and exclusion synaptic analysis. Interneuron dendrite (green), PSD-95 (red), and synaptophysin (blue). White and red circles indicate counted and excluded synapses, respectively. To be counted as a synapse, PSD-95 puncta (postsynaptic marker) must overlap with the dendrite on consecutive sections and lie within 100 nm of synaptophysin puncta (presynaptic). Scale bar, 1 μm. C, Three-dimensional renderings of dendritic segments showing synaptic puncta on dendrite from Fmr1 WT and (D) Fmr1 KO mice. PSD-95 is labeled red and synaptophysin blue. Scale bar, 1 μm. E, Grouped data for analysis of synapse density in FS interneurons from Fmr1 WT and Fmr1 KO mice. The density of labeled puncta was significantly lower in Fmr1 KO mice (WT: 0.64 ± 0.15 synapses per μm, n = 13 cells from 3 mice; KO: 0.25 ± 0.08 synapses per μm, n = 15 cells from 3 mice, p < 0.01). *p < 0.05. F, Grouped data of EPSC amplitude input-output curves recorded from Fmr1 WT and Fmr1 KO mice at P9–P10. Insets show representative EPSCs from a Fmr1 WT (top) and Fmr1 KO (bottom) mouse recorded from FS interneuron and evoked by intracortical stimulation. EPSCs are evoked with increasing stimulation intensity. Scale bar, 10 ms and 100 pA. *p < 0.05. G, EPSC I/O curve at P20–P22 (n = 11 and 9 in WT and KO, respectively). Insets show representative EPSCs. Scale bar, 10 ms and 100 pA. n.s. at p > 0.05 (two-way ANOVA, F(1,18) = 0.69, p = 0.42).
As we had found that chronic administration of a TrkB agonist corrected the delay in the maturation of the intrinsic properties of FS interneurons, we hypothesized that this treatment might also correct the deficits in synaptic transmission in FS interneurons in Fmr1 KO mice. In a separate set of experiments we again treated mice with vehicle or LM22A-4 daily before making recordings from layer IV FS interneurons and measuring sEPSCs. We found that the reduced sEPSC frequency in Fmr1 KO FS interneurons was reversed to the same levels as Fmr1 WT mice at both P5 and P9 by in vivo daily LM22A-4 administration (Fig. 7). In Fmr1 KO mice at P5 the sEPSC frequency was 0.09 ± 0.02 Hz and 0.55 ± 0.13 Hz in vehicle- (n = 23 from 4 mice) and LM22A-4- (n = 21 from 3 mice) treated mice, respectively (one-way ANOVA, F(3,77) = 6.07, p < 0.001; Fig. 7D). The frequency in the drug-treated Fmr1 KO group is not different to the frequency in Fmr1 WT vehicle-treated mice 0.33 ± 0.07 Hz (n = 21 from 5 mice; one-way ANOVA, F(3,77) = 6.07, p = 0.33; Fig. 7C,D). Similarly, sEPSC frequencies in FS interneuron of P9 LM22A-4-treated KO mice were not different from WT control-treated mice (one-way ANOVA, F(3,63) = 7.38, p = 1.0; Fig. 7C,D). As we had observed previously while measuring the intrinsic properties of FS interneurons, there were no apparent effects of LM22A-4 on sEPSC frequency or amplitude in Fmr1 WT mice (Fig. 7C). The amplitude of sEPSC in Fmr1 KO mice was elevated by LM22A-4 treatment (Fig. 7F) in P5 KO mice (vehicle-treated KO: 15.5 ± 1.3 pA, n = 21 from 3 mice; LM22A-4-treated KO: 20.0 ± 1.2 pA. n = 21 from 4 mice; one-way ANOVA, F(3,76) = 3.57, p = 0.04), but not in the later age tested (P9; Fig. 7F). Together, these results demonstrate that there are specific alterations in the synaptic connectivity of FS interneurons in the S1 cortex, which likely result from alterations in BDNF-TrkB signaling in Fmr1 KO mice.
Figure 7.
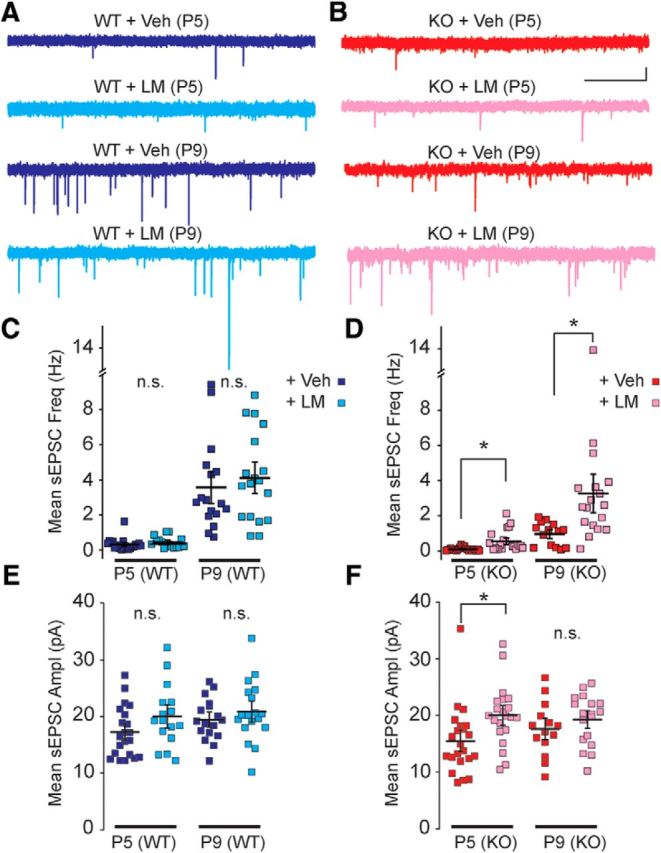
Delayed maturation in synaptic recruitment is rescued by LM22A-4. A, B, Representative sEPSC traces after vehicle (Veh) and LM22A-4 (LM) treatments in Fmr1 WT (A) and Fmr1 KO (B) mice at P5 (top) and P9 (bottom). Scale bar, 1 s and 10 pA. C, D, Grouped data for sEPSC frequency in Fmr1 WT (C) and Fmr1 KO (D) recordings. E, F, Measured sEPSC amplitude from Fmr1 WT (E) and Fmr1 KO (F) mice. In each case recordings from Veh- and LM-treated mice are shown. sEPSC frequency is not different between vehicle and LM22A-4-treated WT mice but lower sEPSC frequency in vehicle-treated KO mice is not seen in LM22A-4-treated Fmr1 KO mice. sEPSC amplitude is not different in any of the groups except at P5 in Fmr1 KO mice; n = 14–23 recordings from 3–5 mice. *p < 0.05, n.s. at p ≥ 0.05.
Discussion
In this study we demonstrate that there is a significant delay in the maturation of FS interneurons in the barrel cortex of Fmr1 KO mice. FS interneuron function is known to be disrupted in several autism spectrum disorder models (Gogolla et al., 2009), yet there has not been a detailed investigation of the maturation of these important neurons during early development in any relevant mouse models. FS neurons are particularly important to the developmental maturation of cortical circuits during critical periods and it is likely that disruptions in their activity during this period will have large effects on the refinement of cortical circuits. We found that there are specific alterations in the functional properties and development of neuronal morphology of FS interneurons only during critical period development, which normalized by the close of the critical period in Fmr1 KO mice.
Delays in maturation of neuronal morphology and functional properties of FS neurons
We demonstrated that dendritic morphology, both the total dendritic length and complexity of the dendrites, exhibited a more immature phenotype in neonatal Fmr1 KO mice only during the critical period. Consistent with the morphological immaturity, the membrane capacitance of FS neurons and the input resistance of neurons during the first postnatal week were slower to develop to the mature levels. Most importantly, the principal, defining property of these neurons (i.e., the nonadapting spiking pattern) also showed delayed development in the Fmr1 KO. Considering this observation with the altered maturation of Ih suggests that FS interneurons are functionally immature during critical period development. Counterintuitively there was not a significant difference in total spiking during long depolarizing steps; a measure of excitability. This is similar to results previously reported in BDNF KO mice which have altered spike adaptation and abnormal dendritic morphology, but normal maximum firing frequency and spike threshold (Itami et al., 2007). It is important to note that an adapting pattern of neuronal spiking is a determinant of computation in the circuit, and altered adaptation early in development may have an influence on activity of the inhibitory cortical network (Benda and Herz, 2003; Benda et al., 2005).
Impact of delayed interneuron maturation
An important question to address is how this delayed development aligned so closely with the critical period, might affect other parts of the microcircuit as they are being refined during the critical period. There are now numerous known delays in cellular, synaptic, and spine development during critical period development that are normalized later in the mature CNS (Cruz-Martín et al., 2010; Harlow et al., 2010). Despite this post-critical period normalization there are persistent disruptions in circuit function in the sensory cortex. For instance, whisker-evoked responses in the somatosensory cortex of Fmr1 KO mice are aberrant despite no consistent alteration in synapses in the adult (Arnett et al., 2014; Zhang et al., 2014). In addition, behavioral analysis of Fmr1 KO mice in a sensory tactile assay demonstrated that they display an aversive response to whisker stimulation akin to tactile defensiveness that was present in young mice and which persisted in adult mice beyond critical period development. Moreover, simultaneous imaging of Ca2+ transients in the sensory cortex demonstrated a correlated nonadapting activity of cortical neurons to repetitive tactile stimulation in the Fmr1 KO mice, which again is observed in mice beyond critical period development (He et al., 2017). Although it remains unknown whether early delays in interneuron development will have long-lasting effects on the function of the circuit, our results are consistent with other cellular and synaptic delays in development in S1 cortex in Fmr1 KO mice.
Integration of FS neurons into the cortical circuit
In addition to the intrinsic and dendritic changes in FS neurons we found significant deficits in the establishment of excitatory synapses to FS interneurons, suggesting that the integration of FS interneurons into the cortical microcircuit is also delayed during critical period. There is increasing evidence for altered GABA signaling in the sensory cortex exists in FXS (Paluszkiewicz et al., 2011) but this is the first study to make a systematic survey of the functional development of FS interneurons during the cortical critical period. The roles of GABA in the developing cortex are of particular interest as GABA not only mediates synaptic inhibition, but in addition plays trophic roles in cellular proliferation, migration, and synaptogenesis (Owens and Kriegstein, 2002; Oh et al., 2016). This trophic role of GABA is prominent during early development because of the relatively depolarized GABA reversal potential (EGABA) in young neurons, which allows GABAA receptors to depolarize the membrane sufficiently to reach the AP threshold. In fact our recent work has demonstrated that the depolarized EGABA is retained later in development in layer IV spiny stellate neurons in Fmr1 KO mice, suggesting that the output of FS interneurons will depolarize neurons inappropriately during and beyond the critical period (He et al., 2014). Therefore it is possible that the major effect that the delayed integration of FS neurons into the cortical circuit has on the cortex is in influencing the trophic actions of GABA on developing neurons.
BDNF-TrkB signaling in FXS
BDNF-TrkB signaling has an essential role in the development of cortical FS interneurons (Itami et al., 2007) as well as a critical role in synaptic maturation (Luikart and Parada, 2006; Park and Poo, 2013). We found that chronic, systemic administration of the TrkB receptor partial agonist LM22A-4 restored the delayed development of FS interneurons during the critical period, suggesting that TrkB signaling is impaired in Fmr1 KO mice. Several prior studies have demonstrated an important role for BDNF-TrkB signaling in FXS (Castrén and Castrén, 2014), but there have been inconsistent reports on alterations in the protein expression level of BDNF in different brain regions in Fmr1 KO mice (Lauterborn et al., 2007; Louhivuori et al., 2011; Uutela et al., 2012). We assessed this in our study at these early developmental time points and found that BDNF protein levels were lower in the cortex of Fmr1 KO mice during the critical period at P5. There was no significant difference, on the other hand, in expression detected between WT and KO mice at P10. In contrast, the expression of the TrkB receptor has been shown to be upregulated in cortical FS neurons of adult Fmr1 KO mice (Selby et al., 2007), possibly reflecting compensatory changes to a deficit in BDNF signaling. Our immunoblot analysis also demonstrated an upregulation of TrkB protein in neonatal S1 cortex of Fmr1 KO mice at both P5 and P9. Interestingly, genetic reduction of BDNF ameliorates some phenotypes such as hyperactivity and deficits in sensorimotor learning, but also amplifies other learning deficits in the water maze and contextual fear tests in Fmr1 KO mice consistent with the heterogeneous expression changes in different brain circuits (Uutela et al., 2012). Our data clearly demonstrate that in the developing S1 cortex a deficiency in BDNF-TrkB signaling is responsible for the delayed maturation of FS interneurons in Fmr1 KO mice.
GABAergic regulation of critical period timing in FXS
There is a growing awareness of the importance of disruptions in cortical critical periods in a number of neurodevelopmental disorders including most prominently in FXS (Meredith, 2015). For instance in the mouse model of Rett syndrome critical period onset and closure in the visual cortex are accelerated (Krishnan et al., 2015), and Syngap1 haploinsufficiency (a model of non-syndromic intellectual disability) causes a precocious critical period in S1 cortex (Clement et al., 2013). In Fmr1 KO mice, our previous studies have demonstrated that the timing of the critical period for plasticity in layer IV of S1 cortex is shifted (Harlow et al., 2010). At postnatal ages when synaptic plasticity is normally absent and silent synapses are eliminated (Crair and Malenka, 1995), these synaptic markers of the close of the critical period persist in Fmr1 KO mice (Harlow et al., 2010). Although less is known about what determines the timing of critical periods in the somatosensory cortex, in visual cortices there is overwhelming evidence that GABA is the primary regulator of critical period timing (Hensch, 2004, 2005). Among the subpopulations of GABAergic interneurons, FS neurons are the primary driver of critical period timing (Fagiolini et al., 2004). Recent evidence demonstrated that genetic deletion of the Gclc gene in FS interneurons, which is critical for production of endogenous glutathione, resulted in a disruption of perineuronal nets leading to a prolongation of the critical period (Morishita et al., 2015). Therefore our findings that FS interneuron maturation is also delayed during early development in Fmr1 KO mice provides a compelling rationale for future investigations of the role of dysfunctional GABA in mistimed critical periods in FXS.
There are multiple studies that indicate the involvement of FS interneuron disruption in neurodevelopmental disorders (Lewis et al., 2005; Gogolla et al., 2009; Krishnan et al., 2015). We present here evidence for transient early delays in the trajectory of functional maturation of FS interneurons in the mouse model of FXS. Our work highlights what may be common critical mechanisms in a variety of neurodevelopmental disorders in which interneurons and inhibitory networks are known to play critical roles.
Footnotes
This work was supported by Grants from NIH/NIMH R21 MH104808, NIH/NIMH R01 MH099114 and Department of Defense W81XWH-13-ARP-IDA, and a research Grant from the Japan Foundation for Neuroscience and Mental Health to T.N. We thank Stephen Kraniotis for technical help, members of the Contractor and Swanson laboratories at Northwestern for helpful discussion and comments on the work, and Dr. Yoshimasa Imoto for help with the ELISA assay.
The authors declare no competing financial interests.
References
- Agmon A, Connors BW (1991) Thalamocortical responses of mouse somatosensory (barrel) cortex in vitro. Neuroscience 41:365–379. 10.1016/0306-4522(91)90333-J [DOI] [PubMed] [Google Scholar]
- Arnett MT, Herman DH, McGee AW (2014) Deficits in tactile learning in a mouse model of fragile X syndrome. PLoS One 9:e109116. 10.1371/journal.pone.0109116 [DOI] [PMC free article] [PubMed] [Google Scholar]
- Benda J, Herz AV (2003) A universal model for spike-frequency adaptation. Neural Comput 15:2523–2564. 10.1162/089976603322385063 [DOI] [PubMed] [Google Scholar]
- Benda J, Longtin A, Maler L (2005) Spike-frequency adaptation separates transient communication signals from background oscillations. J Neurosci 25:2312–2321. 10.1523/JNEUROSCI.4795-04.2005 [DOI] [PMC free article] [PubMed] [Google Scholar]
- Castrén ML, Castrén E (2014) BDNF in fragile X syndrome. Neuropharmacology 76:729–736. 10.1016/j.neuropharm.2013.05.018 [DOI] [PubMed] [Google Scholar]
- Castrén M, Pääkkönen A, Tarkka IM, Ryynänen M, Partanen J (2003) Augmentation of auditory N1 in children with fragile X syndrome. Brain Topogr 15:165–171. 10.1023/A:1022606200636 [DOI] [PubMed] [Google Scholar]
- Cauli B, Audinat E, Lambolez B, Angulo MC, Ropert N, Tsuzuki K, Hestrin S, Rossier J (1997) Molecular and physiological diversity of cortical nonpyramidal cells. J Neurosci 17:3894–3906. [DOI] [PMC free article] [PubMed] [Google Scholar]
- Cazorla M, Prémont J, Mann A, Girard N, Kellendonk C, Rognan D (2011) Identification of a low-molecular weight TrkB antagonist with anxiolytic and antidepressant activity in mice. J Clin Invest 121:1846–1857. 10.1172/JCI43992 [DOI] [PMC free article] [PubMed] [Google Scholar]
- Chattopadhyaya B, Di Cristo G, Higashiyama H, Knott GW, Kuhlman SJ, Welker E, Huang ZJ (2004) Experience and activity-dependent maturation of perisomatic GABAergic innervation in primary visual cortex during a postnatal critical period. J Neurosci 24:9598–9611. 10.1523/JNEUROSCI.1851-04.2004 [DOI] [PMC free article] [PubMed] [Google Scholar]
- Chittajallu R, Isaac JT (2010) Emergence of cortical inhibition by coordinated sensory-driven plasticity at distinct synaptic loci. Nat Neurosci 13:1240–1248. 10.1038/nn.2639 [DOI] [PMC free article] [PubMed] [Google Scholar]
- Clement JP, Ozkan ED, Aceti M, Miller CA, Rumbaugh G (2013) SYNGAP1 links the maturation rate of excitatory synapses to the duration of critical-period synaptic plasticity. J Neurosci 33:10447–10452. 10.1523/JNEUROSCI.0765-13.2013 [DOI] [PMC free article] [PubMed] [Google Scholar]
- Contractor A, Klyachko VA, Portera-Cailliau C (2015) Altered neuronal and circuit excitability in fragile X syndrome. Neuron 87:699–715. 10.1016/j.neuron.2015.06.017 [DOI] [PMC free article] [PubMed] [Google Scholar]
- Crair MC, Malenka RC (1995) A critical period for long-term potentiation at thalamocortical synapses. Nature 375:325–328. 10.1038/375325a0 [DOI] [PubMed] [Google Scholar]
- Cruz-Martín A, Crespo M, Portera-Cailliau C (2010) Delayed stabilization of dendritic spines in fragile X mice. J Neurosci 30:7793–7803. 10.1523/JNEUROSCI.0577-10.2010 [DOI] [PMC free article] [PubMed] [Google Scholar]
- Daw MI, Ashby MC, Isaac JT (2007) Coordinated developmental recruitment of latent fast spiking interneurons in layer IV barrel cortex. Nat Neurosci 10:453–461. 10.1038/nn1866 [DOI] [PubMed] [Google Scholar]
- Day M, Wang Z, Ding J, An X, Ingham CA, Shering AF, Wokosin D, Ilijic E, Sun Z, Sampson AR, Mugnaini E, Deutch AY, Sesack SR, Arbuthnott GW, Surmeier DJ (2006) Selective elimination of glutamatergic synapses on striatopallidal neurons in Parkinson disease models. Nat Neurosci 9:251–259. 10.1038/nn1632 [DOI] [PubMed] [Google Scholar]
- Fagiolini M, Fritschy JM, Löw K, Möhler H, Rudolph U, Hensch TK (2004) Specific GABAA circuits for visual cortical plasticity. Science 303:1681–1683. 10.1126/science.1091032 [DOI] [PubMed] [Google Scholar]
- Gibson JR, Bartley AF, Hays SA, Huber KM (2008) Imbalance of neocortical excitation and inhibition and altered UP states reflect network hyperexcitability in the mouse model of fragile X syndrome. J Neurophysiol 100:2615–2626. 10.1152/jn.90752.2008 [DOI] [PMC free article] [PubMed] [Google Scholar]
- Gogolla N, Leblanc JJ, Quast KB, Südhof TC, Fagiolini M, Hensch TK (2009) Common circuit defect of excitatory-inhibitory balance in mouse models of autism. J Neurodev Disord 1:172–181. 10.1007/s11689-009-9023-x [DOI] [PMC free article] [PubMed] [Google Scholar]
- Harlow EG, Till SM, Russell TA, Wijetunge LS, Kind P, Contractor A (2010) Critical period plasticity is disrupted in the barrel cortex of FMR1 knockout mice. Neuron 65:385–398. 10.1016/j.neuron.2010.01.024 [DOI] [PMC free article] [PubMed] [Google Scholar]
- He CX, Cantu DA, Mantri SS, Zeiger WA, Goel A, Portera-Cailliau C (2017) Tactile defensiveness and impaired adaptation of neuronal activity in the Fmr1 knock-out mouse model of autism. J Neurosci 37:6475–6487. 10.1523/JNEUROSCI.0651-17.2017 [DOI] [PMC free article] [PubMed] [Google Scholar]
- He Q, Nomura T, Xu J, Contractor A (2014) The developmental switch in GABA polarity is delayed in fragile X mice. J Neurosci 34:446–450. 10.1523/JNEUROSCI.4447-13.2014 [DOI] [PMC free article] [PubMed] [Google Scholar]
- Hensch TK. (2004) Critical period regulation. Annu Rev Neurosci 27:549–579. 10.1146/annurev.neuro.27.070203.144327 [DOI] [PubMed] [Google Scholar]
- Hensch TK. (2005) Critical period plasticity in local cortical circuits. Nat Rev Neurosci 6:877–888. 10.1038/nrn1787 [DOI] [PubMed] [Google Scholar]
- Hubel DH, Wiesel TN (1970) The period of susceptibility to the physiological effects of unilateral eye closure in kittens. J Physiol 206:419–436. 10.1113/jphysiol.1970.sp009022 [DOI] [PMC free article] [PubMed] [Google Scholar]
- Itami C, Kimura F, Nakamura S (2007) Brain-derived neurotrophic factor regulates the maturation of layer 4 fast-spiking cells after the second postnatal week in the developing barrel cortex. J Neurosci 27:2241–2252. 10.1523/JNEUROSCI.3345-06.2007 [DOI] [PMC free article] [PubMed] [Google Scholar]
- Kawaguchi Y, Kubota Y (1993) Correlation of physiological subgroupings of nonpyramidal cells with parvalbumin- and calbindinD28k-immunoreactive neurons in layer V of rat frontal cortex. J Neurophysiol 70:387–396. [DOI] [PubMed] [Google Scholar]
- Kawaguchi Y, Kubota Y (1997) GABAergic cell subtypes and their synaptic connections in rat frontal cortex. Cereb Cortex 7:476–486. 10.1093/cercor/7.6.476 [DOI] [PubMed] [Google Scholar]
- Krishnan K, Wang BS, Lu J, Wang L, Maffei A, Cang J, Huang ZJ (2015) MeCP2 regulates the timing of critical period plasticity that shapes functional connectivity in primary visual cortex. Proc Natl Acad Sci U S A 112:E4782–E4791. 10.1073/pnas.1506499112 [DOI] [PMC free article] [PubMed] [Google Scholar]
- Lauterborn JC, Rex CS, Kramár E, Chen LY, Pandyarajan V, Lynch G, Gall CM (2007) Brain-derived neurotrophic factor rescues synaptic plasticity in a mouse model of fragile X syndrome. J Neurosci 27:10685–10694. 10.1523/JNEUROSCI.2624-07.2007 [DOI] [PMC free article] [PubMed] [Google Scholar]
- Lewis DA, Hashimoto T, Volk DW (2005) Cortical inhibitory neurons and schizophrenia. Nat Rev Neurosci 6:312–324. 10.1038/nrn1648 [DOI] [PubMed] [Google Scholar]
- Louhivuori V, Vicario A, Uutela M, Rantamäki T, Louhivuori LM, Castrén E, Tongiorgi E, Akerman KE, Castrén ML (2011) BDNF and TrkB in neuronal differentiation of Fmr1-knockout mouse. Neurobiol Dis 41:469–480. 10.1016/j.nbd.2010.10.018 [DOI] [PubMed] [Google Scholar]
- Luikart BW, Parada LF (2006) Receptor tyrosine kinase B-mediated excitatory synaptogenesis. Prog Brain Res 157:15–24. 10.1016/S0079-6123(06)57002-5 [DOI] [PubMed] [Google Scholar]
- Markram H, Toledo-Rodriguez M, Wang Y, Gupta A, Silberberg G, Wu C (2004) Interneurons of the neocortical inhibitory system. Nat Rev Neurosci 5:793–807. 10.1038/nrn1519 [DOI] [PubMed] [Google Scholar]
- Massa SM, Yang T, Xie Y, Shi J, Bilgen M, Joyce JN, Nehama D, Rajadas J, Longo FM (2010) Small molecule BDNF mimetics activate TrkB signaling and prevent neuronal degeneration in rodents. J Clin Invest 120:1774–1785. 10.1172/JCI41356 [DOI] [PMC free article] [PubMed] [Google Scholar]
- McCormick DA, Connors BW, Lighthall JW, Prince DA (1985) Comparative electrophysiology of pyramidal and sparsely spiny stellate neurons of the neocortex. J Neurophysiol 54:782–806. [DOI] [PubMed] [Google Scholar]
- Meredith RM. (2015) Sensitive and critical periods during neurotypical and aberrant neurodevelopment: a framework for neurodevelopmental disorders. Neurosci Biobehav Rev 50:180–188. 10.1016/j.neubiorev.2014.12.001 [DOI] [PubMed] [Google Scholar]
- Miller LJ, McIntosh DN, McGrath J, Shyu V, Lampe M, Taylor AK, Tassone F, Neitzel K, Stackhouse T, Hagerman RJ (1999) Electrodermal responses to sensory stimuli in individuals with fragile X syndrome: a preliminary report. Am J Med Genet 83:268–279. 10.1002/(SICI)1096-8628(19990402)83:4%3C268::AID-AJMG7%3E3.0.CO;2-K [DOI] [PubMed] [Google Scholar]
- Morishita H, Cabungcal JH, Chen Y, Do KQ, Hensch TK (2015) Prolonged period of cortical plasticity upon redox dysregulation in fast-spiking interneurons. Biol Psychiatry 78:396–402. 10.1016/j.biopsych.2014.12.026 [DOI] [PMC free article] [PubMed] [Google Scholar]
- Neuman KM, Molina-Campos E, Musial TF, Price AL, Oh KJ, Wolke ML, Buss EW, Scheff SW, Mufson EJ, Nicholson DA (2015) Evidence for Alzheimer's disease-linked synapse loss and compensation in mouse and human hippocampal CA1 pyramidal neurons. Brain Struct Funct 220:3143–3165. 10.1007/s00429-014-0848-z [DOI] [PMC free article] [PubMed] [Google Scholar]
- Nimchinsky EA, Oberlander AM, Svoboda K (2001) Abnormal development of dendritic spines in FMR1 knock-out mice. J Neurosci 21:5139–5146. [DOI] [PMC free article] [PubMed] [Google Scholar]
- Oh WC, Lutzu S, Castillo PE, Kwon HB (2016) De novo synaptogenesis induced by GABA in the developing mouse cortex. Science 353:1037–1040. 10.1126/science.aaf5206 [DOI] [PMC free article] [PubMed] [Google Scholar]
- Owens DF, Kriegstein AR (2002) Is there more to GABA than synaptic inhibition? Nat Rev Neurosci 3:715–727. 10.1038/nrn919 [DOI] [PubMed] [Google Scholar]
- Paluszkiewicz SM, Martin BS, Huntsman MM (2011) Fragile X syndrome: the GABAergic system and circuit dysfunction. Dev Neurosci 33:349–364. 10.1159/000329420 [DOI] [PMC free article] [PubMed] [Google Scholar]
- Park H, Poo MM (2013) Neurotrophin regulation of neural circuit development and function. Nat Rev Neurosci 14:7–23. 10.1038/nrc3653 [DOI] [PubMed] [Google Scholar]
- Patel AB, Hays SA, Bureau I, Huber KM, Gibson JR (2013) A target cell-specific role for presynaptic Fmr1 in regulating glutamate release onto neocortical fast-spiking inhibitory neurons. J Neurosci 33:2593–2604. 10.1523/JNEUROSCI.2447-12.2013 [DOI] [PMC free article] [PubMed] [Google Scholar]
- Richter JD, Bassell GJ, Klann E (2015) Dysregulation and restoration of translational homeostasis in fragile X syndrome. Nat Rev Neurosci 16:595–605. 10.1038/nrn4001 [DOI] [PMC free article] [PubMed] [Google Scholar]
- Rotschafer S, Razak K (2013) Altered auditory processing in a mouse model of fragile X syndrome. Brain Res 1506:12–24. 10.1016/j.brainres.2013.02.038 [DOI] [PubMed] [Google Scholar]
- Schlaggar BL, Fox K, O'Leary DD (1993) Postsynaptic control of plasticity in developing somatosensory cortex. Nature 364:623–626. 10.1038/364623a0 [DOI] [PubMed] [Google Scholar]
- Schmid DA, Yang T, Ogier M, Adams I, Mirakhur Y, Wang Q, Massa SM, Longo FM, Katz DM (2012) A TrkB small molecule partial agonist rescues TrkB phosphorylation deficits and improves respiratory function in a mouse model of Rett syndrome. J Neurosci 32:1803–1810. 10.1523/JNEUROSCI.0865-11.2012 [DOI] [PMC free article] [PubMed] [Google Scholar]
- Selby L, Zhang C, Sun QQ (2007) Major defects in neocortical GABAergic inhibitory circuits in mice lacking the fragile X mental retardation protein. Neurosci Lett 412:227–232. 10.1016/j.neulet.2006.11.062 [DOI] [PMC free article] [PubMed] [Google Scholar]
- Uutela M, Lindholm J, Louhivuori V, Wei H, Louhivuori LM, Pertovaara A, Akerman K, Castrén E, Castrén ML (2012) Reduction of BDNF expression in Fmr1 knockout mice worsens cognitive deficits but improves hyperactivity and sensorimotor deficits. Genes Brain Behav 11:513–523. 10.1111/j.1601-183X.2012.00784.x [DOI] [PubMed] [Google Scholar]
- Uutela M, Lindholm J, Rantamäki T, Umemori J, Hunter K, Võikar V, Castrén ML (2014) Distinctive behavioral and cellular responses to fluoxetine in the mouse model for fragile X syndrome. Front Cell Neurosci 8:150. [DOI] [PMC free article] [PubMed] [Google Scholar]
- Wiesel TN, Hubel DH (1963) Single-cell responses in striate cortex of kittens deprived of vision in one eye. J Neurophysiol 26:1003–1017. [DOI] [PubMed] [Google Scholar]
- Zhang Y, Bonnan A, Bony G, Ferezou I, Pietropaolo S, Ginger M, Sans N, Rossier J, Oostra B, LeMasson G, Frick A (2014) Dendritic channelopathies contribute to neocortical and sensory hyperexcitability in Fmr1−/y mice. Nat Neurosci 17:1701–1709. 10.1038/nn.3864 [DOI] [PubMed] [Google Scholar]
- Zheng K, An JJ, Yang F, Xu W, Xu ZQ, Wu J, Hökfelt TG, Fisahn A, Xu B, Lu B (2011) TrkB signaling in parvalbumin-positive interneurons is critical for gamma-band network synchronization in hippocampus. Proc Natl Acad Sci U S A 108:17201–17206. 10.1073/pnas.1114241108 [DOI] [PMC free article] [PubMed] [Google Scholar]