

Abstract
Pathological tau aggregates occur in Alzheimer's disease (AD) and other neurodegenerative tauopathies. It is not clearly understood why tauopathies vary greatly in the neuroanatomical and histopathological patterns of tau aggregation, which contribute to clinical heterogeneity in these disorders. Recent studies have shown that tau aggregates may form distinct structural conformations, known as tau strains. Here, we developed a novel model to test the hypothesis that cell-to-cell transmission of different tau strains occurs in nontransgenic (non-Tg) mice, and to investigate whether there are strain-specific differences in the pattern of tau transmission. By injecting pathological tau extracted from postmortem brains of AD (AD-tau), progressive supranuclear palsy (PSP-tau), and corticobasal degeneration (CBD-tau) patients into different brain regions of female non-Tg mice, we demonstrated the induction and propagation of endogenous mouse tau aggregates. Specifically, we identified differences in tau strain potency between AD-tau, CBD-tau, and PSP-tau in non-Tg mice. Moreover, differences in cell-type specificity of tau aggregate transmission were observed between tau strains such that only PSP-tau and CBD-tau strains induce astroglial and oligodendroglial tau inclusions, recapitulating the diversity of neuropathology in human tauopathies. Furthermore, we demonstrated that the neuronal connectome, but not the tau strain, determines which brain regions develop tau pathology. Finally, CBD-tau- and PSP-tau-injected mice showed spatiotemporal transmission of glial tau pathology, suggesting glial tau transmission contributes to the progression of tauopathies. Together, our data suggest that different tau strains determine seeding potency and cell-type specificity of tau aggregation that underlie the diversity of human tauopathies.
SIGNIFICANCE STATEMENT Tauopathies show great clinical and neuropathological heterogeneity, despite the fact that tau aggregates in each disease. This heterogeneity could be due to tau aggregates forming distinct structural conformations, or strains. We now report the development of a sporadic tauopathy model to study human tau strains by intracerebrally injecting nontransgenic mice with pathological tau enriched from human tauopathy brains. We show human tau strains seed different types and cellular distributions of tau neuropathology in our model that recapitulate the heterogeneity seen in these human diseases.
Keywords: human tauopathies, tau strains, tau mouse model, tau transmission
Introduction
Alzheimer's disease (AD) and other neurodegenerative tauopathies are all characterized by the pathological aggregation of tau protein (Lee et al., 2001). Tau is normally a highly soluble protein, which in tauopathies becomes hyperphosphorylated and misfolded, forming larger aggregates as intracellular inclusions. In AD, the burden of tau aggregates correlates closely with neuron death and cognitive decline, and tau aggregates alone cause neurodegeneration in other tauopathies (Arriagada et al., 1992; Gómez-Isla et al., 1997; Giannakopoulos et al., 2003). Tau PET imaging studies also show tau burden correlates with clinical symptoms and neurodegeneration in human AD (Cho et al., 2016a; Wang et al., 2016; Xia et al., 2017). Together, these studies show tau plays a key role in neurodegeneration.
Tauopathies vary greatly in clinical symptoms and in the neuropathological distribution of tau pathology. Thus, despite the fact that the tau protein forms aggregates in all tauopathies, the molecular basis of this heterogeneity is still unknown. AD is clinically characterized by early memory loss and eventual dementia (Lee et al., 2001). In AD, tau aggregates deposit in a stereotypical manner along anatomically connected networks from the transentorhinal cortex to neocortical areas (Braak and Braak, 1991; Braak et al., 2011; Braak and Del Tredici, 2012; Cho et al., 2016b). In AD and several other tauopathies, tau aggregates are composed of all six isoforms of tau (both 3R and 4R tau) primarily in neuronal cell bodies [neurofibrillary tangles (NFTs) and in axons (neuropil threads); Lee et al., 2001].
In contrast, corticobasal degeneration (CBD) and progressive supranuclear palsy (PSP) patients have an earlier onset and shorter duration of disease than AD patients, and primarily show motor dysfunction (Lee et al., 2001). In CBD, tau aggregates are found in the cerebral cortex, basal ganglia, deep cerebellar nuclei, and substantia nigra. They are composed primarily of 4R tau isoforms in both neurons and glia in CBD, including astrocytic plaques and oligodendroglial coiled bodies (Lee et al., 2001). Classical PSP is characterized by tau aggregates in primarily subcortical regions, such as midbrain and basal ganglia (Williams and Lees, 2009). Similar to CBD, PSP tau aggregates are composed of 4R tau isoforms in both neurons and glia, including tufted astrocytes and oligodendroglial coiled bodies (Lee et al., 2001). Although PSP was initially described as a single syndrome, recent evidence suggests that PSP may constitute multiple clinical subtypes (Williams and Lees, 2009). There is also some overlap in the manifestations of CBD and PSP (Sha et al., 2006).
Several recent studies, including those from our laboratory, have shown that pre-existing tau aggregates can “seed” the aggregation of soluble tau, and the resulting pathological tau aggregates can propagate from cell-to-cell through transmission of these proteopathic tau seeds (Clavaguera et al., 2009, 2013; Frost et al., 2009; Guo and Lee, 2013; Iba et al., 2013, 2015; Sanders et al., 2014; Boluda et al., 2015; Falcon et al., 2015; Guo et al., 2016b; Kaufman et al., 2016). It has also been proposed that similar to the prion protein, proteopathic tau seeds form structural conformations that constitute distinct tau strains, which may account for the heterogeneity of tauopathies (Clavaguera et al., 2013; Sanders et al., 2014; Boluda et al., 2015; Irwin et al., 2015; Guo et al., 2016a; Kaufman et al., 2016; Taniguchi-Watanabe et al., 2016).
We recently developed a novel model of sporadic AD tauopathy by injecting enriched pathological tau from human AD brains (AD-tau) into nontransgenic (non-Tg) mouse brains (Guo et al., 2016a). Using the same paradigm, we injected enriched pathological tau strains from AD (AD-tau), CBD (CBD-tau), and PSP (PSP-tau) human brains into non-Tg mouse brain to test the hypothesis that different tauopathies comprised of unique tau strains will seed different types of tau aggregates in vivo. We show differences in seeding potency and cell-type specificity between the tau strains represented by AD-tau, PSP-tau, and CBD-tau, thereby recapitulating the diversity of these human tauopathies.
Materials and Methods
Purification of insoluble Tau from AD, CBD, and PSP brains.
Human brain tissues from three AD cases, three CBD cases, and two PSP cases (all cases from the CNDR brain bank except 1 PSP case generously donated from the Mayo Clinic) with abundant frontal cortical tau pathology were selected for this study (Fig. 1; Table 1). Three additional PSP cases from the CNDR brain bank with abundant lentiform tau pathology were also selected for extraction (Fig. 1; Table 1). All cases were diagnosed based on accepted neuropathology criteria (Irwin et al., 2015; Montine et al., 2016). Purification of pathological, insoluble tau from the frontal cortex of these cases was performed as previously described (Guo et al., 2016a).
Figure 1.
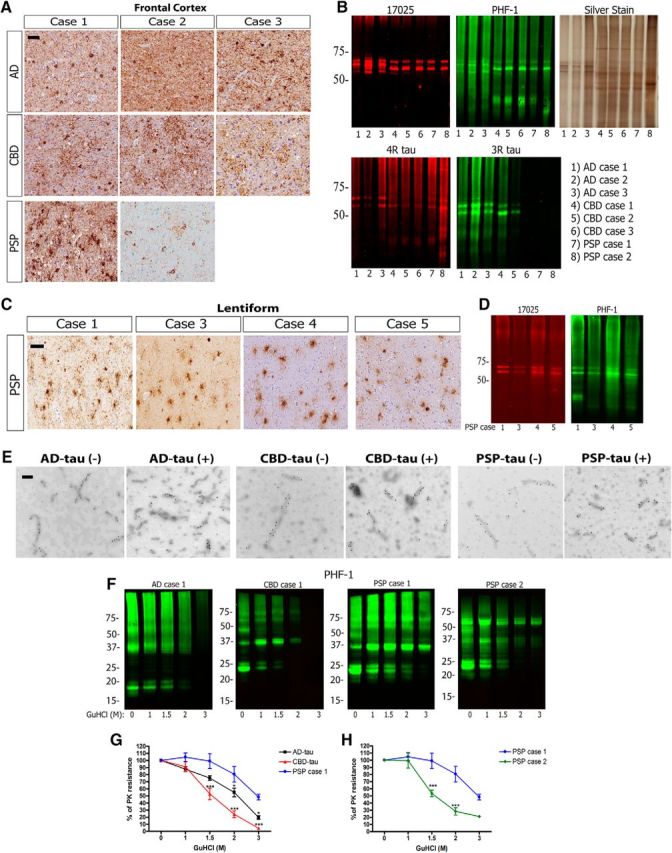
Biochemical characterization of tau strains from human tauopathy brains. A, IHC was conducted on sections of mid-frontal cortex with anti-tau MAb PHF-1 on all AD and CBD cases as well as PSP Case 1, and with MAb CP13 in PSP Case 2. Cases are identified by numbers corresponding to those in Table 1. Scale bar, 50 μm. B, Western blots were performed using anti-tau antibodies 17025 (red), PHF-1 (green), anti-4R tau from CosmoBio (red), and RD3 (green), plus silver staining, on final supernatants from sequential extraction of three AD, three CBD, and two PSP cases from A. Final supernatant blots are representative of multiple extractions from the same case (Table 2). C, IHC of the lentiform nucleus for PHF-1 from PSP cases. Scale bar, 50 μm. D, Western blots for 17025 (red) and PHF-1 (green) on final supernatants from sequential extraction of the lentiform nucleus of PSP cases from C. E, Immuno-EM for PHF-1 (1:300) on AD-tau fibrils (AD Case 3; 0.9 μg/μl), CBD-tau fibrils (CBD Case 2; 0.55 μg/μl), and PSP-tau fibrils (PSP Case 1; 0.625 μg/μl) before (−) and after (+) sonication. Scale bar, 100 nm. F, Representative Western blots for PHF-1 (green) on the GuHCl denaturation assay for one AD, one CBD, and two PSP cases. G, Whole-lane quantification of the PHF-1 signals for each concentration of GuHCl as a percentage of the initial sample (0 m GuHCl) is plotted as percentage PK resistance for each case. Two to three replicates of n = 3 cases of AD, n = 3 cases of CBD, and PSP Case 1 were used for this quantification. Two-way ANOVA with Bonferroni post hoc test was performed comparing PSP Case 1 to all other groups (Mean ± SEM plotted; Tauopathy factor: F = 21.96, df = 3, p = 0.0001; GuHCl concentration factor: F = 98.71, df = 4, p = 0.0001; Interaction: F = 3.739, df = 12, p = 0.0002; residual df = 70). Statistical significance is indicated at each concentration of GuHCl (m) where each tauopathy is compared with PSP Case 1 (*p < 0.05, **p < 0.01, ***p < 0.0001). H, The two cases of PSP were considered separately as they exhibited different properties using this assay. Whole-lane quantification of the PHF-1 signals for each concentration of GuHCl as a percentage of the initial sample (0 m GuHCl) is plotted as percentage PK resistance for two to three replicates of each PSP case. Statistics are the same as described in F.
Table 1.
Demographics of human cases used for study
| Case No. | Neuropathological diagnosis | Gender | Age at death | PMI, h | Disease duration, year |
|---|---|---|---|---|---|
| 1 | AD | F | 68 | 9 | 8 |
| 2 | AD | F | 59 | 14 | 9 |
| 3 | AD | M | 66 | 4 | 11 |
| 1 | CBD | M | 44 | 7 | Unknown |
| 2 | CBD | M | 52 | 8 | 4 |
| 3 | CBD | M | 56 | 15 | 6 |
| 1 | PSP | F | 63 | 6.5 | 5 |
| 2 | PSP | M | 74 | Unknown | Unknown |
| 3 | PSP | M | 65 | 13 | 10 |
| 4 | PSP | M | 78 | 23 | 9 |
| 5 | PSP | M | 71 | 14 | Unknown |
All human tauopathy cases used in the study, gender, age of death, post-mortem interval (PMI) (in hours), and disease duration (in years).
Briefly, for the purification of AD-tau and PSP-tau, 6–14 g of frontal cortical gray matter was homogenized in nine volumes (v/w) of high-salt buffer (10 mm Tris with 0.8 m NaCl, pH7.4) with 0.1% Sarkosyl and 10% sucrose added, and centrifuged at 10,000 × g for 10 min at 4°C. For CBD cases, both gray and white matter were homogenized in the high-salt buffer. Pellets were re-extracted twice using the same high-salt buffer and the supernatants from all three extractions were filtered and pooled. Additional Sarkosyl was added to the pooled supernatants to reach 1% and the samples were rotated for 1 h at RT. The samples were centrifuged at 300,000 × g for 60 min at 4°C and the resulted 1% Sarkosyl-insoluble pellets containing pathological tau were resuspended in PBS. The resuspended Sarkosyl-insoluble pellets were further purified by a brief sonication using a handheld probe (Qsonica), followed by centrifugation at 100,000 × g for 30 min at 4°C. The pellets were resuspended in PBS at 1/2 to 1/5 of the precentrifugation volume, sonicated, and spun at 10,000 × g for 30 min at 4°C to remove large debris (Guo et al., 2016a).
The final purified supernatants contained insoluble, pathological tau, and are identified as AD-tau, CBD-tau, and PSP-tau in subsequent experiments. The different fractions from each purification were analyzed by Western blotting, silver staining, and sandwich ELISA for tau as previously described (Fig. 1; Table 2; Guo et al., 2016a). The sandwich ELISA and Western blotting for tau in the final supernatant were used for estimates of tau concentration. The final supernatants were also analyzed by bicinchoninic acid (BCA) assay (Fisher) for total protein concentration, and sandwich ELISA for Aβ 1–40 and Aβ 1–42 levels, as previously described (Guo et al., 2016a; Table 2).
Table 2.
Final supernatant characterization of all cases used
| Preparation No. | Concentration of tau by ELISA, μg/ml | Total protein concentration by BCA assay, mg/ml | Purity, % (tau/total protein) | Concentration of Aβ 1–40 by ELISA, μg/ml | Concentration of Aβ 1–42 by ELISA, μg/ml |
|---|---|---|---|---|---|
| AD1 10/6/14 | 1800 | 6.5 | 28 | 0.02989 | 0.4683 |
| AD1 12/9/14 | 1500 | 10 | 15 | 0.05586 | 0.3241 |
| AD2 2/17/15 | 1270 | 8.3 | 15 | n.d. | 0.2618 |
| AD3 2/17/15 | 1360 | 12.5 | 11 | 0.05387 | 0.2610 |
| AD1 5/17/16 | 1960 | 9.42 | 21 | 0.0158 | 0.0379 |
| CBD1 10/14/14 | 400 | 17.1 | 2 | n.d. | 0.00481 |
| CBD3 4/14/15 | 172 | 17.3 | 1 | 0.00947 | 0.05321 |
| CBD2 3/18/15 | 560 | 21.5 | 3 | n.d. | 0.0097 |
| CBD1 5/11/16 | 240 | 40 | 0.6 | n.d. | n.d. |
| PSP1 11/10/14 | 360 | 19.2 | 2 | 0.01238 | 0.1828 |
| PSP2 4/20/15 | 30 | 15 | 0.002 | 0.0051 | 0.01892 |
| PSP2 3/28/16 | 91 | 5.12 | 2 | n.d. | n.d. |
| PSP1 3/17/16 | 141 | 9.24 | 2 | n.d. | 0.0041 |
| PSP1 5/12/16 | 270 | 23 | 1.7 | n.d. | 0.0689 |
| PSP1 7/8/14 lentiform | 31.9 | 15.3 | 0.002 | — | — |
| PSP 3 7/8/14 lentiform | 5 | 3.059561 | 0.002 | — | — |
| PSP 4 8/11/14 lentiform | 5 | 19.98607 | 0.0002 | — | — |
| PSP 5 3/16/16 lentiform | 7 | 22.23 | 0.031 | — | — |
Characterization of final supernatants (referred to as AD-tau, CBD-tau, and PSP-tau in text) with concentration of tau by ELISA, protein concentration by BCA, purity of tau, and concentration of Aβ 1–40 and 1–42 by ELISA. n.d., Not detectable.
Western blotting.
Samples were loaded on 7.5% SDS-PAGE, transferred to 0.2 μm nitrocellulose membranes, and blocked in Odyssey blocking buffer (Li-Cor Biosciences) or 5% milk diluted in TBS. Blots were incubated in appropriate primary antibodies overnight as indicated in each figure (Table 3), and then incubated with IRDye-labeled secondary antibodies and scanned using an ODY-2816 Imager.
Table 3.
Antibodies used in this study
| Antibody name | Specificity | Host species | Dilutions | Source |
|---|---|---|---|---|
| T49 | Mouse tau | Mouse monoclonal | 1:1000 (ICC, WB) | In-house (Kosik et al., 1988) |
| R2295 mTau | Mouse tau | Rabbit polyclonal | 1:1000 (ICC, WB) | (Guo et al., 2016a) |
| AT8 | Tau phosphorylation at Ser202 and Thr 205 | Mouse monoclonal | 1:10,000 (IHC), 1:5000 (IF), 1:2000 (EM) | ThermoFisher Scientific (RRID:AB_223647) |
| 17025 | Raised against recombinant human tau | Rabbit polyclonal | 1:1000 | In-house (Ishihara et al., 1999; RRID:AB_2315435) |
| Tau5 | Tau (aa 210–230) | Mouse monoclonal | 0.05 μg/μl (IP), 2.5 μg/ml as capture antibody in tau ELISA | Gift from Dr. Lester Binder (RRID:AB_663326) |
| PHF-1 | Tau phosphorylation at Ser396 and Ser404 | Mouse monoclonal | 1:1000 (WB), 1:2000 (IHC) | Gift from Dr. Peter Davies (Greenberg et al., 1992; RRID:AB_2313687) |
| Anti-4R tau | 4R tau | Rabbit polyclonal | 1:5000 | CosmoBio |
| RD3 | 3R tau | Mouse monoclonal | 1:1000 | Millipore (RRID:AB_310013) |
| MC1 | Tau in the pathological conformation | Mouse monoclonal | 1:1000 (IHC) | Gift from Dr. Peter Davies (Jicha et al., 1997a; RRID:AB_2314773) |
| AT180 | Tau phosphorylation at Thr231 | Mouse monoclonal | 1:1000 (IHC) | Thermo Fisher (RRID:AB_223649) |
| TG3 | Conformational specific tau phosphorylation at Thr231 | Mouse monoclonal | 1:250 (IHC) | Gift from Dr. Peter Davies (Jicha et al., 1997b) |
| GAPDH (6C5) | Glyceraldehyde-3-phosphate dehydrogenase | Mouse monoclonal | 1:3000 | Advanced Immunochemical |
| GFAP | Glial fibrillary acidic protein (astrocytes) | Rat polyclonal | 1:1000 (IF) | In-house (Lee et al., 1984) |
| Olig-2 | Oligodendrocyte marker | Rabbit polyclonal | 1:500 (IF) | Millipore (RRID:AB_570666) |
| 17028 | MAP2 | Rabbit polyclonal | 1:5000 (ICC) | In-house (Volpicelli-Daley et al., 2011) |
Description of all antibodies used in this study, including specific proteins/epitopes they recognize, concentrations used, and how they were procured.
Transmission EM for tau fibrils.
Immuno-electron microscopy (EM) for PHF-1 (kindly donated by Peter Davies; RRID:AB_2313687) was performed as previously described (Guo et al., 2016a). Briefly, samples were adsorbed onto carbon/Formvar-coated copper grids for 5 min, then washed three times for 5 min each by floating the grids on drops of PBS. Samples were blocked for 5 min by floating on blocking buffer containing 10% BSA, 1% fish gelatin, and 0.02% sodium azide in PBS. The grids were incubated with PHF-1 (1:300, diluted in blocking buffer) for 1–2 h, followed by three times of 5 min wash on PBS drops and 5 min on blocking buffer. The grids were incubated with anti-mouse secondary antibody conjugated to 6 nm colloidal gold (Jackson ImmunoResearch Laboratories) for 1–2 h, and then the grids were negatively stained using 2% uranyl acetate. All EM pictures were taken with a JEOL1010 electron microscope.
GuHCl denaturation assay.
AD-tau, CBD-tau, and PSP-tau (250 ng) were denatured with the following concentrations of guanidine hydrogen chloride (GuHCl) for 30 min at 37°C: 0 m, 1 m, 1.5 m, 2 m, and 3 m. The samples were diluted 1:3 and then digested with 1 μg/μl of proteinase K (PK) for 30 min at 37°C, followed by centrifugation at 45,000 rpm for 30 min. The pellets were resuspended in 20 μl of sample buffer and run on 12% Bis-Tris gels, followed by Western blotting for tau phosphorylated at serine 396/401 with PHF-1. The PHF-1 signal was quantified using Li-Cor Image Studio software.
Primary neuron cultures.
E16–E18 embryos from pregnant CD1 mice were used to generate primary neuron cultures. Dissociated hippocampal tissues were digested with papain (Worthington Biochemical), triturated, and strained into single neurons using Falcon Cell Strainer (BD Biosciences). They were then plated onto coverslips precoated with poly-d-lysine (Sigma-Aldrich) diluted in borate buffer (0.05 m boric acid, pH 8.5) at 100,000 cells per coverslip on 24-well plates or 375,000 cells per well on 12-well plates for biochemistry. Neurons on day 6 or 7 in vitro were treated with tau fibrils from AD-tau, CBD-tau, or PSP-tau that had been sonicated for 60 pulses with a handheld probe. Immunocytochemistry and/or biochemical extractions were performed at 15 or 19 d after fibril treatment.
Immunocytochemistry.
Neurons were fixed with either cold 100% methanol or 4% paraformaldehyde (PFA) with 1% Triton X-100 for 15 min to remove soluble tau. Tau staining was performed with the primary tau antibodies described in each figure overnight (Table 3), followed by incubation with appropriate AlexaFluor-conjugated secondary antibodies the next day. Coverslips were mounted using Fluoromount-G containing DAPI (Southern Biotech) to label cell nuclei. An Olympus BX 51 microscope equipped with a digital camera DP71 and DP manager (Olympus) was used to acquire immunofluorescence images. For the quantification of the tau pathology, whole coverslips were scanned using a Lamina Multilabel Slide scanner (PerkinElmer) and quantified using the image analysis platform HALO (Indica Labs).
Extraction of neurons for biochemistry.
To investigate the tau composition of insoluble tau in neurons seeded with AD-tau, CBD-tau, or PSP-tau, neurons in 12-well plates were scraped into 1% Sarkosyl lysis buffer (1% Sarkosyl in 50 mm Tris, 150 mm NaCl, pH 7.6) and centrifuged at 100,000 × g for 30 min at 4°C. The supernatants were the Sarkosyl-soluble fraction (Fig. 2C; “sup”), whereas pellets were resonicated in 1% Sarkosyl lysis buffer and centrifuged at 100,000 × g for 30 min at 4°C. The pellets were resuspended and sonicated in DPBS at 1/3 of the initial volume, as the Sarkosyl-insoluble fraction (Fig. 2C; “pel”). Protein concentration in the “Sarkosyl-soluble” fractions was determined using BCA assay, and Western blots were loaded with equal total protein concentration.
Figure 2.
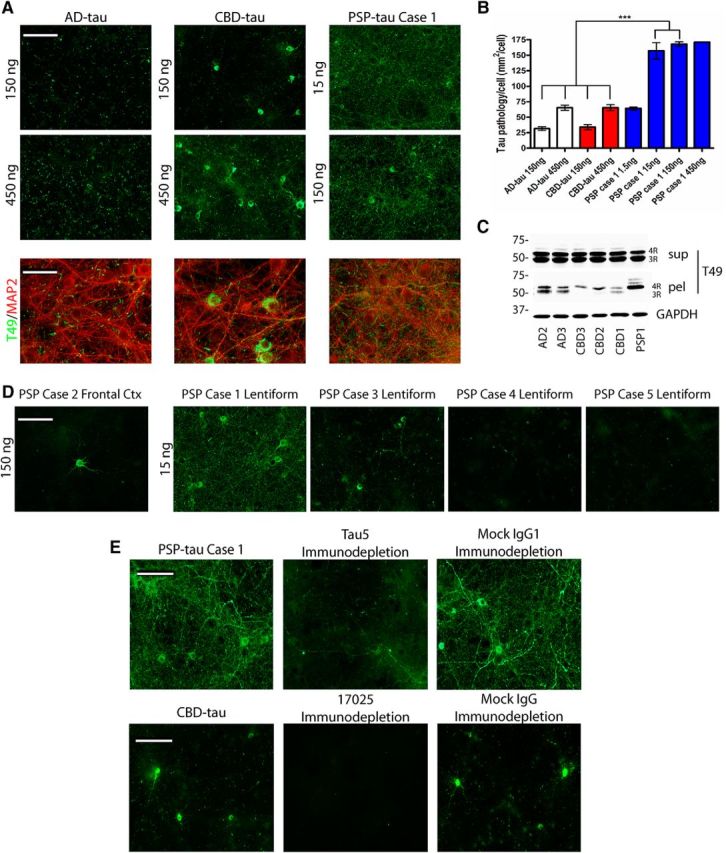
Human tauopathy lysates seeding endogenous mouse tau in primary non-Tg neurons. A, Left, Top, Representative images from immunocytochemistry (ICC) studies for anti-mouse tau-specific MAb T49 (green) on primary non-Tg hippocampal neurons treated with two different amounts of pathological tau from AD, CBD, and PSP cases (note: the PSP case is Case 1 only). Left, Bottom, Images from ICC for T49 (green) and MAP2 (red) overlay from AD-tau, CBD-tau and PSP-tau-treated neurons. Scale bar, 100 μm. B, Quantification of percentage area occupied by T49 signal/DAPI signal from ICC of neurons treated with AD-tau from three cases of AD (2 replicates), CBD-tau from three cases of CBD (2 replicates), and PSP-tau from one case of PSP (Case 1; 2 replicates) at different tau concentrations. One-way ANOVA with Tukey post hoc test comparing all groups was performed (Mean ± SEM plotted; F = 86.49, df = 24; *p < 0.05, **p < 0.01, **p < 0.001). C, Western blot for T49 on Sarkosyl-soluble supernatants (sup) and Sarkosyl-insoluble pellets (pel) extracted from neurons treated with AD-tau, CBD-tau, or PSP-tau. Western blot for GAPDH as loading control. D, Representative images from ICC for T49 (green) on primary non-Tg hippocampal neurons treated with PSP-tau from five different PSP cases. PSP Cases 1, 3, 4, and 5 were used to treat neurons with 15 ng of Sarkosyl pellet from the lentiform nuclei, and PSP Case 2 was used to treat neurons with 150 ng of final supernatant from frontal cortex. Scale bar, 100 μm. E, Top, Images are shown here of ICC for T49 from primary non-Tg hippocampal neurons treated with 200 ng of PSP-tau, or Tau5-immunodepleted PSP-tau from Case 1, or mock IgG-treated PSP-tau from Case 1. Bottom, Representative images are shown here of ICC for T49 from primary non-Tg hippocampal neurons treated with 100 ng of CBD-tau from n = 3 cases, or 17025-immunodepleted CBD-tau, or mock IgG-treated CBD-tau. Scale bar, 100 μm.
Immunodepletion of tau from PSP lysates.
Immunodepletion of tau from PSP and CBD lysates was performed as previously described (Guo et al., 2016a). Briefly, anti-tau monoclonal antibody Tau5 (Giasson et al., 2003) or anti-tau polyclonal antibody 17025 was conjugated covalently to Protein G Dynabeads (Invitrogen) by incubating 10 μg of Tau5 or 17025 with dynabeads for 1 h at RT with rotation. PSP-tau (200 ng) or CBD-tau (500 ng) in 200 μl dPBS each was incubated with the Tau5/bead (PSP-tau) or 17025/bead (CBD-tau) complex overnight at 4°C with rotation. Mock immunodepletion was performed with a mouse IgG1 antibody in a similar manner as above. The unbound fraction was separated from the antibody/beads using a magnet, and the bound fraction was boiled in SDS sample buffer for 10 min to separate the proteins from the beads. Primary non-Tg neurons were treated with initial sample containing 20 ng of PSP-tau or 100 ng CBD-tau, unbound fraction of the Tau5 or 17025 sample (immunodepleted of tau), and the unbound fraction of the IgG1 sample (mock immunodepletion) for 15 d. Immunocytochemistry for endogenous mouse tau using the mouse tau-specific mAb T49 was performed as described above.
Animals.
CD1 and C57BL/6 mice were purchased from Charles River Laboratories. Embryos from pregnant CD1 females were used to generate primary hippocampal neurons. Two to 3-month-old female C57BL/6 mice (non-Tg) were used for intracerebral inoculation of AD-tau, CBD-tau, or PSP-tau human brain lysates. The University of Pennsylvania's Institutional Animal Care and Use Committee approved all animal protocols.
Stereotaxic surgery on mice.
Stereotaxic surgery on non-Tg mice was performed as previously described (Iba et al., 2013). Briefly, 2- to 3-month-old non-Tg mice were deeply anesthetized with ketamine/xylazine/acepromazine and immobilized in a stereotaxic frame. The mice were aseptically inoculated with human brain extracts in the dorsal hippocampus and overlying cortex of one hemisphere (bregma: −2.5 mm; lateral: +2 mm; depth: −2.4 mm and −1.4 mm from the skull) or the thalamus (bregma: −2.5 mm; lateral: +2 mm; depth: −3.4 mm from the skull; see Fig. 8). For the hippocampus and cortex injections, each site received 2.5 μl of inoculum, and the thalamus injection received 4 μl of inoculum. Concentrations of tau per injection site for AD-tau, CBD-tau, and PSP-tau are described for each figure.
Figure 8.
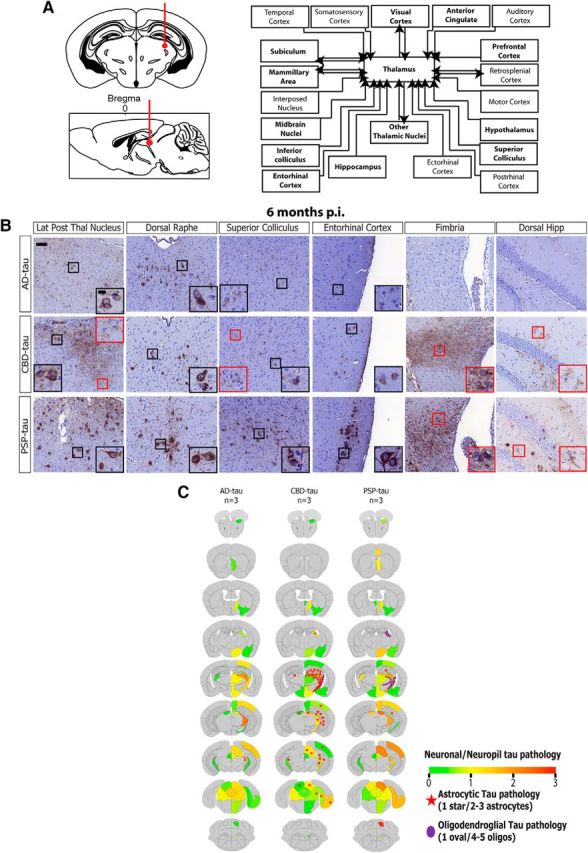
Spatiotemporal transmission of tau pathology from additional injection site in non-Tg mice. A, Left, Schematic coronal and sagittal sections of the mouse brain showing dorsal thalamus injection site (bregma based coordinates: −2.5 mm; lateral: +2 mm; depth: −3.4 mm from the skull). Right, Anatomical neuronal connectome showing anterograde and retrograde connections from the dorsal thalamus. Brain regions with seeded tau pathology are bolded. B, Representative images from IHC for AT8 for AD-tau- (6.4 μg/site; n = 3 mice), CBD-tau- (0.64 μg/site; n = 3 mice), and PSP-tau- (1.1 μg/site; n = 3 mice) injected non-Tg mice 6 months p.i. Scale bars: panel, 50 μm; inset, 10 μm. C, Semiquantitative heat maps were created as described in Figures 4 and 7 on AD-tau-, CBD-tau-, and PSP-tau-injected mice into the thalamus 6 months p.i.
Immunohistochemistry and immunofluorescence.
Injected mice were killed and analyzed via immunohistochemistry (IHC) and immunofluorescence (IF) as previously described (Iba et al., 2013). In brief, mice were intracardially perfused at 1, 3, 6, or 9 months postinjection, with brains and spinal cords fixed in 10% neutral buffered formalin overnight. Brains and spinal cords were then embedded in paraffin and microtome sectioned at 6 μm, followed by IHC for various anti-tau primary antibodies (for details, see figure legends and Table 3). The next day, the sections were developed using a polymer horseradish peroxidase detection system (BioGenex) with counterstaining for hematoxylin. Stained slides were scanned using the Lamina Multilabel Slide Scanner (PerkinElmer) to obtain images. Double-labeling IF was performed with two primary antibodies incubated on tissue sections overnight, followed by incubation with secondary antibodies conjugated to AlexaFluor (anti-mouse, anti-rabbit, or anti-rat based on primary antibody; Table 3). Thioflavin S (ThS) amyloid binding dye and AT8 IF for double-labeling for tau amyloid deposits were performed as previously described (Guo et al., 2016a). Coverslips were mounted with Fluoromount-G containing DAPI, and images were acquired using Nikon Eclipse DSQi1MC microscope.
Semiquantitative analysis was performed as previously described (Guo et al., 2016a), with AT8-positive pathology scored on a scale of 0–3 (0: no pathology; 3: high pathology) at six coronal sections (bregma 0.98 mm, −2.18 mm, −2.92 mm, −3.52 mm, −4.96 mm and −5.52 mm) for each mouse. Scores were averaged across all mice at each time point and then imported into customized software to generate color-coded heat maps of the spatial distribution of pathology. Quantitative analysis was performed using Halo software, with stereological cell counts for AT8-positive neuronal and glial pathology in brain regions as described in each figure.
Experimental design and statistical analysis.
For the GuHCl assay, independent experiments of two to three batches of AD-tau from n = 3 cases, two to three batches of CBD-tau from n = 3 cases, and two to three batches of PSP-tau from n = 2 cases were conducted. Data are plotted as mean ± SEM of independent experiments (2–3 batches) of n = 3 AD cases, n = 3 CBD cases, and n = 2 PSP cases (plotted separately). Two-way ANOVA with Bonferroni post hoc test was performed comparing PSP Case 1 to all other groups with GraphPad Prism 4.0 software (RRID:SCR_002798; Fig. 1). P values <0.05 were considered statistically significant.
For the seeding of primary non-Tg neuron cultures, two batches of n = 3 cases of AD, two batches of n = 3 cases of CBD, and two batches of n = 1 case of PSP were tested, and data are plotted as mean ± SEM across batches of all cases (Fig. 2). One-way ANOVA with Tukey post hoc test was performed comparing all groups with GraphPad Prism software. P values <0.05 were considered statistically significant.
The number of mice used for all in vivo experiments is described in Table 4. For quantification of IHC, two to three sections per mouse per region were quantified for AT8+ cells as specified in each figure. Total number of AT8+ cells per mouse per region was plotted as mean ± SEM. IHC quantification results were analyzed across mice using one-way ANOVA with Tukey or Bonferroni post hoc tests or linear regression with GraphPad Prism software, with each statistical test described per figure. P values <0.05 were considered statistically significant.
Table 4.
Number of mice used in injection experiments
| Tauopathy case | Extraction brain region | Injection brain region | 1 month p.i. | 3 months p.i. | 6 months p.i. | 9 months p.i. |
|---|---|---|---|---|---|---|
| AD Case 1 | Frontal | HP/Ctx | 3 | 3 | 4 | 3 |
| AD Case 1 | Frontal | Thalamus | — | — | 3 | — |
| AD Case 2 | Frontal | HP/Ctx | — | 3 | — | — |
| AD Case 3 | Frontal | HP/Ctx | — | 3 | — | — |
| CBD Case 1 | Frontal | HP/Ctx | 2 | 4 | 4 | 4 |
| CBD Case 1 | Frontal | Thalamus | — | — | 3 | — |
| CBD Case 2 | Frontal | HP/Ctx | — | 3 | — | — |
| CBD Case 3 | Frontal | HP/Ctx | — | 3 | — | — |
| PSP Case 1 | Frontal | HP/Ctx | 2 | 4 | 4 | 3 |
| PSP Case 1 | Frontal | Thalamus | — | — | 3 | — |
| PSP Case 1 | Thalamus | HP/Ctx | — | 4 | — | — |
| PSP Case 1 | Lentiform | HP/Ctx | — | 3 | — | — |
| PSP Case 2 | Frontal | HP/Ctx | — | 4 | — | — |
Number of mice injected with each tauopathy case (extracted from different brain regions) at different time points. HP, Hippocampus; Ctx, cortex.
Results
Biochemical differences between tau strains from human brains
Cases of AD, CBD, and PSP with abundant frontal cortical pathology were identified as brain tissue sources for the preparation of tau extracts (Fig. 1A). Of note, the two PSP cases selected for pathological tau extraction from the frontal cortex were unusual for their high abundance of cortical tau pathology. The frontal cortex was selected for extraction from all cases so that sufficient brain material is available to enrich for enough pathological tau in the final lysate to perform multiple experiments. The cortical samples underwent sequential extraction to enrich for insoluble, pathological AD-tau, PSP-tau, and CBD-tau (Guo et al., 2016a; Tables 1, 2). Previous work from our laboratory showed by Western blots that tau protein isoforms are the most dominant immunobands in the AD-tau preps (Guo et al., 2016a); in contrast, CBD-tau and PSP-tau have lower tau purity in the final supernatant (1–3%; Table 2).
As previously shown (Guo et al., 2016a), AD-tau contains all six isoforms of tau with three prominent bands (17025 red; Fig. 1B) comprised of both 3R and 4R tau (Fig. 1B). In contrast, CBD-tau and PSP-tau contain primarily 4R tau isoforms with two prominent bands (17025 red; Fig. 1B). Consistent with prior studies (Lee et al., 2001), pathological tau from all cases was hyperphosphorylated as indicated by prominent PHF-1 immunoreactivity (green). The three CBD cases used here contained insoluble tau composed primarily of 4R tau with varying levels of 3R tau, as indicated by Western blotting for 4R and 3R tau-specific antibodies (Fig. 1B). This phenomenon has been described in the literature and could be due to overlapping AD pathology in the frontal cortex of these CBD cases (Forman et al., 2002; Yoshida, 2006; Uchihara et al., 2011). Given that abundant frontal cortical pathology is not common in PSP, we extracted Sarkosyl-insoluble pathological tau (without further purification) from the lentiform nucleus (representing the putamen and globus pallidus) of four PSP cases, as tau pathology is nearly always abundant in this region in PSP (Fig. 1C). Western blots show two prominent tau bands in the insoluble Sarkosyl pellet from the lentiform nucleus of all PSP cases (17025 red), with hyperphosphorylation of tau (PHF-1 green; Fig. 1D) although the concentration of tau in the Sarkosyl pellet from the lentiform nucleus is much lower than from the frontal cortex (Table 2). Immuno-EM for PHF-1 on AD-tau, CBD-tau, and PSP-tau fibrils before and after sonication shows shorter and more numerous fibrils after sonication as previously shown (Guo et al., 2016a).
In the prion literature, different strains are characterized by various biochemical studies, including limited proteolysis and conformational stability assays using different concentrations of GuHCl (Collinge and Clarke, 2007). A previous study showed differences in C-terminal tau fragments following protease digestion of Sarkosyl-insoluble tau from AD, CBD, and PSP brains, similar to what is observed for different prion strains (Taniguchi-Watanabe et al., 2016), Here, we performed a conformational stability assay using GuHCl as previously described (Legname et al., 2006). Specifically, we incubated AD-tau, CBD-tau, and PSP-tau in increasing concentrations of GuHCl, then performed PK digestion followed by Western blotting for PHF-1 to determine the presence of protease-resistant bands at each concentration (Fig. 1F).
Interestingly, AD-tau, CBD-tau, and PSP-tau showed different banding patterns after PK digestion without GuHCl (Fig. 1F, lane 0 m GuHCl). AD-tau had smaller tau fragments ranging from 15 to 20 kDa, whereas CBD-tau and PSP-tau had larger tau fragments ∼25 kDa (AD-tau and CBD-tau are representative images of n = 3 AD cases and n = 3 CBD cases, respectively). We then plotted the percentage (%) PK resistance for each tau strain as a function of the GuHCl concentration, normalizing the PHF-1 signal in each lane to the sample with GuHCl-free digestion (lane 0 m GuHCl). A steeper decline in percentage PK resistance suggests higher susceptibility of the tau aggregates to denaturation by GuHCl.
AD-tau, CBD-tau, and PSP-tau showed different structural stabilities in this GuHCl denaturation assay based on curves shown in Figure 1G (two-way ANOVA with Bonferroni post hoc test, F = 3.739, p = 0.0002). All cases of CBD-tau were the least stable (Fig. 1G, red line; steepest decline), whereas all cases of AD-tau showed intermediate stability in this assay (Fig. 1G, black line). PSP-tau from Case 1 showed the highest stability in GuHCl (Fig. 1G, blue line). However, PSP-tau from Case 2 showed much less stability than PSP-tau Case 2, suggesting the existence of different PSP-tau conformations in these two cases (Fig. 1H). Nonetheless, both PSP Cases 1 and 2 had similar banding patterns after PK digestion, suggesting they share some strain properties and not others. Together, our data show different biochemical properties of AD-tau, CBD-tau, and PSP-tau indicative of different strains of pathological tau among AD, CBD and PSP tauopathies.
Tau strain seeding in primary non-Tg neuronal cultures
To determine the biological activity of the different tau strains, AD-tau, CBD-tau and PSP-tau were used to seed the aggregation of endogenous mouse tau in non-Tg primary hippocampal neurons, which initially express 3R tau and subsequently express 4R tau with differentiation in culture, as previously described (Guo et al., 2016a). We found phenotypic differences in the subcellular localization of seeded tau aggregates (recognized by mouse-tau-specific T49 antibody after extraction of soluble tau with 4% PFA and 1% Triton X-100) in these neurons corresponding to each tau strain: AD-tau induced thread-like immunoreactivity mostly in axons with rare perikaryal inclusions, whereas CBD-tau induced frequent perikaryal inclusions apart from axonal pathology (Fig. 2A). Strikingly, PSP-tau from Case 1 was the most potent, inducing much more abundant axonal and perikaryal inclusions at the same concentrations as AD-tau and CBD-tau. In fact, PSP-tau from this case was ∼300 times more potent than AD-tau or CBD-tau (Fig. 2B; one-way ANOVA with Tukey post hoc test, F = 86.49).
Tau aggregates formed in neurons were Sarkosyl-insoluble and recruited tau isoforms corresponding to the original human cases. For example, AD-tau-treated neurons recruited both 3R and 4R tau into the insoluble fraction, and PSP-tau-treated neurons recruited only 4R tau. Two cases of CBD-tau with primarily 4R tau in the final human supernatant recruited only 4R tau in the insoluble fraction, whereas one case of CBD-tau with more 3R tau in the final supernatant recruited both 4R and 3R tau (Fig. 2C). Interestingly, not all cases of PSP were highly potent in vitro, as PSP Case 2 with tau extracted from the frontal cortex and other PSP cases with tau extracted from the lentiform nucleus failed to induce significant tau pathology in primary neurons (Fig. 2D). Thus, our data suggest tau from different PSP brains may contain different tau strains, including the highly potent one described above.
To confirm that it is human tau that is accountable for inducing mouse tau pathology in cultured neurons, we immunodepleted tau from our potent PSP-tau prep (PSP Case 1), and showed a dramatic loss of seeding activity in non-Tg neurons (Fig. 2E, top). Similarly, we immunodepleted tau from three cases of CBD-tau, and showed a reduction in seeding activity in non-Tg neurons. Therefore, we conclude insoluble human tau in the final supernatant is necessary for seeding endogenous mouse tau in non-Tg neurons.
Seeding potency and cell-type specificity of human pathological tau in non-Tg mice
To test whether different tau strains would lead to different patterns of endogenous mouse tau aggregation in vivo, comparable concentrations of AD-tau, CBD-tau, and PSP-tau were injected into the dorsal hippocampus and overlying neocortex of non-Tg mice (Fig. 3A). Following postinjection (p.i.) survival intervals of 3 months, we observed differences in seeding potency between the different pathological tau strains in vivo. The unusual PSP-tau strain (Case 1) was most potent in propagating neuronal tau aggregates to several different brain regions at 3 months p.i. (Fig. 3A). Replicate studies using AD-tau, CBD-tau, and PSP-tau extracts obtained from different cases resulted in a similar neuroanatomic distribution and density of tau pathology (Fig. 3B). Interestingly, the second PSP case with abundant frontal cortical pathology also showed high potency in vivo (Case 2; Fig. 3B), suggesting pathological tau purified from PSP-tau cases with extensive frontal cortical tau pathology are potent seeds in vivo.
Figure 3.
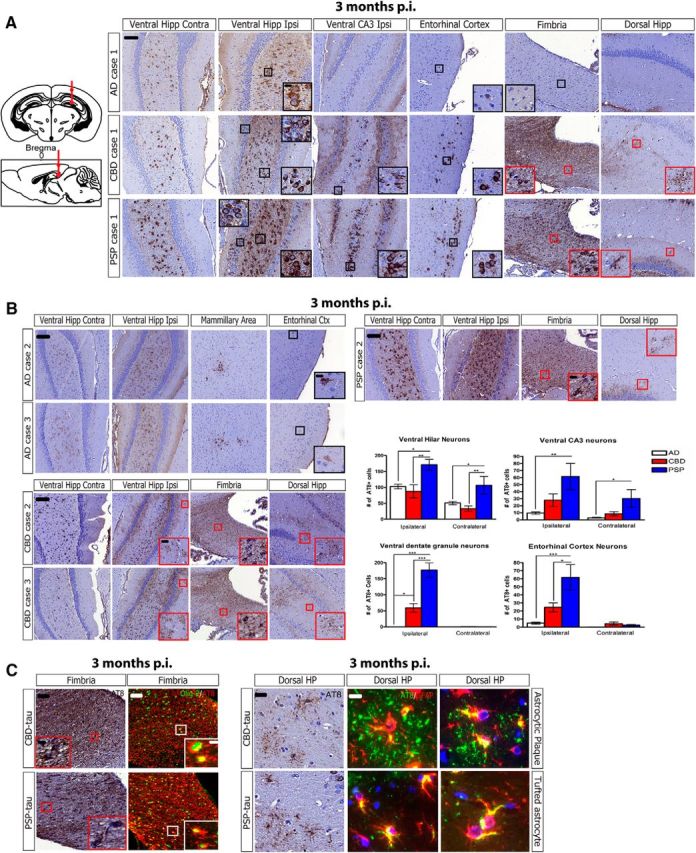
Different seeding potencies and cell-type specificity of human tau strains in non-Tg mice. A, Top, Left, Schematic coronal and sagittal sections of the mouse brain showing injection sites in dorsal hippocampus and overlying cortex (bregma: −2.5 mm; lateral: +2 mm; depth: −2.4 mm and −1.4 mm from the skull). Right, Representative images from IHC for anti-tau MAb AT8 (pS202/T205) for AD-tau Case 1 (1 μg/site, n = 3 mice), CBD-tau Case 1 (1 μg/site, n = 4 mice), and PSP-tau Case 1 (0.7 μg/site, n = 4 mice) injected non-Tg mice 3 months p.i. (hippocampus/cortex). Black boxes with insets indicate neuronal tau pathology and red boxes with insets indicate glial tau pathology. Scale bars: panel, 100 μm; inset, 10 μm. B, Representative images of IHC for AT8 on two additional cases of AD-tau injections (each injection at 1 μg/site, n = 3 mice each), two additional cases of CBD-tau injections (Case 2: 0.43 μg/site, n = 3 mice; Case 3: 0.9 μg/site, n = 3 mice), and one additional case of PSP-tau injections (Case 2: 0.21 μg/site, n = 4 mice) into non-Tg mice at 3 months p.i. Black boxes with insets indicate neuronal tau pathology and red boxes with insets indicate glial tau pathology. Quantification performed on two sections for each region on three AD cases (n = 9 mice total; white bars), three CBD cases (n = 10 mice total; red bars), and two PSP cases (n = 8 mice total; blue bars) with the following bregma based on brain atlas coordinates: ventral hilar and DG neurons: −3.80 and −3.64 mm; ventral CA3: −3.40 and −3.28 mm; entorhinal cortex: −3.80 and −3.64 mm. One-way ANOVA with Tukey post hoc analysis was performed for each region (Mean ± SEM plotted; ventral hilus ipsi: F = 6.593, df = 25, ANOVA, p = 0.0055; ventral hilus contra: F = 6.474, df = 25, ANOVA, p = 0.0059; DG ipsi: F = 38.33, df = 25, ANOVA, p = 0.0001; Ventral CA3 ipsi: F = 5.682, df = 25, ANOVA, p = 0.0099; Ventral CA3 contra: F = 5.05, df = 25, ANOVA, p = 0.0152; Entorhinal Cortex ipsi: F = 11.12, df = 25, ANOVA, p = 0.0004; Tukey post hoc: *p < 0.05, **p < 0.01, ***p < 0.001). Scale bars: panel, 100 μm; inset, 10 μm. C, Left, Representative images of IHC for AT8 or double-labeling IF for AT8 (red) and anti-oligodendrocyte-specific marker Olig-2 (green) from CBD-tau (1 μg/site; n = 4 mice) and PSP-tau (0.7 μg/site; n = 4 mice)-injected mice 3 months p.i. Insets show formation of AT8-positive inclusions in oligodendrocytes of fimbria (white matter tract). Scale bars: panel, 50 μm; inset, 10 μm. Right, Representative images of IHC for AT8 or double-labeling IF for AT8 (green) and anti-astrocyte-specific marker GFAP (red) from CBD-tau- (1 μg/site; n = 4 mice) and PSP-tau-(0.7 μg/site; n = 4 mice) injected mice 3 months p.i. Images show formation of AT8-positive inclusions in astrocytes of the hippocampus. Scale bars: panel, 50 μm; inset, 20 μm. Hipp, Hippocampus; Ctx, cortex; Ipsi, ipsilateral, Contra, contralateral; DG, dentate gyrus.
In contrast, all AD-tau and CBD-tau cases induced less extensive tau pathology than the PSP-tau cases at 3 months p.i. (Fig. 3A,B). CBD-tau seeded fewer neuronal tau aggregates than PSP-tau in the same brain regions (n = 3 CBD cases), whereas AD-tau was the least potent, only eliciting tau aggregates in a subset of neurons in select brain regions (n = 3 AD cases). Both PSP-tau and CBD-tau seeded tau aggregates in more neuronal subtypes in the hippocampus (i.e., dentate granule, hilar neurons, and CA3 neurons) than AD-tau (which primarily induced tau pathology in hilar neurons; Fig. 3A,B).
All three tau strains also maintained cell-type specificity for neurons or glia as in their corresponding human disease. Thus, AD-tau induced tau aggregates only in neurons, whereas both PSP-tau and CBD-tau induced tau aggregates in oligodendrocytes and astrocytes, in addition to neurons (Fig. 3A,C). The glial tau inclusions in non-Tg mice recapitulated the corresponding human tau neuropathology: oligodendroglial inclusions occurred in white matter tracts such as the fimbria and corpus callosum and resembled oligodendroglial coiled bodies of human CBD and PSP (Fig. 3C, left; colabeling AT8 and Olig-2). Astrocytic tau inclusions in CBD-injected mice resembled astrocytic plaques of human CBD, whereas most of the astrocytic tau pathology in PSP-injected mice resembled tufted astrocytes of human PSP (Fig. 3C, right; colabeling AT8 and GFAP). However, the PSP-tau-injected mice showed a range of astrocytic tau pathologies ranging from astrocytic plaque-like profiles to tufted-astrocyte-like tau inclusions (Fig. 3B), thereby showing some overlap with CBD as described previously (Sha et al., 2006; Yoshida, 2014).
Rate of propagation and maturation of tau aggregates in non-Tg mice
Because one of our PSP-tau strains induced highly extensive tau pathology at 3 months p.i., we hypothesized it more efficiently seeded tau pathology than AD-tau at earlier time points. Indeed, more neuronal tau aggregates were observed at 1 month p.i. of PSP-tau in the ventral hilus of the hippocampus than following injections of AD-tau at the same time interval (Fig. 4A, black boxes). In fact, both CBD-tau and PSP-tau induced glial tau aggregates in astrocytes and oligodendrocytes at 1 month p.i., thereby showing a fast rate of glial tau pathology formation for PSP-tau and CBD-tau strains (Fig. 4A, red boxes). Furthermore, the ventral hilus was the only brain region with tau inclusions at 1 month p.i., confirming our previous findings that it may be selectively vulnerable in this model (Guo et al., 2016a).
Figure 4.
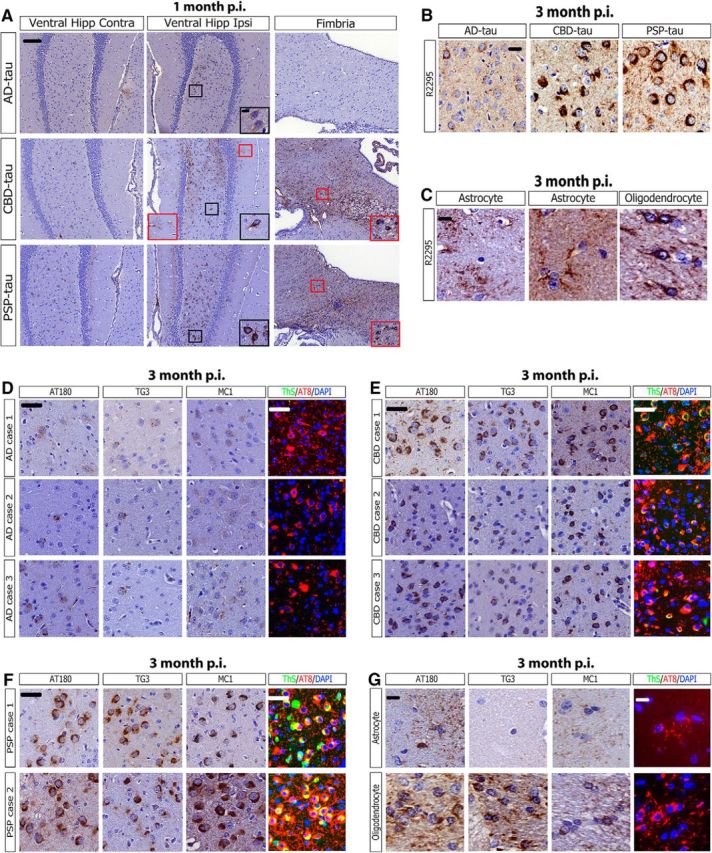
Early recruitment and maturation of tau aggregates in non-Tg mice. A, Representative images from IHC for AT8 for AD-tau- (1 μg/site; n = 3 mice), CBD-tau- (0.4 μg/site; n = 2 mice), and PSP-tau- (0.7 μg/site; n = 2 mice) injected non-Tg at 1 month p.i. (hippocampus/cortex). Black boxes with insets indicate neuronal tau pathology and red boxes with insets indicate glial tau pathology. Scale bars: panel, 100 μm; inset, 10 μm. B, Representative IHC images for AT8 near injection site and R2295 (mouse tau-specific antibody) for AD-tau- (1 μg/site; n = 3 mice), CBD-tau- (1 μg/site; n = 4 mice), and PSP-tau- (0.7 μg/site; n = 4 mice) injected non-Tg mice 3 months p.i. Scale bar, 50 μm. C, R2295 also recognizes glial tau pathology in astrocytes and oligodendrocytes, indicating endogenous mouse tau is seeded in glial cells. Left, Astrocytic plaque-like pathology from CBD-tau-injected mice. Middle, Tufted astrocyte-like pathology from PSP-tau-injected mice. Right, Oligodendroglial coiled body-like pathology from PSP-tau-injected mice. Scale bar, 20 μm. D, Representative images of IHC for anti-tau MAb AT180, MC1, and TG3 or IF for AT8 and ThS of the ventral hilus for the three AD cases injected into non-Tg mice 3 months p.i. Scale bar, 50 μm. E, Representative images of IHC for AT180, MC1, and TG3 or for AT8/ThS of the ventral hilus for the three CBD cases injected into non-Tg mice 3 months p.i. Scale bar, 50 μm. F, Representative images of IHC for AT180, MC1, and TG3 or for AT8/ThS of the ventral hilus for the two PSP cases injected into non-Tg mice 3 months p.i. Scale bar, 50 μm. G, Representative images of IHC for AT180, MC1, and TG3 or for AT8/ThS of astrocytes (CBD-tau Case 1 injected non-Tg mice 3 months p.i.) or oligodendrocytes (PSP-tau Case 1 injected non-Tg 3 months p.i.). Scale bar, 20 μm. Hipp, Hippocampus; Ipsi, ipsilateral; Contra, contralateral.
Because the injected human pathological tau is rapidly degraded by 7 d p.i. (Guo et al., 2016a), we infer that the injected human material rapidly recruits endogenous mouse tau (R2295, mouse-tau-specific antibody) to form seeded aggregates for all three tau strains (Fig. 4B). Both the neuronal and glial tau pathology in PSP-tau and CBD-tau-injected mice were positive for R2295, showing that endogenous mouse tau had aggregated in neurons and glia in our model (Fig. 4C).
We next investigated the differential recognition of the human tau strain-seeded mouse tau aggregates by a panel of anti-tau antibodies. When tau becomes hyperphosphorylated, it is recognized by phosphorylation-specific antibodies such as AT8 (pSer202/Thr205) and AT180 (pThr231; Ballatore et al., 2007). Then as tau misfolds and aggregates, it is recognized by conformation-specific antibodies MC1 (misfolded conformation around interaction of N- and C-terminus of tau) and TG3 (misfolded conformation around pThr231 site; Jicha et al., 1997a, 1997b). Finally, as tau aggregates mature into neurofibrillary tangles comprised of cross β-sheet structures, they are recognized by amyloid-binding dyes like ThS (Ballatore et al., 2007).
A small subset of AD-tau-seeded neuronal tau aggregates were weakly positive for AT180, TG3, and MC1 at 3 months p.i.; however, none of them were ThS+ at this time point (Fig. 4E). This suggests AD-tau induced mouse tau aggregates are in a prefibrillar, pretangle state at this time point. In contrast, CBD-tau-induced aggregates were strongly AT180+, MC1+, and TG3+ at 3 months p.i., whereas only rare tau inclusions were ThS+ (Fig. 4F). PSP-tau induced the most mature neuronal tau tangles that were AT180+, MC1+, TG3+, and ThS+ at 3 months p.i. (Fig. 4G). The differential recognition by anti-tau antibodies of the seeded pathology is indicative of unique and diverse tau strains between AD-tau, CBD-tau, and PSP-tau. The astrocytic tau pathology in CBD-tau-injected mice were AT180+ and mildly MC1+, whereas the oligodendroglial tau inclusions were AT180+, MC1+ and TG3+ (Fig. 4H). None of the glial tau aggregates were ThS+.
Characterization of a uniquely aggressive PSP-tau strain
The high in vivo potency of both PSP cases with abundant frontal cortical pathology suggests that either PSP-tau cases with extensive frontal cortical tau pathology contain a highly potent tau strain in all brain regions with pathology, or that a high potency strain is preferentially found in the frontal cortex of PSP cases. To test the hypothesis that PSP cases with extensive frontal cortical pathology contain a highly potent tau strain throughout the human brain, pathological tau was extracted from both the thalamus and lentiform nucleus of one of the potent PSP cases (PSP Case 1), and injected into the hippocampus and cortex of non-Tg mice. At 3 months p.i., PSP-tau extracted from the thalamus showed a transmission pattern in the mouse brain that was nearly identical to PSP-tau from the frontal cortex, even with injection of a lower tau concentration (Fig. 5A; 0.7 μg tau/site for frontal cortex compared with 0.35 μg tau/site for thalamus). A lower amount of PSP-tau from the lentiform was injected into non-Tg mice (0.0175 μg tau/site), so PSP-tau from this region induced less pathology at 3 months p.i.; however, the induced tau aggregates still spread to the same brain regions, and also were found in oligodendrocytes and astrocytes, in addition to neurons (Fig. 5A; fimbria and hipp, red boxes). PSP-tau from all three brain regions induced mature, ThS+ tau aggregates at 3 months p.i. (Fig. 5B). Thus, this potent tau strain does not appear to be restricted to the frontal cortex, but instead propagates throughout the human PSP brain, just as we observed in the PSP-tau-injected mouse brains.
Figure 5.

PSP-tau from different brain regions have similar seeding potency in vivo. A, Representative images of IHC of AT8 on PSP-tau extracted from either the frontal cortex (0.7 μg/site; n = 4), thalamus (0.35 μg/site; n = 3), or lentiform nucleus (0.0175 μg/site; n = 3) of Case 1 injected into non-Tg mice hippocampus/cortex 3 months p.i. Red boxes with insets indicate glial tau pathology in either the fimbria (oligodendrocytes) or hippocampus (astrocytes). Scale bars: panel, 100 μm; inset, 10 μm. B, IHC using other epitope-specific anti-tau antibodies AT180, TG3, and MC1 on PSP-tau from the frontal cortex, thalamus, or lentiform nucleus of Case 1 injected into non-Tg mice HP-Ctx 3 months p.i. Double-labeling IF for AT8/ThS shows tau inclusions are ThS-positive when seeded by PSP-tau extracted from any of the three regions. Scale bars: panel,100 μm; inset, 10 μm. Hipp, Hippocampus; Ctx, cortex; Ipsi, ipsilateral; Contra, contralateral.
Spatiotemporal transmission of tau strains in non-Tg mice
We had previously mapped out the neuronal connectome from our hippocampal AD-tau-injected mice (Guo et al., 2016a). The neuronal tau pathology induced by the three different tauopathy strains continued to increase and spread from 1 to 3 months p.i. to other connected CNS regions from the ventral hilus (Figs. 3A, 5A). However, the seeded tau aggregates did not increase further from 6 to 9 months p.i. (Fig. 6A,B). In fact, although the number of neuronal tau aggregates remained stable for PSP-tau from 3 to 9 months p.i., the extent of neuronal tau aggregates declined for CBD-tau over these longer postinjection times in select brain regions (Fig. 6A,B; ventral hilus ipsi). A decline of AD-tau pathology was also observed over time (although this was not statistically significant), similar to what we previously reported (Guo et al., 2016a). As in the prior study with AD-tau, we did not observe any significant neuron loss in CBD-tau- and PSP-tau-injected mice over the postinjection time intervals studied here (data not shown). Notably, the PSP-tau strain retained more tau inclusions than the AD-tau and CBD-tau strains in the ventral hilus at 9 months p.i. (Fig. 6B). All three tau strains also transmitted tau aggregates to the accessory olfactory bulb, a region not directly anatomically connected to the sites of injection (Fig. 6A). The observation of seeded tau pathology in this region is consistent with transneuronal spreading of tau pathology across neuronal circuits.
Figure 6.
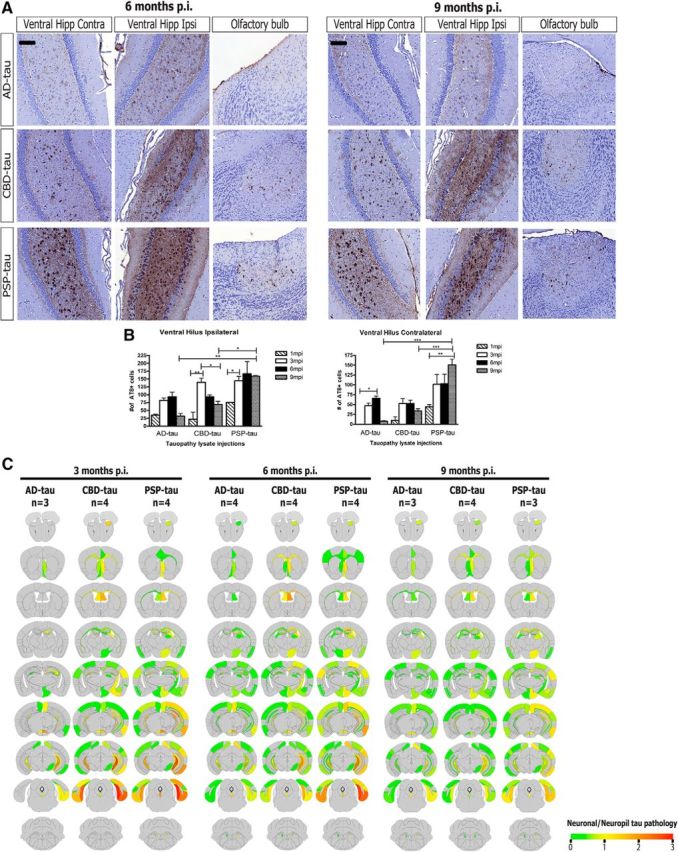
Spatiotemporal transmission patterns of seeded neuronal tau aggregates from three tau strains. A, Left, Representative images from IHC for AT8 for AD-tau- (1 μg/site; n = 4 mice), CBD-tau- (1 μg/site; n = 4 mice), and PSP-tau- (0.7 μg/site; n = 4 mice) injected non-Tg mice 6 months p.i. Right, Representative images from IHC for AT8 for AD-tau- (1 μg/site; n = 3 mice), CBD-tau- (1 μg/site; n = 4 mice), and PSP-tau- (0.7 μg/site; n = 3 mice) injected non-Tg mice 9 months p.i. Scale bar, 100 μm. B, Quantification of AT8+ neurons in ventral hilus region (ipsilateral and contralateral to site of injection) of AD (n = 3 mice for 6 and 9 months), CBD (n = 4 mice for 6 and 9 months p.i.), and PSP-tau (n = 4 mice for 6 months p.i. and n = 3 mice for 9 months p.i.). One-way ANOVA with Bonferroni post hoc test was performed to compare groups (Mean ± SEM plotted; ventral hilus ipsi: F = 7.077, df = 38, ANOVA, p = 0.0001; ventral hilus contra: F = 7.393, df = 38, ANOVA, p = 0.0001; Bonferroni post hoc: *p < 0.05, **p < 0.01, ***p < 0.001). C, Semiquantitative analyses performed on a scale of 0 (gray) to 3 (red) for neuronal tau pathology and color coded onto heat maps. Scores were averaged between mice for each group at 3 months p.i. (n = 3 for AD-tau, n = 4 for CBD-tau, n = 4 for PSP-tau), 6 months p.i. (n = 4 for AD-tau, n = 4 for CBD-tau, n = 4 for PSP-tau), and 9 months p.i. (n = 3 for AD-tau, n = 4 for CBD-tau, n = 3 for PSP-tau). Hipp, Hippocampus; Ctx, cortex; Ipsi, ipsilateral; Contra, contralateral.
Although all tau strains transmit neuronal tau aggregates to regions anatomically connected to the sites of injection, PSP-tau- and CBD-tau-injected non-Tg mice showed a wider spatial distribution of tau pathology than AD-tau-injected mice at 3 months p.i. (Fig. 6C). In particular, PSP-tau- and CBD-tau-injected mice showed propagation of tau inclusions to more cortical regions than AD-tau-injected mice, as visualized by the heat maps of tau pathology in each brain region (Fig. 6C). Interestingly, the spatial distribution of tau pathology between CBD-tau- and PSP-tau-injected mice were very similar at 3 months p.i., suggesting that the CBD-tau and PSP-tau strains may share seeding properties. At 6 and 9 months p.i., we did not observe further spreading of neuronal tau pathology in CBD-tau- and PSP-tau-injected mice. However, we did find limited neuronal tau pathology in more cortical regions in AD-tau-injected mice (Fig. 6C). Thus, the spatial distribution of neuronal tau pathology for all three tau strains was remarkably similar with longer postinjection times.
Transmission of glial tau pathology in non-Tg mice
The seeding of glial tau inclusions in non-Tg mice following injections of CBD-tau and PSP-tau is especially remarkable given that it was widely believed that only neurons express significant amounts of tau protein (Lee et al., 2001). However, recent evidence suggests glial cells may also express tau, albeit at much lower levels than neurons, which may provide enough endogenous tau for seeding by CBD-tau and PSP-tau strains (Zhang et al., 2014). Interestingly, although the transmission of CBD-tau and PSP-tau shared similar properties as described above, CBD-tau-injected mice developed more astrocytic tau pathology, whereas PSP-tau-injected mice developed more oligodendroglial tau inclusions (Fig. 7). Although we did not observe increased spreading of neuronal tau pathology in CBD-tau- and PSP-tau-injected mice at 6 and 9 months p.i., we did observe the continued spatiotemporal transmission of glial tau aggregates in these mice (Fig. 7).
Figure 7.
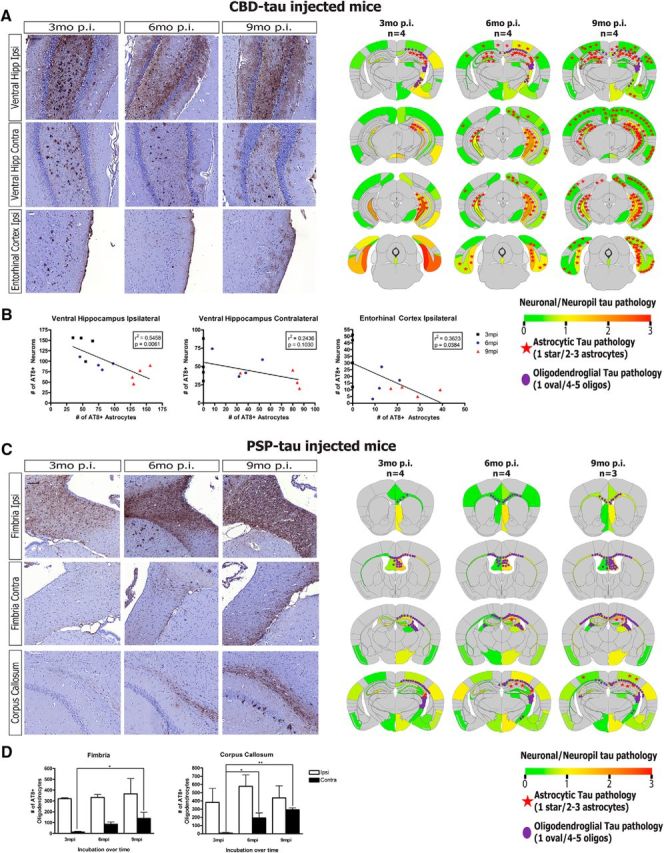
Spatiotemporal transmission of seeded glial tau aggregates in CBD-tau and PSP-tau-injected mice. A, Left, Representative images of IHC for AT8 showing neuronal and astrocytic tau pathology in CBD-tau-injected non-Tg mice at 3, 6, and 9 months p.i. (n = 4 mice for each time point). Scale bar, 100 μm. Right, Semiquantitative heat maps of same CBD-tau-injected mice shown in IHC images on left. Neuronal tau pathology is color-coded per region (as in Fig. 4). Astrocytic tau pathology was counted for each coronal section and averaged across all mice in each group, then depicted schematically on the heat maps as red stars (1 star per 3 tau-positive astrocytes). Oligodendroglial tau pathology was counted similar to the astrocytic pathology, then represented similarly as above on heat maps as purple ovals (1 oval per 5 tau-positive oligodendrocytes). B, Quantification of AT8-positive neurons and astrocytes of CBD-tau-injected mice at 3, 6, and 9 months p.i. (n = 4 mice at each time point; hippocampus/cortex) based on stereological cell counts of two sections in each region with following bregma-based coordinates: ventral hilar neurons: −3.80 and −3.64 mm. Linear regression was performed correlating neuron tau pathology (y-axis) with astrocyte tau pathology (x-axis) in each region, with r2 and p values noted for each regression analysis in the graphs. C, Left, Representative images of IHC for AT8 showing oligodendroglial tau pathology in PSP-tau-injected mice at 3 months (n = 4 mice), 6 months (n = 4 mice), and 9 months (n = 3 mice) p.i. Scale bar, 100 μm. Right, Semiquantitative heat maps of same PSP-tau-injected mice shown in IHC images on left. Neuronal tau pathology is color-coded per region (as in Fig. 4), with astrocytic tau pathology in red stars and oligodendroglial tau pathology in purple circles as in A. D, Quantification of AT8-positive oligodendrocytes in PSP-tau-injected mice at 3 months (n = 4 mice), 6 months (n = 4 mice), and 9 months (n = 3 mice) p.i. based on stereological counts of three sections in each region at the following bregma: fimbria: −1.06, −0.94, and −0.82 mm; corpus callosum −1.06, −0.94, and −0.82 mm. One-way ANOVA with Tukey post hoc analysis was performed across the time points (Mean ± SEM plotted; Fimbria contra: F = 4.642, df = 10; ANOVA, p = 0.0459; corpus callosum contra: F = 11.40, df = 10; ANOVA, p = 0.0046; Tukey post hoc: *p < 0.05, **p < 0.01, ***p < 0.001). Hipp, Hippocampus; Ctx, cortex; Ipsi, ipsilateral; Contra, contralateral.
Astrocytic tau pathology appeared to spread dramatically over time in CBD-tau-injected mice, from the ipsilateral ventral hippocampus at 3 months p.i. to the contralateral hippocampus, as well as cortical regions, at 6 and 9 months p.i. (Fig. 7A). In fact, the extent of astrocytic tau pathology inversely correlated with that of neuronal tau pathology, with a decrease in the number of neuronal tau aggregates in regions accompanied by a concomitant increase in astrocytic tau inclusions (Fig. 7B). Although correlational at this point, we speculate that this finding may imply a neuron-to-astrocyte mechanism of transmission that underlies the spreading of astrocytic tau pathology. It is also possible there is an independent mechanism of astrocytic tau spreading that occurs slower than neuronal tau spreading due to lower endogenous tau expression in astrocytes.
Moreover, there was also significant propagation of oligodendroglial tau aggregates in PSP-tau-injected mice over time, particularly from the ipsilateral to contralateral side of white matter tracts such as the fimbria and corpus callosum (Fig. 7C,D). This result may be interpreted to signify that a glia-to-glia transmission mechanism underlies the spreading of oligodendroglial tau inclusions; however, tau pathology to oligodendrocytes may also spread through the axons of neurons in these white matter tracts.
Regional selectivity of tau strains in non-Tg mice
Our finding of similar spatial distributions of tau pathology at longer incubation times after seeding with all three tau strains conflicts with the regional selectivity observed in human tauopathies. However, it is possible that all tau strains are capable of seeding neuronal tau aggregates in the same brain regions, and thus do not determine the brain region specificity observed in different human tauopathies. We hypothesized that the site of initiation and the neuronal connectome from the initiation site, rather than the specific tau strain, determines the anatomical distribution or intraneuronal spread of tau aggregates in tauopathies. To test this hypothesis, AD-tau, CBD-tau, and PSP-tau were injected into a different brain region, the dorsal thalamus, of non-Tg mice (Fig. 8A). At 6 months p.i., differences between tau strains were observed that mimicked the results with the hippocampus/cortex injections: PSP-tau was still the most potent tau strain, and CBD-tau and PSP-tau induced glial tau pathology, whereas AD-tau did not (Fig. 8B). Despite these quantitative differences in the abundance of neuronal tau inclusions, the spatial distribution of neuronal tau aggregates was highly similar among all three tau strains following injection in the thalamus (Fig. 8C). Yet, the spatial distribution of tau pathology following injection in the thalamus differed from the spatial distribution of tau aggregates following injection in the hippocampus/cortex (compare Figs. 6C, 8C), supporting our hypothesis that the initiation site and neuronal connectome from that site determines the brain region selectivity of different tau strains. Finally, we also observed the spreading of astrocytic tau pathology in the same brain regions as neuronal pathology from the thalamus of CBD-tau-injected mice (Fig. 8C), supporting our speculation that neuronal-to-astrocyte propagation of tau pathology may be involved in the spread of astrocytic tau pathology.
Discussion
In this study, we developed a sporadic tauopathy mouse model to interrogate the mechanisms of neuropathological heterogeneity among human tauopathies. This model was generated by enriching pathological tau from human AD, CBD, and PSP brains and injecting these preparations into non-Tg mouse brains. Although other studies have investigated tau strains (Clavaguera et al., 2013; Sanders et al., 2014; Kaufman et al., 2016), our work extends upon the current literature in several ways.
First, our study uses authentic pathological tau strains purified from human tauopathy brains, and more carefully characterizes the human tau strains, including the concentration of proteopathic tau seeds used, unlike previous studies using human tauopathy brains (Clavaguera et al., 2013). Second, our study highlights the importance of using non-Tg mice as a sporadic tauopathy model. Because previous research studying tau strains used transgenic mice with heterologous promoters controlling overexpression of tau, it has been difficult to elucidate whether the properties of tau transmission are due to intrinsic strain differences or due to the distribution of transgene overexpression. Our model with only endogenous mouse tau expression develops tau aggregates that recapitulate several features of each tauopathy following injections of AD-tau, CBD-tau, or PSP-tau. Although a previous study showed seeding of mouse tau pathology in non-Tg mice, they showed only a few cells with aggregates (Clavaguera et al., 2013), without quantitation of the seeded tau inclusions or description of the spatiotemporal transmission of tau pathology, as in our study. Finally, this is the first study that describes in detail the transmission of glial tau pathology.
We used the GuHCl/PK digestion assay as a biochemical readout to establish that AD-tau, CBD-tau, and PSP-tau indeed are folded differently, consistent with the notion that they represent unique tau strains. Other recent studies have shown pathological tau can form different structural conformations using PK digestion (Kaufman et al., 2016; Taniguchi-Watanabe et al., 2016). Together, these studies support the hypothesis that these tauopathies represent the manifestations of different tau strains. It is important to consider that AD-tau contains both 3R and 4R tau isoforms, whereas CBD-tau, PSP-tau, and adult non-Tg mouse brain primarily contain 4R tau. It is unclear whether both 3R and 4R tau isoforms in AD-tau are seeding endogenous mouse 4R tau, but given our previous finding that 3R and 4R tau isoforms incorporate randomly into recombinant fibrils seeded by AD-tau (Guo et al., 2016a), we hypothesize that both isoforms likely seed mouse tau.
Our enriched human tau strains had different potencies in seeding mouse tau in primary hippocampal neurons. In particular, a distinct strain of PSP-tau was identified that was 300 times more potent than AD-tau or CBD-tau in seeding neuronal tau aggregates in vitro. This PSP-tau strain showed different seeding properties than other PSP cases, thereby suggesting the existence of phenotypic diversity among PSP-tau strains. A previous study showed pathological tau from PSP human brains have different seeding properties in HEK293 cells overexpressing tau, supporting the heterogeneity among PSP-tau strains (Sanders et al., 2014). It is important to note that although primary neurons express both 3R and 4R tau isoforms with additional days in culture, only the 4R tau isoforms are expressed in adult mouse brain. Although it is difficult to compare in vitro and in vivo systems given their differences, they provide two independent systems to interrogate different properties of human tau strains.
Notably, each tau strain induced a unique distribution of tau pathology in non-Tg mouse brains that recapitulated human tau neuropathology. PSP-tau isolated from the frontal cortex from cases with abundant frontal cortical pathology was the most potent in vivo, propagating more neuronal tau aggregates to anatomically connected brain regions than the other strains. Given that abundant cortical pathology is not common in PSP, we hypothesized these PSP cases contained a unique tau strain that was especially aggressive in promoting tau aggregates throughout the human brain. Indeed, PSP-tau extracted from the thalamus and lentiform nucleus of one of these potent PSP cases showed the same aggressive phenotype in the mouse brain as PSP-tau isolated from the frontal cortex.
The clinical diversity in PSP has been noted in the literature. One study showed there are three distinct clinical syndromes of PSP: Richardson's syndrome (RS), PSP-parkinsonism (PSP-P), and pure akinesia with gait freezing (Williams et al., 2005). The same group showed RS patients had higher tau burdens in more cortical regions than PSP-P patients, with an inverse correlation between higher tau burdens and disease duration (Williams et al., 2007). It is possible PSP patients with abundant cortical pathology contain a more potent tau strain that is aggressive enough to spread faster and produce greater disease severity, similar to the highly potent PSP-tau strain that we describe in this paper.
The observed differences of the human tau strains in the non-Tg mouse brain provide insights into the diversity of tauopathies. The increased potency of PSP-tau and to a lesser extent, CBD-tau, could explain the shorter clinical course of PSP and CBD compared with AD. We show tau aggregates develop more quickly with PSP-tau (by 1 month p.i.), and remain stable over long periods of time (up to 9 months p.i.). In contrast, far fewer tau aggregates develop in AD-tau-injected mouse brains at early time points, and show a trend to decline at 9 months p.i. Therefore, we hypothesize that with increasing age tau aggregates slowly form in AD and accumulate over long periods of time. On the other hand, PSP and CBD have a younger clinical onset than AD and a shorter time course for formation of tau pathology, suggesting the rapid propagation of tau pathology in our model mimics a faster clinical course in human disease.
We showed the spatial distributions of neuronal pathology induced by all three tau strains were very similar to each other at longer postinjection times following the hippocampus/cortex and thalamus injections. This finding is in direct contrast to a recent study using artificially-derived tau strains, in which their tau strains did show regional selectivity up to 3 months p.i. (Kaufman et al., 2016). Such discrepancy is likely due to their use of PS19 tau transgenic mice for injection with shorter postinjection times using laboratory-generated tau strains versus our use of human brain-derived tau strains into non-Tg mice with longer postinjection times. Given that human tauopathies develop over many years, the spatial distribution with longer incubations more closely resembles what occurs in the human disease.
Our data are consistent with the hypothesis that all tau strains are capable of inducing neuronal tau aggregates in the same brain regions, with the site of pathology initiation and the neuronal connectome from that site determining which brain regions are affected. In AD, Braak and colleagues proposed that the transentorhinal cortex is the earliest site of tau pathology (Braak and Braak, 1991; Braak et al., 2011; Braak and Del Tredici, 2012), whereas recent studies showed the striatum and prefrontal cortex as the earliest sites in CBD (Ling et al., 2016), and the brainstem in PSP (Williams et al., 2007). We speculate that these different sites of initiation lead to the development of unique tau strains, in which distinct biochemical environments predispose the formation of unique pathological conformers. These distinct tau strains then transmit to brain regions that are anatomically connected via neuronal projections to the original site of pathology. In particular, PSP-tau purified from different brain regions of the same case exhibited similar seeding properties, suggesting this tau strain developed in an early site and then spread to other regions in the human brain.
Our model also revealed remarkable spatiotemporal transmission of glial tau pathology through the non-Tg mouse brain following CBD-tau and PSP-tau injections. The mechanism of glial tau pathology formation has always been a major question in the field, but our findings suggest two mechanisms of pathogenesis. First, a significant inverse correlation between neuronal and astrocytic tau pathology was observed in select brain regions, suggesting there may be transmission of pathological tau seeds from neurons to neighboring astrocytes. Alternatively, it is also possible that astrocytic tau pathology spreads from one astrocyte to another, possibly through astrocytic gap junction networks known to connect adjacent astrocytes across brain regions (Giaume et al., 2010). In contrast, the transmission of oligodendroglial tau aggregates implies a glia-to-glia mechanism through white matter tracts. Although the exact mechanism of glial tau transmission is still unknown, our model can now be used to study the role of neuron-glia and glia-glia interactions in the transmission of tau aggregates.
In conclusion, we demonstrate different tau strains from human AD, CBD, and PSP brains induce unique cellular distributions of tau pathology in non-Tg mouse brains that recapitulate the diversity of tauopathies. Furthermore, this model can now be used to test new therapies to treat these devastating diseases. In light of the development of anti-tau immunotherapy and other tau targeted therapies for AD (Khanna et al., 2016), it will be important to test these therapies against all tau strains so they can be used for the treatment of all tauopathies.
Footnotes
This work was supported by AG10124, AG17586, CurePSP, and the Woods Foundation, and a postdoctoral fellowship award from Sophie M. Moyer and other donors of the AD research program of the BrightFocus Foundation (Grant A2014005F) to J.L.G. We thank Bryan Zoll, Soo-Jung Kim, Timothy Zhou, Terry Schuck, John Robinson, and Katie Casalnova for technical assistance; Kurt Brunden and Eddie Lee for critical reading of the paper; Lester Binder for providing Tau5 antibody; and Peter Davies for contributing PHF-1, MC1, and TG3 antibodies. We also thank the patients and their families for brain donation, and the Mayo Clinic brain bank for providing additional brain samples.
The authors declare no competing financial interests.
References
- Arriagada PV, Growdon JH, Hedley-Whyte ET, Hyman BT (1992) Neurofibrillary tangles but not senile plaques parallel duration and severity of Alzheimer's disease. Neurology 42:631–639. 10.1212/WNL.42.3.631 [DOI] [PubMed] [Google Scholar]
- Ballatore C, Lee VM, Trojanowski JQ (2007) Tau-mediated neurodegeneration in Alzheimer's disease and related disorders. Nat Rev Neurosci 8:663–672. 10.1038/nrn2194 [DOI] [PubMed] [Google Scholar]
- Boluda S, Iba M, Zhang B, Raible KM, Lee VM, Trojanowski JQ (2015) Differential induction and spread of tau pathology in young PS19 tau transgenic mice following intracerebral injections of pathological tau from Alzheimer's disease or corticobasal degeneration brains. Acta Neuropathol 129:221–237. 10.1007/s00401-014-1373-0 [DOI] [PMC free article] [PubMed] [Google Scholar]
- Braak H, Braak E (1991) Neuropathological staging of Alzheimer-related changes. Acta Neuropathol 82:239–259. 10.1007/BF00308809 [DOI] [PubMed] [Google Scholar]
- Braak H, Del Tredici K (2012) Where, when, and in what form does sporadic Alzheimer's disease begin? Curr Opin Neurol 25:708–714. 10.1097/WCO.0b013e32835a3432 [DOI] [PubMed] [Google Scholar]
- Braak H, Thal DR, Ghebremedhin E, Del Tredici K (2011) Stages of the pathologic process in Alzheimer disease: age categories from 1 to 100 years. J Neuropathol Exp Neurol 70:960–969. 10.1097/NEN.0b013e318232a379 [DOI] [PubMed] [Google Scholar]
- Cho H, Choi JY, Hwang MS, Lee JH, Kim YJ, Lee HM, Lyoo CH, Ryu YH, Lee MS (2016a) Tau PET in Alzheimer disease and mild cognitive impairment. Neurology 87:375–383. 10.1212/WNL.0000000000002892 [DOI] [PubMed] [Google Scholar]
- Cho H, Choi JY, Hwang MS, Kim YJ, Lee HM, Lee HS, Lee JH, Ryu YH, Lee MS, Lyoo CH (2016b) In vivo cortical spreading pattern of tau and amyloid in the Alzheimer disease spectrum. Ann Neurol 80:247–258. 10.1002/ana.24711 [DOI] [PubMed] [Google Scholar]
- Clavaguera F, Bolmont T, Crowther RA, Abramowski D, Frank S, Probst A, Fraser G, Stalder AK, Beibel M, Staufenbiel M, Jucker M, Goedert M, Tolnay M (2009) Transmission and spreading of tauopathy in transgenic mouse brain. Nat Cell Biol 11:909–913. 10.1038/ncb1901 [DOI] [PMC free article] [PubMed] [Google Scholar]
- Clavaguera F, Akatsu H, Fraser G, Crowther RA, Frank S, Hench J, Probst A, Winkler DT, Reichwald J, Staufenbiel M, Ghetti B, Goedert M, Tolnay M (2013) Brain homogenates from human tauopathies induce tau inclusions in mouse brain. Proc Natl Acad Sci U S A 110:9535–9540. 10.1073/pnas.1301175110 [DOI] [PMC free article] [PubMed] [Google Scholar]
- Collinge J, Clarke AR (2007) A general model of prion strains and their pathogenicity. Science 318:930–936. 10.1126/science.1138718 [DOI] [PubMed] [Google Scholar]
- Falcon B, Cavallini A, Angers R, Glover S, Murray TK, Barnham L, Jackson S, O'Neill MJ, Isaacs AM, Hutton ML, Szekeres PG, Goedert M, Bose S (2015) Conformation determines the seeding potencies of native and recombinant tau aggregates. J Biol Chem 290:1049–1065. 10.1074/jbc.M114.589309 [DOI] [PMC free article] [PubMed] [Google Scholar]
- Forman MS, Zhukareva V, Bergeron C, Chin SS, Grossman M, Clark C, Lee VM, Trojanowski JQ (2002) Signature tau neuropathology in gray and white matter of corticobasal degeneration. Am J Pathol 160:2045–2053. 10.1016/S0002-9440(10)61154-6 [DOI] [PMC free article] [PubMed] [Google Scholar]
- Frost B, Jacks RL, Diamond MI (2009) Propagation of tau misfolding from the outside to the inside of a cell. J Biol Chem 284:12845–12852. 10.1074/jbc.M808759200 [DOI] [PMC free article] [PubMed] [Google Scholar]
- Giannakopoulos P, Herrmann FR, Bussière T, Bouras C, Kövari E, Perl DP, Morrison JH, Gold G, Hof PR (2003) Tangle and neuron numbers, but not amyloid load, predict cognitive status in Alzheimer's disease. Neurology 60:1495–1500. 10.1212/01.WNL.0000063311.58879.01 [DOI] [PubMed] [Google Scholar]
- Giasson BI, Mabon ME, Duda JE, Montine TJ, Robertson D, Hurtig HI, Lee VM, Trojanowski JQ (2003) Tau and 14-3-3 in glial cytoplasmic inclusions of multiple system atrophy. Acta Neuropathol 106:243–250. 10.1007/s00401-003-0726-x [DOI] [PubMed] [Google Scholar]
- Giaume C, Koulakoff A, Roux L, Holcman D, Rouach N (2010) Astroglial networks: a step further in neuroglial and gliovascular interactions. Nat Rev Neurosci 11:87–99. 10.1038/nrn2757 [DOI] [PubMed] [Google Scholar]
- Gómez-Isla T, Hollister R, West H, Mui S, Growdon JH, Petersen RC, Parisi JE, Hyman BT (1997) Neuronal loss correlates with but exceeds neurofibrillary tangles in Alzheimer's disease. Ann Neurol 41:17–24. 10.1002/ana.410410106 [DOI] [PubMed] [Google Scholar]
- Greenberg SG, Davies P, Schein JD, Binder LI (1992) Hydrofluoric acid-treated tau PHF proteins display the same biochemical properties as normal tau. J Biol Chem 267:564–569. [PubMed] [Google Scholar]
- Guo JL, Lee VM (2013) Neurofibrillary tangle-like tau pathology induced by synthetic tau fibrils in primary neurons over-expressing mutant tau. FEBS Lett 587:717–723. 10.1016/j.febslet.2013.01.051 [DOI] [PMC free article] [PubMed] [Google Scholar]
- Guo JL, Narasimhan S, Changolkar L, He Z, Stieber A, Zhang B, Gathagan RJ, Iba M, McBride JD, Trojanowski JQ, Lee VM (2016a) Unique pathological tau conformers from Alzheimer's brains transmit tau pathology in nontransgenic mice. J Exp Med 213:2635–2654. 10.1084/jem.20160833 [DOI] [PMC free article] [PubMed] [Google Scholar]
- Guo JL, Buist A, Soares A, Callaerts K, Calafate S, Stevenaert F, Daniels JP, Zoll BE, Crowe A, Brunden KR, Moechars D, Lee VM (2016b) The dynamics and turnover of tau aggregates in cultured cells: insights into therapies for tauopathies. J Biol Chem 291:13175–13193. 10.1074/jbc.M115.712083 [DOI] [PMC free article] [PubMed] [Google Scholar]
- Iba M, Guo JL, McBride JD, Zhang B, Trojanowski JQ, Lee VM (2013) Synthetic tau fibrils mediate transmission of neurofibrillary tangles in a transgenic mouse model of Alzheimer's-like tauopathy. J Neurosci 33:1024–1037. 10.1523/JNEUROSCI.2642-12.2013 [DOI] [PMC free article] [PubMed] [Google Scholar]
- Iba M, McBride JD, Guo JL, Zhang B, Trojanowski JQ, Lee VM (2015) Tau pathology spread in PS19 tau transgenic mice following locus coeruleus (LC) injections of synthetic tau fibrils is determined by the LC's afferent and efferent connections. Acta Neuropathol 130:349–362. 10.1007/s00401-015-1458-4 [DOI] [PMC free article] [PubMed] [Google Scholar]
- Irwin DJ, Cairns NJ, Grossman M, McMillan CT, Lee EB, Van Deerlin VM, Lee VM, Trojanowski JQ (2015) Frontotemporal lobar degeneration: defining phenotypic diversity through personalized medicine. Acta Neuropathol 129:469–491. 10.1007/s00401-014-1380-1 [DOI] [PMC free article] [PubMed] [Google Scholar]
- Ishihara T, Hong M, Zhang B, Nakagawa Y, Lee MK, Trojanowski JQ, Lee VM (1999) Age-dependent emergence and progression of a tauopathy in transgenic mice overexpressing the shortest human tau isoform. Neuron 24:751–762. 10.1016/s0896-6273(00)81127-7 [DOI] [PubMed] [Google Scholar]
- Jicha GA, Bowser R, Kazam IG, Davies P (1997a) Alz-50 and MC-1, a new monoclonal antibody raised to paired helical filaments, recognize conformational epitopes on recombinant tau. J Neurosci Res 48:128–132. 10.1002/(SICI)1097-4547(19970415)48:2%3C128::AID-JNR5%3E3.0.CO;2-E [DOI] [PubMed] [Google Scholar]
- Jicha GA, Lane E, Vincent I, Otvos L Jr, Hoffmann R, Davies P (1997b) A conformation- and phosphorylation-dependent antibody recognizing the paired helical filaments of Alzheimer's disease. J Neurochem 69:2087–2095. 10.1046/j.1471-4159.1997.69052087.x [DOI] [PubMed] [Google Scholar]
- Kaufman SK, Sanders DW, Thomas TL, Ruchinskas AJ, Vaquer-Alicea J, Sharma AM, Miller TM, Diamond MI (2016) Tau prion strains dictate patterns of cell pathology, progression rate, and regional vulnerability in vivo. Neuron 92:796–812. 10.1016/j.neuron.2016.09.055 [DOI] [PMC free article] [PubMed] [Google Scholar]
- Khanna MR, Kovalevich J, Lee VM, Trojanowski JQ, Brunden KR (2016) Therapeutic strategies for the treatment of tauopathies: hopes and challenges. Alzheimers Dement 12:1051–1065. 10.1016/j.jalz.2016.06.006 [DOI] [PMC free article] [PubMed] [Google Scholar]
- Kosik KS, Orecchio LD, Binder L, Trojanowski JQ, Lee VM, Lee G (1988) Epitopes that span the tau molecule are shared with paired helical filaments. Neuron 1:817–825. 10.1016/0896-6273(88)90129-8 [DOI] [PubMed] [Google Scholar]
- Lee VM, Goedert M, Trojanowski JQ (2001) Neurodegenerative tauopathies. Annu Rev Neurosci 24:1121–1159. 10.1146/annurev.neuro.24.1.1121 [DOI] [PubMed] [Google Scholar]
- Lee VM, Page CD, Wu HL, Schlaepfer WW (1984) Monoclonal antibodies to gel-excised glial filament protein and their reactivities with other intermediate filament proteins. J Neurochem 42:25–32. 10.1111/j.1471-4159.1984.tb09692.x [DOI] [PubMed] [Google Scholar]
- Legname G, Nguyen HO, Peretz D, Cohen FE, DeArmond SJ, Prusiner SB (2006) Continuum of prion protein structures enciphers a multitude of prion isolate-specified phenotypes. Proc Natl Acad Sci U S A 103:19105–19110. 10.1073/pnas.0608970103 [DOI] [PMC free article] [PubMed] [Google Scholar]
- Ling H, Kovacs GG, Vonsattel JP, Davey K, Mok KY, Hardy J, Morris HR, Warner TT, Holton JL, Revesz T (2016) Astrogliopathy predominates the earliest stage of corticobasal degeneration pathology. Brain 139:3237–3252. 10.1093/brain/aww256 [DOI] [PubMed] [Google Scholar]
- Montine TJ, Monsell SE, Beach TG, Bigio EH, Bu Y, Cairns NJ, Frosch M, Henriksen J, Kofler J, Kukull WA, Lee EB, Nelson PT, Schantz AM, Schneider JA, Sonnen JA, Trojanowski JQ, Vinters HV, Zhou XH, Hyman BT (2016) Multisite assessment of NIA-AA guidelines for the neuropathologic evaluation of Alzheimer's disease. Alzheimers Dement 12:164–169. 10.1016/j.jalz.2015.07.492 [DOI] [PMC free article] [PubMed] [Google Scholar]
- Sanders DW, Kaufman SK, DeVos SL, Sharma AM, Mirbaha H, Li A, Barker SJ, Foley AC, Thorpe JR, Serpell LC, Miller TM, Grinberg LT, Seeley WW, Diamond MI (2014) Distinct tau prion strains propagate in cells and mice and define different tauopathies. Neuron 82:1271–1288. 10.1016/j.neuron.2014.04.047 [DOI] [PMC free article] [PubMed] [Google Scholar]
- Sha S, Hou C, Viskontas IV, Miller BL (2006) Are frontotemporal lobar degeneration, progressive supranuclear palsy and corticobasal degeneration distinct diseases? Nat Clin Pract Neurol 2:658–665. 10.1038/ncpneuro0357 [DOI] [PubMed] [Google Scholar]
- Taniguchi-Watanabe S, Arai T, Kametani F, Nonaka T, Masuda-Suzukake M, Tarutani A, Murayama S, Saito Y, Arima K, Yoshida M, Akiyama H, Robinson A, Mann DM, Iwatsubo T, Hasegawa M (2016) Biochemical classification of tauopathies by immunoblot, protein sequence and mass spectrometric analyses of sarkosyl-insoluble and trypsin-resistant tau. Acta Neuropathol 131:267–280. 10.1007/s00401-015-1503-3 [DOI] [PMC free article] [PubMed] [Google Scholar]
- Uchihara T, Nakamura A, Shibuya K, Yagishita S (2011) Specific detection of pathological three-repeat tau after pretreatment with potassium permanganate and oxalic acid in PSP/CBD brains. Brain Pathol 21:180–188. 10.1111/j.1750-3639.2010.00433.x [DOI] [PMC free article] [PubMed] [Google Scholar]
- Volpicelli-Daley LA, Luk KC, Patel TP, Tanik SA, Riddle DM, Stieber A, Meaney DF, Trojanowski JQ, Lee VM (2011) Exogenous alpha-synuclein fibrils induce Lewy body pathology leading to synaptic dysfunction and neuron death. Neuron 72:57–71. 10.1016/j.neuron.2011.08.033 [DOI] [PMC free article] [PubMed] [Google Scholar]
- Wang L, Benzinger TL, Su Y, Christensen J, Friedrichsen K, Aldea P, McConathy J, Cairns NJ, Fagan AM, Morris JC, Ances BM (2016) Evaluation of tau imaging in staging Alzheimer disease and revealing interactions between β-amyloid and tauopathy. JAMA Neurol 73:1070–1077. 10.1001/jamaneurol.2016.2078 [DOI] [PMC free article] [PubMed] [Google Scholar]
- Williams DR, Lees AJ (2009) Progressive supranuclear palsy: clinicopathological concepts and diagnostic challenges. Lancet Neurol 8:270–279. 10.1016/S1474-4422(09)70042-0 [DOI] [PubMed] [Google Scholar]
- Williams DR, de Silva R, Paviour DC, Pittman A, Watt HC, Kilford L, Holton JL, Revesz T, Lees AJ (2005) Characteristics of two distinct clinical phenotypes in pathologically proven progressive supranuclear palsy: Richardson's syndrome and PSP-parkinsonism. Brain 128:1247–1258. 10.1093/brain/awh488 [DOI] [PubMed] [Google Scholar]
- Williams DR, Holton JL, Strand C, Pittman A, de Silva R, Lees AJ, Revesz T (2007) Pathological tau burden and distribution distinguishes progressive supranuclear palsy-parkinsonism from Richardson's syndrome. Brain 130:1566–1576. 10.1093/brain/awm104 [DOI] [PubMed] [Google Scholar]
- Xia C, Makaretz SJ, Caso C, McGinnis S, Gomperts SN, Sepulcre J, Gomez-Isla T, Hyman BT, Schultz A, Vasdev N, Johnson KA, Dickerson BC (2017) Association of in vivo [18F]AV-1451 tau PET imaging results with cortical atrophy and symptoms in typical and atypical Alzheimer disease. JAMA Neurol 74:427–436. 10.1001/jamaneurol.2016.5755 [DOI] [PMC free article] [PubMed] [Google Scholar]
- Yoshida M. (2006) Cellular tau pathology and immunohistochemical study of tau isoforms in sporadic tauopathies. Neuropathology 26:457–470. 10.1111/j.1440-1789.2006.00743.x [DOI] [PubMed] [Google Scholar]
- Yoshida M. (2014) Astrocytic inclusions in progressive supranuclear palsy and corticobasal degeneration. Neuropathology 34:555–570. 10.1111/neup.12143 [DOI] [PubMed] [Google Scholar]
- Zhang Y, Chen K, Sloan SA, Bennett ML, Scholze AR, O'Keeffe S, Phatnani HP, Guarnieri P, Caneda C, Ruderisch N, Deng S, Liddelow SA, Zhang C, Daneman R, Maniatis T, Barres BA, Wu JQ (2014) An RNA-sequencing transcriptome and splicing database of glia, neurons, and vascular cells of the cerebral cortex. J Neurosci 34:11929–11947. 10.1523/JNEUROSCI.1860-14.2014 [DOI] [PMC free article] [PubMed] [Google Scholar]