

Abstract
Background
We aimed to elucidate the relationship between serum myostatin levels and other markers including skeletal muscle mass and to investigate the influence of serum myostatin levels on survival for patients with liver cirrhosis (LC).
Methods
A total of 198 LC subjects were analysed in this study. Myostatin levels were measured using stored sera. We retrospectively investigated the relationship between myostatin level and other markers, and the influence of myostatin level on overall survival (OS). Assessment of skeletal muscle mass was performed using the psoas muscle index (PMI) on computed tomography images at baseline. PMI indicates the sum of bilateral psoas muscle mass calculated by hand tracing at the lumber three level on computed tomography images divided by height squared (cm2/m2). The study cohort was divided into two groups based on the median myostatin value in each gender.
Results
Our study cohort included 108 male and 90 female patients with a median age of 67.5 years. The median (range) myostatin level for male patients was 3419.6 pg/mL (578.4–12897.7 pg/mL), whereas that for female patients was 2662.4 pg/mL (710.4–8782.0 pg/mL) (P = 0.0024). Median (range) serum myostatin level for Child–Pugh A patients (n = 123) was 2726.0 pg/mL (578.4–12667.2 pg/mL), whereas that for Child–Pugh B or C patients (n = 75) was 3615.2 pg/mL (663.3–12897.7 pg/mL) (P = 0.0011). For the entire cohort, the 1‐, 3‐, 5‐, and 7‐year cumulative OS rates were 93.94%, 72.71%, 50.37%, and 38.47%, respectively, in the high‐myostatin group and 96.97%, 83.27%, 73.60%, and 69.95%, respectively, in the low‐myostatin group (P = 0.0001). After excluding hepatocellular carcinoma patients (at baseline) from our analysis (n = 158), the 1‐, 3‐, 5‐, and 7‐year cumulative OS rates were 96.0%, 77.93%, 52.97%, and 39.08%, respectively, in the high‐myostatin group and 96.39%, 87.58%, 77.63%, and 73.24%, respectively, in the low‐myostatin group (P = 0.0005). Higher age (P = 0.0111) and lower PMI (P < 0.0001) were identified as significant predictors of poorer OS in our multivariate analysis, while higher serum myostatin (P = 0.0855) tended to be a significant adverse predictor. In both genders, PMI, serum albumin, prothrombin time, and branched‐chain amino acid to tyrosine ratio showed a significantly inverse correlation with myostatin levels, and serum ammonia levels showed a significantly positive correlation with myostatin levels.
Conclusions
Higher serum myostatin levels correlated with muscle mass loss, hyperammonemia, and impaired protein synthesis, as reflected by lower serum albumin levels and lower branched‐chain amino acid to tyrosine ratio levels. High serum myostatin levels were also associated with a reduced OS rate in LC patients.
Keywords: Liver cirrhosis, Serum myostatin, Skeletal muscle, Predictor, Prognosis
Introduction
Sarcopenia is a clinical disease entity defined by skeletal muscle mass depletion and muscle strength weakness. This disease has received significant attention from clinicians recently because of its significant deleterious influence on outcomes.1, 2, 3, 4, 5, 6, 7, 8, 9, 10 Generally, changes in skeletal muscle mass can occur with increasing age, and muscle mass depletion is a common disorder in the ageing population.11 Liver cirrhosis (LC) results from the progression of multiple forms of necro‐inflammatory disorders of the liver by fibrosis and vascular remodelling and can be related to secondary sarcopenia because of two metabolic burdens in LC patients: protein metabolic disorder and energy metabolic disorder.2, 5, 6, 12, 13, 14 Sarcopenia is also linked to the prognosis of patients with liver diseases.15, 16, 17, 18, 19, 20 Skeletal muscle mass is maintained by the balance between protein synthesis and protein breakdown, and sarcopenia can occur because of an increase in proteolysis or a reduction in protein synthesis or both.1, 2, 3, 4, 5, 6, 7, 8, 9, 10
Myostatin is a cytokine belonging to the transforming growth factor beta family, and its functional role was first elucidated in 1997.21 Myostatin is a negative regulator of muscle protein synthesis, which acts via the impaired mammalian target of rapamycin signalling, which strongly suppresses skeletal muscle growth.22 Previous studies have reported an increased skeletal muscle mass in mice given a molecule that inhibits myostatin.21 In addition, the serum myostatin concentrations of patients with LC have been reported to be significantly higher than those of healthy controls, thus indicating that myostatin is associated with the loss of skeletal muscle mass loss.22, 23 A previous study also determined that elevated ammonia levels in the blood lead to increased myostatin expression in the skeletal muscle.24 Myostatin can be transcriptionally up‐regulated by hyperammonemia in the skeletal muscle of humans.10, 22, 25, 26 An excessive alcohol intake has also been demonstrated to negatively impact protein metabolism and can lead to the elevation of myostatin expression in skeletal muscle.8, 27 Myostatin deficiency has more recently been demonstrated to exert beneficial effects on metabolism, adiposity, and insulin sensitivity.28, 29 On the other hand, follistatin is a liver‐derived inhibitor of myostatin, and a recent study has reported that follistatin levels in patients with LC are significantly reduced as compared with healthy controls, which might contribute to the loss of muscle mass in LC patients.30
However, whether serum myostatin levels are associated with clinical outcomes for patients with LC remains an unsolved issue. Addressing these clinical questions may be of importance because of the lack of relevant clinical data. The aims of this present study were thus to elucidate the relationship between serum myostatin levels and other markers including skeletal muscle mass and to investigate the influence of serum myostatin levels on survival for patients with LC.
Patients and methods
Patients
Between February 2006 and January 2015, a total of 213 LC individuals, who had stored sera available for the measurement of myostatin level, were admitted at the Division of Hepatobiliary and Pancreatic disease, Department of Internal Medicine, Hyogo College of Medicine, Hyogo, Japan. In our department, stored serum samples are generally obtained from all hospitalized patients in order that their nutritional status can be assessed, once informed written consent has been obtained. Serum myostatin was measured using commercially available kits (R&D Systems, Minneapolis, MN, USA). Assessment of skeletal muscle mass was performed using the psoas muscle index (PMI) on computed tomography (CT) images at baseline. PMI indicates the sum of bilateral psoas muscle mass calculated by hand tracing at the lumber three (L3) level on CT images divided by height squared (cm2/m2).31 A lower PMI was defined as <6.36 cm2/m2 for male patients and <3.92 cm2/m2 for female patients according to the recommendations of current guidelines.5 In total, 213 subjects had available data for myostatin level, PMI at baseline, and clinical outcomes. Of these patients, advanced hepatocellular carcinoma (HCC) patients at baseline in whom curative therapies were not possible (n = 15) were excluded from the current analysis because advanced malignancies themselves can affect skeletal muscle mass.32, 33 A total of 198 LC subjects were therefore analysed in this study. Follow‐up observation included periodical blood tests and radiological assessments by ultrasonography, CT, or magnetic resonance imaging in order to detect HCC incidence or recurrence every 3–6 months. None of the patients received liver transplantation during the follow‐up period. LC was determined by pathological findings, radiological findings such as ultrasonography, CT, or magnetic resonance imaging, and/or laboratory data including markers of liver fibrosis.34, 35, 36 In principal, for patients with a lower serum albumin level (less than 3.5 g/dL), liver supporting therapies, including branched‐chain amino acid (BCAA) treatment or late evening meals with BCAA‐enriched snacks, were performed.37, 38, 39 For patients with hepatitis virus‐related LC, antiviral therapies, including direct acting antivirals, interferon‐based regimens, or nucleoside analogue therapy, were also considered.37, 38 Alcoholic LC patients were instructed to cease all alcohol intake. For patients with other liver disease etiologies, the most appropriate therapy for each underlying liver disease was carried out. We retrospectively investigated the relationship between serum myostatin level and other markers, and the influence of serum myostatin level on survival. Factors linked to overall survival (OS) in the univariate and multivariate analyses were also examined. Diagnosis and treatment choices for HCC were as previously described.40, 41
The ethical committee of Hyogo College of Medicine approved the current study protocol, and this study strictly followed all regulations of the Declaration of Helsinki.
Statistical analyses
Quantitative variables were compared by unpaired t‐test, Mann–Whitney U test, or Spearman's rank correlation coefficient r s as appropriate. Continuous variables were divided into two groups using median values that were then treated as dichotomous covariates for univariate analysis except for age, body mass index, and PMI. The cut‐off values for age and body mass index for univariate analysis were 65 years and 25.0 kg/m2. As described earlier, cut‐off values for PMI were set at 6.36 cm2/m2 for male patients and 3.92 cm2/m2 for female patients. Survival curves were created using the Kaplan–Meier method and compared by the log‐rank test. Variables with a P value <0.05 in our univariate analysis were finally entered into the multivariate analysis using the Cox proportional hazard model. OS was defined as the duration from the blood collection date for stored sera for measuring myostatin level until death from any cause or the last follow‐up visit.
Data are presented as the median value (range) unless otherwise stated. P values of less than 0.05 were considered to indicate statistical significance. Statistical analysis was performed with JMP 11 software (SAS Institute Inc., Cary, NC, USA).
Results
Baseline characteristics
The baseline characteristics in this study (n = 198) are shown in Table 1. The study included 108 male and 90 female patients with a median age (range) of 67.5 (22.6–89.8) years. At baseline, HCC was identified on radiological findings in 40 patients (20.2%) and ascites in 35 patients (17.7%). Patients were predominantly hepatitis C virus (HCV)‐related LC (116/198, 58.6%). Child–Pugh A was in the majority (123/198, 62.1%). The median follow‐up period was 4.35 years (range: 0.19–10.48 years), while the median (range) serum myostatin level for the entire cohort was 2994.4 pg/mL (578.4–12897.7 pg/mL). The median (range) serum myostatin level for men was 3419.6 pg/mL (578.4–12897.7 pg/mL), whereas that for women was 2662.4 pg/mL (710.4–8782.0 pg/mL) (P = 0.0024; Figure 1A). The median (range) serum myostatin level for Child–Pugh A patients was 2726.0 pg/mL (578.4–12 667.2 pg/mL), whereas that for Child–Pugh B or C patients was 3615.2 pg/mL (663.3–12897.7 pg/mL) (P = 0.0011; Figure 1B). The median (range) PMI for men was 5.33 cm2/m2 (2.06–9.68 cm2/m2), whereas that for women was 4.02 cm2/m2 (0.79–6.70 cm2/m2) (P < 0.0001).
Table 1.
Baseline data (n = 198)
| Variables | Number or median (range) |
|---|---|
| Age (years) | 67.5 (22.6–89.8) |
| Gender, male/female | 108/90 |
| Body mass index (kg/m2) | 22.77 (13.05–36.61) |
| Serum myostatin (pg/mL), men | 3419.6 (578.4–12897.7) |
| Serum myostatin (pg/mL), women | 2662.4 (710.4–8782.0) |
| Psoas muscle index (cm2/m2), men | 5.33 (2.06–9.68) |
| Psoas muscle index (cm2/m2), women | 4.02 (0.79–6.70) |
| Causes of liver disease | 17/116/19/46 |
| HBV/HCV/alcoholic/others | |
| Child–Pugh classification, A/B/C | 123/72/3 |
| Presence of HCC, yes/no | 40/158 |
| Total bilirubin (mg/dL) | 1.1 (0.3–6.0) |
| Serum albumin (g/dL) | 3.6 (2.0–4.9) |
| Prothrombin time (%) | 74.7 (35.6–115.6) |
| Platelets (×104/mm3) | 8.6 (2.5–42.4) |
| Serum sodium (mmol/L) | 140 (127–145) |
| Serum creatinine (mg/dL) | 0.70 (0.34–4.14) |
| Total cholesterol (mg/dL) | 150 (70–306) |
| AST (IU/L) | 44 (16–402) |
| ALT (IU/L) | 34 (9–487) |
| Serum ammonia (μg/dL) | 40 (7–132) |
| HOMA‐IR | 2.51 (0.07–36.41) |
| BTR | 4.03 (1.46–9.67) |
| Ascites, yes/no | 35/163 |
| Alpha‐fetoprotein (ng/mL) | 5.5 (0.8–1345.0) |
Data are expressed as number or median (range). ALT, alanine aminotransferase; AST, aspartate aminotransferase; BTR, branched‐chain amino acid to tyrosine ratio; HBV, hepatitis B virus; HCC, hepatocellular carcinoma; HCV, hepatitis C virus; HOMA‐IR, homeostasis model assessment of insulin resistance.
Figure 1.
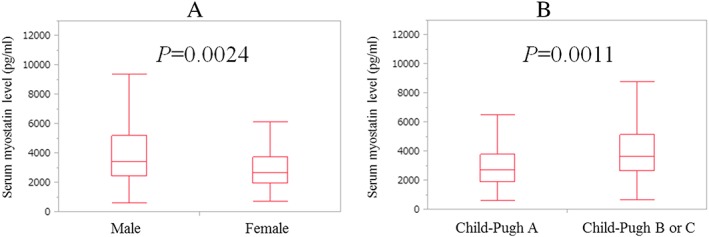
(A) Baseline serum myostatin levels in male and female patients. The median (range) level of serum myostatin for male patients was 3419.6 pg/mL (578.4–12897.7 pg/mL) whereas that for females was 2662.4 pg/mL (710.4–8782.0 pg/mL) (P = 0.0024). (B) Baseline serum myostatin levels according to Child–Pugh classification. The median (range) serum myostatin level for Child–Pugh A patients was 2726.0 pg/mL (578.4–12667.2 pg/mL) whereas that for Child–Pugh B or C was 3615.2 pg/mL (663.3–12897.7 pg/mL) (P = 0.0011).
Relationship between serum myostatin level and baseline characteristics for male (n = 108) and female (n = 90) patients
In male patients, PMI (r s = −0.4439, P < 0.0001), serum albumin (r s = −03844, P < 0.0001), prothrombin time (PT) (r s = −0.2279, P = 0.0188), serum ammonia (r s = 0.5856, P < 0.0001), and BCAA to tyrosine ratio (BTR) (r s = −0.4610, P < 0.0001) were significantly correlated with baseline myostatin level. In female patients, age (r s = −0.2232, P = 0.0345), PMI (r s = −0.2624, P = 0.0108), total bilirubin (r s = −0.2915, P = 0.0053), serum albumin (r s = −0.3945, P = 0.0001), PT (r s = −0.2537, P = 0.0158), serum ammonia (r s = 0.3922, P = 0.0001), and BTR (r s = −0.4115, P < 0.0001) were also significantly correlated with baseline myostatin level (Table 2).
Table 2.
Relationship between serum myostatin level and baseline characteristics for male (n = 108) and female (n = 90) patients
| Male | Female | |||
|---|---|---|---|---|
| r s | P value | r s | P value | |
| Age | 0.1881 | 0.0513 | −0.2232 | 0.0345 |
| Body mass index | −0.0751 | 0.4398 | 0.1126 | 0.2908 |
| Psoas muscle index | −0.4439 | <0.0001 | −0.2624 | 0.0108 |
| Total bilirubin | 0.0725 | 0.4558 | 0.2915 | 0.0053 |
| Serum albumin | −0.3844 | <0.0001 | −0.3945 | 0.0001 |
| Prothrombin time | −0.2279 | 0.0188 | −0.2537 | 0.0158 |
| Platelets | −0.0871 | 0.3702 | −0.1140 | 0.2848 |
| Serum sodium | −0.0156 | 0.8923 | 0.1383 | 0.1934 |
| Serum creatinine | −0.0568 | 0.5591 | −0.1403 | 0.1873 |
| Total cholesterol | −0.0239 | 0.8062 | −0.1099 | 0.3026 |
| AST | 0.1593 | 0.0996 | 0.0829 | 0.2499 |
| ALT | 0.1240 | 0.2009 | 0.0885 | 0.4070 |
| Serum ammonia | 0.5856 | <0.0001 | 0.3922 | 0.0001 |
| HOMA‐IR | −0.1069 | 0.2708 | 0.1507 | 0.1661 |
| BTR | −0.4610 | <0.0001 | −0.4115 | <0.0001 |
| Alpha‐fetoprotein | 0.1408 | 0.1461 | 0.1159 | 0.2767 |
ALT, alanine aminotransferase; AST, aspartate aminotransferase; BTR, branched‐chain amino acid to tyrosine ratio; HOMA‐IR, homeostasis model assessment of insulin resistance.
Cumulative overall survival rates for the entire cohort according to serum myostatin level
Baseline serum myostatin levels were significantly different when compared between male and female patients (P = 0.0024). We thus defined patients with a serum myostatin level, which was higher than the median value for each gender as the high‐myostatin group (n = 99) and those with less than the median value for each gender as the low‐myostatin group (n = 99).
For the entire cohort, the 1‐, 3‐, 5‐, and 7‐year cumulative OS rates were 93.94%, 72.71%, 50.37%, and 38.47%, respectively, in the high‐myostatin group and 96.97%, 83.27%, 73.60%, and 69.95%, respectively, in the low‐myostatin group (P = 0.0001; Figure 2A). After excluding HCC patients (at baseline) from our analysis (n = 158), the 1‐, 3‐, 5‐, and 7‐year cumulative OS rates were 96.0%, 77.93%, 52.97%, and 39.08%, respectively, in the high‐myostatin group and 96.39%, 87.58%, 77.63%, and 73.24%, respectively, in the low‐myostatin group (P = 0.0005; Figure 2B).
Figure 2.
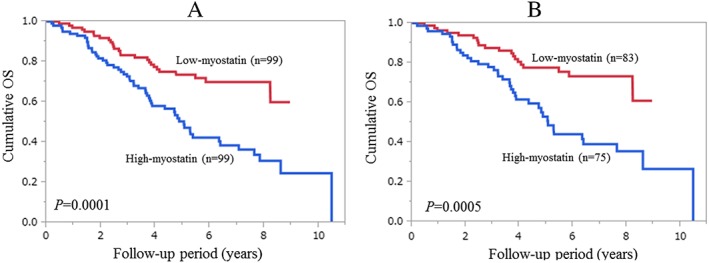
(A) Cumulative overall survival (OS) rates for the entire cohort (n = 198). The 1‐, 3‐, 5‐, and 7‐year cumulative OS rates were 93.94%, 72.71%, 50.37%, and 38.47%, respectively, in the high‐myostatin group and 96.97%, 83.27%, 73.60%, and 69.95%, respectively, in the low‐myostatin group (P = 0.0001). (B) Cumulative OS rates after excluding hepatocellular carcinoma patients at baseline (n = 158). The 1‐, 3‐, 5‐, and 7‐year cumulative OS rates were 96.0%, 77.93%, 52.97%, and 39.08%, respectively, in the high‐myostatin group and 96.39%, 87.58%, 77.63%, and 73.24%, respectively, in the low‐myostatin group (P = 0.0005).
Causes of death for male and female patients
In the high‐myostatin group, 55 patients (55.6%) died during the follow‐up period. The causes of death were liver failure in 34 patients, HCC progression in 15 patients, and miscellaneous causes in six patients. In the low‐myostatin group, 27 patients (27.3%) died during the follow‐up period. The causes of death were liver failure in 11 patients, HCC progression in 14 patients, and miscellaneous causes in two patients.
Univariate and multivariate analyses of parameters contributing to overall survival
Univariate analysis identified the following factors as being significantly associated with a worse OS: age ≥ 65 years (P = 0.0247); higher serum myostatin level (P = 0.0001); lower PMI (P < 0.0001); presence of HCC (P = 0.0135); PT <74.7% (P = 0.0189); serum ammonia ≥40 μg/dL (P = 0.0252); alpha‐fetoprotein (AFP) ≥5.5 ng/mL (P = 0.0117); presence of ascites (P < 0.0001); and a higher Child–Pugh score (P = 0.0289; Table 3). Because the Child–Pugh score includes PT and ascites, these parameters were not included in our multivariate analysis. To avoid the influence of collinearity between AFP and the presence of HCC, AFP was not included in the multivariate analysis. The hazard ratios and 95% confidence intervals calculated by multivariate analysis for the six significant parameters (P < 0.05) in the univariate analysis are presented in Table 3.
Table 3.
Univariate and multivariate analyses of factors linked to overall survival (n = 198)
| Variables | Number of each category | Univariate | |
|---|---|---|---|
| P value | |||
| Age (years) ≥65, yes/no | 112/86 | 0.0247 | |
| Gender, male/female | 108/90 | 0.1907 | |
| Cause of liver diseases, B/C/alcoholic/others | 17/116/19/46 | 0.3955 | |
| Serum myostatin, high/low | 99/99 | 0.0001 | |
| Psoas muscle index, high/low | 90/108 | <0.0001 | |
| Presence of HCC, yes/no | 40/158 | 0.0135 | |
| AST ≥44 IU/L, yes/no | 100/98 | 0.9389 | |
| ALT ≥34 IU/L, yes/no | 100/98 | 0.9857 | |
| Serum albumin ≥3.6 g/dL, yes/no | 104/94 | 0.0615 | |
| Total bilirubin ≥1.1 mg/dL, yes/no | 99/99 | 0.7636 | |
| Prothrombin time ≥ 74.7%, yes/no | 100/98 | 0.0189 | |
| Platelet count ≥8.6 × 10⁴/mm3, yes/no | 99/99 | 0.0551 | |
| Serum creatinine ≥0.7 mg/dL, yes/no | 102/96 | 0.3043 | |
| Total cholesterol ≥150 mg/dL, yes/no | 103/95 | 0.3741 | |
| Serum sodium ≥140 mmol/L, yes/no | 100/98 | 0.0635 | |
| Serum ammonia ≥40 μg/dL, yes/no | 102/96 | 0.0252 | |
| HOMA‐IR ≥2.51, yes/no | 100/98 | 0.1589 | |
| BTR ≥4.03, yes/no | 101/97 | 0.1138 | |
| Alpha‐fetoprotein ≥5.5 ng/mL, yes/no | 99/99 | 0.0117 | |
| Body mass index ≥25.0 kg/m2, yes/no | 56/142 | 0.0761 | |
| Ascites, yes/no | 35/163 | <0.0001 | |
| Child–Pugh, A/B or C | 123/75 | 0.0289 | |
| Variables | Multivariate analysis | ||
|---|---|---|---|
| Hazard ratio | 95% confidence interval | P value | |
| Age (per 1 year) | 1.030 | 1.007–1.057 | 0.0111 |
| Serum myostatin, high/low | 1.576 | 0.936–2.574 | 0.0855 |
| Psoas muscle index, high/low | 0.229 | 0.124–0.394 | <0.0001 |
| Presence of HCC | 1.475 | 0.899–2.468 | 0.1246 |
| Serum ammonia (per 1 μg/dL) | 1.008 | 0.996–1.019 | 0.1976 |
| Child–Pugh A/B or C | 0.716 | 0.451–1.142 | 0.1590 |
ALT, alanine aminotransferase; AST, aspartate aminotransferase; BTR, branched‐chain amino acid to tyrosine ratio; HCC, hepatocellular carcinoma; HOMA‐IR, homeostasis model assessment of insulin resistance.
Univariate and multivariate analyses of parameters contributing to overall survival after excluding hepatocellular carcinoma patients at baseline (n = 158)
We also carried out additional analyses after excluding HCC patients at baseline. Univariate analysis identified the following factors as being significantly associated with a worse OS: age ≥ 65 years (P = 0.0385); higher serum myostatin level (P = 0.0005); lower PMI (P < 0.0001); alanine aminotransferase ≥32 IU/L (P = 0.0201); serum albumin ≥3.6 g/dL (P = 0.0105); PT <74.7% (P = 0.0233); serum ammonia ≥39.5 μg/dL (P = 0.0220); BTR <4.04 (P = 0.0276); presence of ascites (P < 0.0001); and a higher Child–Pugh score (P = 0.0065; Table 4). Because the Child–Pugh score includes albumin, PT, and ascites, these parameters were not included in our multivariate analysis. The hazard ratios and 95% confidence intervals calculated by multivariate analysis for the seven significant parameters (P < 0.05) in the univariate analysis are presented in Table 4.
Table 4.
Univariate and multivariate analyses of factors linked to overall survival after excluding HCC patients at baseline (n = 158)
| Variables | Number of each category | Univariate | |
|---|---|---|---|
| P value | |||
| Age (years) ≥65, yes/no | 84/74 | 0.0385 | |
| Gender, male/female | 90/68 | 0.2192 | |
| Cause of liver diseases, B/C/alcoholic others | 16/81/17/44 | 0.3889 | |
| Serum myostatin, high/low | 75/83 | 0.0005 | |
| Psoas muscle index, high/low | 84/74 | <0.0001 | |
| AST ≥40.5 IU/l, yes/no | 79/79 | 0.9411 | |
| ALT ≥32 IU/l, yes/no | 80/78 | 0.0201 | |
| Serum albumin ≥3.6 g/dL, yes/no | 84/74 | 0.0105 | |
| Total bilirubin ≥1.1 mg/dL, yes/no | 85/73 | 0.1987 | |
| Prothrombin time ≥ 74.7%, yes/no | 80/78 | 0.0233 | |
| Platelet count ≥8.4 × 10⁴/mm3, yes/no | 79/79 | 0.0527 | |
| Serum creatinine ≥0.71 mg/dL, yes/no | 80/78 | 0.1083 | |
| Total cholesterol ≥151 mg/dL, yes/no | 80/78 | 0.3039 | |
| Serum sodium ≥140 mmol/L, yes/no | 82/76 | 0.1847 | |
| Serum ammonia ≥39.5 μg/dL, yes/no | 79/79 | 0.0220 | |
| HOMA‐IR ≥2.55, yes/no | 79/79 | 0.1846 | |
| BTR ≥4.04, yes/no | 79/79 | 0.0276 | |
| Alpha‐fetoprotein ≥4.5 ng/mL, yes/no | 81/77 | 0.1886 | |
| Body mass index ≥25.0 kg/m2, yes/no | 43/115 | 0.2106 | |
| Ascites, yes/no | 33/125 | <0.0001 | |
| Child–Pugh, A/B or C | 96/62 | 0.0065 | |
| Variables | Multivariate analysis | ||
|---|---|---|---|
| Hazard ratio | 95% confidence interval | P value | |
| Age (per 1 year) | 1.026 | 0.998–1.056 | 0.0733 |
| Serum myostatin, high/low | 1.717 | 0.942–3.215 | 0.0778 |
| Psoas muscle index, high/low | 0.229 | 0.108–0.442 | <0.0001 |
| ALT (per 1 IU/L) | 1.015 | 1.002–1.031 | 0.0016 |
| Serum ammonia (per 1 μg/dL) | 1.004 | 0.990–1.018 | 0.5353 |
| BTR (per one) | 0.907 | 0.724–1.121 | 0.3756 |
| Child–Pugh A/B or C | 0.726 | 0.416–1.261 | 0.2545 |
ALT, alanine aminotransferase; AST, aspartate aminotransferase; BTR, branched‐chain amino acid to tyrosine ratio; HCC, hepatocellular carcinoma; HOMA‐IR, homeostasis model assessment of insulin resistance.
Comparison of baseline characteristics between the high‐myostatin group and the low‐myostatin group
Data for comparison of baseline characteristics between the high‐myostatin group and the low‐myostatin group are presented in Table 5. Significant differences were detected between the two groups in terms of PMI for male patients (P < 0.0001), PMI for female patients (P = 0.0175), Child–Pugh classification (P = 0.0206), serum albumin (P < 0.0001), PT (P = 0.0147), serum ammonia (P < 0.0001), BTR (P < 0.0001), and AFP (P = 0.0422).
Table 5.
Comparison of baseline characteristics between the high‐myostatin group and the low‐myostatin group
| Variables | High‐myostatin group | Low‐myostatin group | P value |
|---|---|---|---|
| Age (years) | 68.65 (22.64–85.26) | 66.54 (25.47–89.77) | 0.4379 |
| Gender, male/female | 54/45 | 54/45 | 1.000 |
| Body mass index (kg/m2) | 22.80 (13.05–36.61) | 22.71 (15.34–35.88) | 0.6991 |
| PMI (cm2/m2), men | 4.84 (2.06–8.22) | 6.37 (2.28–9.68) | <0.0001 |
| PMI (cm2/m2), women | 3.87 (1.16–5.84) | 4.25 (0.79–6.70) | 0.0175 |
| Causes of liver disease | |||
| HBV/HCV/alcoholic/others | 9/56/7/27 | 8/60/12/19 | 0.4067 |
| Child–Pugh, A/B/C | 52/45/2 | 72/27/1 | 0.0206 |
| Presence of HCC, yes/no | 24/75 | 16/83 | 0.2150 |
| Total bilirubin (mg/dL) | 1.1 (0.3–4.1) | 1.0 (0.3–6.0) | 0.1406 |
| Serum albumin (g/dL) | 3.4 (2.1–4.5) | 3.7 (2.0–4.9) | <0.0001 |
| Prothrombin time (%) | 71.4 (43.5–115.6) | 78.0 (35.6–106.0) | 0.0147 |
| Platelets (×104/mm3) | 8.4 (2.5–39.8) | 8.6 (2.6–42.4) | 0.2776 |
| Serum sodium (mmol/L) | 140 (127–145) | 140 (133–144) | 0.5895 |
| Serum creatinine (mg/dL) | 0.69 (0.34–4.14) | 0.71 (0.41–2.08) | 0.6987 |
| Total cholesterol (mg/dL) | 148 (70–306) | 153 (82–292) | 0.7749 |
| AST (IU/L) | 48 (18–402) | 38 (16–289) | 0.1003 |
| ALT (IU/L) | 38 (11–487) | 32 (9–233) | 0.4665 |
| Serum ammonia (μg/dL) | 48 (21–132) | 32 (7–77) | <0.0001 |
| HOMA‐IR | 2.44 (0.07–36.41) | 2.62 (0.29–21.14) | 0.9941 |
| BTR | 3.49 (1.46–8.56) | 4.54 (2.53–9.67) | <0.0001 |
| Ascites, yes/no | 22/77 | 13/86 | 0.1354 |
| Alpha‐fetoprotein (ng/mL) | 6.3 (0.8–613.5) | 5.0 (1.0–1345.0) | 0.0422 |
Data are expressed as number or median (range). ALT, alanine aminotransferase; AST, aspartate aminotransferase; BTR, branched‐chain amino acid to tyrosine ratio; HCC, hepatocellular carcinoma; HBV, hepatitis B virus; HCV, hepatitis C virus; HOMA‐IR, homeostasis model assessment of insulin resistance; PMI, psoas muscle index.
The effect of serum myostatin on survival according to age
In patients with a higher age (65 years or more, n = 112), patients in the low‐myostatin group (n = 51) had a significantly higher survival rate than those in the high‐myostatin group (n = 61) (P = 0.0041; Figure 3A). Similarly, in patients with a lower age (less than 65 years, n = 86), patients in the low‐myostatin group (n = 48) had a significantly higher survival rate than those in the high‐myostatin group (n = 38) (P = 0.0193; Figure 3B).
Figure 3.
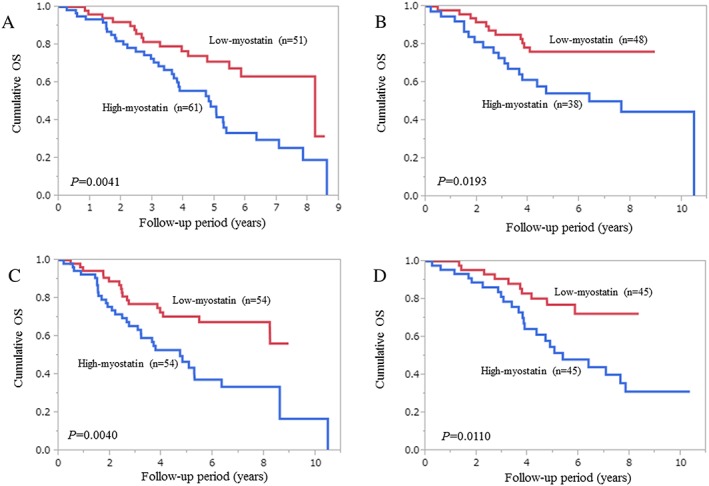
Subgroup analyses with regard to the influence of serum myostatin levels on survival. (A) Patients with a higher age (65 years or more, n = 112); (B) patients with a lower age (less than 65 years, n = 86); (C) male patients (n = 108); and (D) female patients (n = 90).
The effect of serum myostatin on survival according to gender
In men, patients in the low‐myostatin group (n = 54) had a significantly higher survival rate than those in the high‐myostatin group (n = 54) (P = 0.0040; Figure 3C). In the same way, in women, patients in the low‐myostatin group (n = 45) had a significantly higher survival rate than those in the high‐myostatin group (n = 45) (P = 0.0110; Figure 3D).
The effect of serum myostatin on survival according to Child–Pugh classification
In patients with Child–Pugh A (n = 123), patients in the low‐myostatin group (n = 71) had a significantly higher survival rate than those in the high‐myostatin group (n = 52) (P = 0.0011; Figure 4A). In patients with Child–Pugh B or C (n = 75), patients in the low‐myostatin group (n = 28) did not have a significantly higher survival rate than those in the high‐myostatin group (n = 47) (P = 0.1116; Figure 4B).
Figure 4.
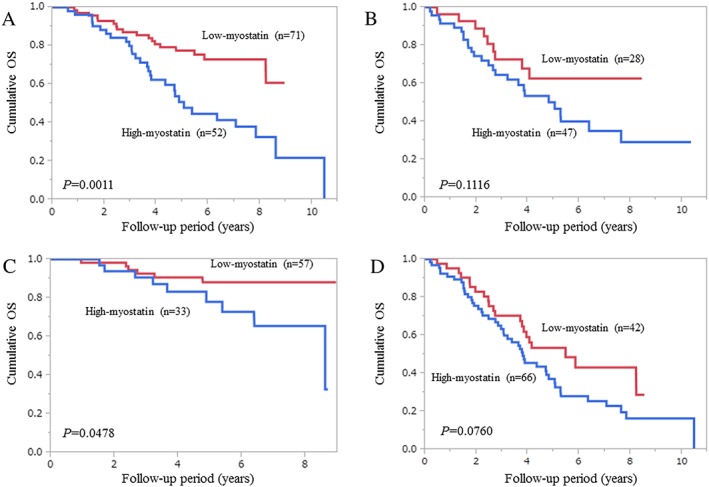
Subgroup analyses with regard to the influence of serum myostatin levels on survival. (A) Child–Pugh A patients (n = 123); (B) Child–Pugh B or C patients (n = 75); (C) patients with a higher psoas muscle index (PMI) (greater than the cut‐off PMI value for each gender (men, 6.36 cm2/m2; women, 3.92 cm2/m2), n = 90); and (D) patients with a lower PMI (less than the cut‐off PMI value for each gender, n = 108).
The effect of serum myostatin on survival according to psoas muscle index
In patients with a higher PMI (greater than the cut‐off PMI value in each gender (men, 6.36 cm2/m2; women, 3.92 cm2/m2), n = 90), patients in the low‐myostatin group (n = 57) had a significantly higher survival rate than those in the high‐myostatin group (n = 33) (P = 0.0478; Figure 4C). In patients with a lower PMI (less than the cut‐off PMI value for each gender, n = 99), patients in the low‐myostatin group (n = 42) tended to have a significantly higher survival rate than those in the high‐myostatin group (n = 66) (P = 0.0760; Figure 4D).
Interventional therapies during the follow‐up period and the effects of myostatin on survival
In hepatitis B virus‐related LC patients (n = 17), 12 patients (70.6%) received nucleoside analogue therapies during their follow‐up period. In HCV‐related LC patients (n = 116), 41 patients achieved a sustained virological response (SVR) to direct acting antiviral therapies (n = 18) or interferon‐based therapies (n = 23). In SVR patients, the difference between the high‐myostatin group (n = 14) and the low‐myostatin group (n = 27) did not reach significance in terms of OS (P = 0.5505). Similarly, in non‐SVR patients, the difference between the high‐myostatin group (n = 50) and the low‐myostatin group (n = 25) did not reach significance in terms of OS (P = 0.5155). However, in the remaining patients (alcoholic or others, n = 65), the difference between the high‐myostatin group (n = 27) and the low‐myostatin group (n = 38) was significant in terms of OS (P = 0.0022).
Discussion
To the best of our knowledge, this is the first study of its kind to examine the influence of serum myostatin level on survival in patients with LC. The expression of myostatin in skeletal muscle is increased in LC patients and believed to be associated with anabolic resistance.21, 28, 41, 42 In our results, for the entire cohort, and subjects without HCC at baseline, higher baseline myostatin levels were associated with significantly worse survival, and this had marginal significance (P = 0.0855 for the entire cohort and P = 0.0778 for patients without HCC) in our multivariate analysis. In addition, similar trends were observed in the subgroups other than Child–Pugh B or C. The reason why the difference in the two groups did not reach significance for subgroups involving Child–Pugh B or C patients is probably due to the small sample size. These results indicate that serum myostatin levels can represent an adverse predictor for LC patients. Recent molecular investigations, using muscle biopsy specimens for patients with LC and healthy controls, have demonstrated increased skeletal muscle expression and almost four‐fold higher plasma concentrations of myostatin in LC patients as compared with controls.23, 30, 43 However, in our data, serum myostatin levels in patients with Child–Pugh B or C were significantly higher than those in patients with Child–Pugh A. In view of these results, serum myostatin levels appeared to be closely linked to liver functional reserve.
Current Japanese guidelines for sarcopenia in liver diseases define male patients with a PMI ≤6.36 cm2/m2 and female patients with a PMI ≤3.92 cm2/m2 as those with reduced muscle mass.5 When these criteria are adapted to our current data, 67 (62.0%) out of 108 male patients had reduced muscle mass, while 41 (45.6%) out of 90 female patients had reduced muscle mass. These differences in the prevalence of reduced muscle mass may be attributed to the difference of baseline serum myostatin levels between male and female patients. On the other hand, cross‐sectional areas (cm2) of skeletal muscles at the L3 level on CT images divided by height squared (skeletal muscle index (cm2/m2)) are reported to be useful for predicting outcomes.44 By using dedicated software (Tomovision, Canada), fatty transformation in the muscle can be excluded, and skeletal muscle mass at the L3 level on CT can be measured precisely, although this practice has limitations in terms of cost and accessibility. While measuring psoas muscle mass at the L3 level on CT by manual tracing is not time‐consuming in clinical settings and is readily available, it may have the disadvantage of lacking accuracy as compared with muscle mass measurement by dedicated software.31
Hyperammonemia has recently attracted much attention as a possible mediator in the liver–muscle axis, and the related up‐regulation of myostatin is regarded as a mechanism of impaired protein synthesis and increased autophagy, which is linked to the development of sarcopenia.10, 24, 25, 26, 42, 45 In our data, serum myostatin significantly correlated with serum ammonia levels and inversely correlated with PMI irrespective of gender. These observations were in line with previous reports and strongly support the hypothesis that skeletal muscle mass depletion can occur via impaired ammonia detoxification and its related higher myostatin expression.10, 24, 25, 26, 42, 45 The significant inverse correlation between serum myostatin level and serum albumin level and BTR in our results may be linked to these earlier observations. In particular, the inverse relationship between myostatin level and BTR suggested that muscle mass loss in LC patients developed via a reduction in protein synthesis.3, 12, 13, 14 On the other hand, because skeletal muscle is predominantly responsible for postprandial glucose disposal, insulin resistance in the skeletal muscle can result in substantial metabolic disturbances.28 In addition, as described earlier, myostatin deficiency has more recently been demonstrated to exert beneficial effects on insulin sensitivity.28, 29 However, in this study, serum myostatin levels did not significantly correlate with homeostasis model assessment of insulin resistance in male or female patients. The reasons for this are unclear, and further investigations will be needed to confirm these results.
In HCV‐related LC subjects, serum myostatin levels did not exert influence on survival irrespective of achieving SVR. However, in non‐B and non‐C (NBNC) LC subjects, the influence of serum myostatin levels on survival was prominent. These differences may be attributed to differences in the cause of death for HCV‐related LC subjects and NBNC LC subjects. Out of 23 NBNC LC mortalities, 18 patients (78.3%) died from liver failure, while out of 52 HCV‐related LC mortalities, 23 patients (44.2%) died from liver failure. As described previously, serum myostatin levels are associated with liver functional reserve; thus, patients with higher myostatin levels tended to die from liver failure rather than tumour progression.
Skeletal muscle fatigue can contribute to impaired exercise capacity, and there is compelling evidence that muscle mass loss is associated with worse survival; there are also limited clinical data demonstrating that the improvement of muscle mass in LC patients can lead to favourable clinical outcomes.8, 10, 22 Thus, reversing skeletal muscle mass is a priority field in therapeutic strategies for LC subjects. Therapeutic advances will thus be able to correct adverse consequences in LC patients. Considering our current results, myostatin antagonists such as follistatin may have the potential to benefit muscle protein turnover; however, the influence of such agents on clinical outcomes have not yet been fully examined, and additional investigations will be required.22, 29, 30
Several limitations need to be acknowledged in our current analysis. Firstly, this study was a single centre retrospective observational study utilizing data acquired from stored serum samples. Secondly, parameters reflecting muscle dysfunction, such as a reduction in hand‐grip strength, were not included into our analysis. In future studies, the relationship between skeletal muscle function and serum myostatin level should be examined further. Thirdly, the number of Child–Pugh C patients was very small, and our results cannot be applied to such patients. Finally, during the observation period, various interventional therapies for underlying liver diseases were performed in each patient, potentially leading to bias. However, our study results suggested that higher serum myostatin levels correlated with muscle mass loss, hyperammonemia, and impaired protein synthesis as reflected by lower serum albumin level and lower BTR, and higher serum myostatin levels were associated with adverse clinical outcomes for LC patients.
In conclusion, serum myostatin represents a promising target for predicting the clinical outcomes of patients with LC.
Conflicts of interest
None of the authors has any conflicts of interest to declare.
Acknowledgements
The authors would like to thank all medical staff in our hospital for their help with data collection. The authors certify that they have complied with the ethical guidelines for authorship and publishing of the Journal of Cachexia, Sarcopenia, and Muscle update 2015.46
Nishikawa, H. , Enomoto, H. , Ishii, A. , Iwata, Y. , Miyamoto, Y. , Ishii, N. , Yuri, Y. , Hasegawa, K. , Nakano, C. , Nishimura, T. , Yoh, K. , Aizawa, N. , Sakai, Y. , Ikeda, N. , Takashima, T. , Takata, R. , Iijima, H. , and Nishiguchi, S. (2017) Elevated serum myostatin level is associated with worse survival in patients with liver cirrhosis. Journal of Cachexia, Sarcopenia and Muscle, 8: 915–925. doi: 10.1002/jcsm.12212.
References
- 1. Periyalwar P, Dasarathy S. Malnutrition in cirrhosis: contribution and consequences of sarcopenia on metabolic and clinical responses. Clin Liver Dis 2012;16:95–131. [DOI] [PMC free article] [PubMed] [Google Scholar]
- 2. Cruz‐Jentoft AJ, Landi F, Schneider SM, Zúñiga C, Arai H, Boirie Y, et al. Prevalence of and interventions for sarcopenia in ageing adults: a systematic review. Report of the International Sarcopenia Initiative (EWGSOP and IWGS). Age Ageing 2014;43:748–759. [DOI] [PMC free article] [PubMed] [Google Scholar]
- 3. Sinclair M, Gow PJ, Grossmann M, Angus PW. Review article: sarcopenia in cirrhosis – aetiology, implications and potential therapeutic interventions. Aliment Pharmacol Ther 2016;43:765–777. [DOI] [PubMed] [Google Scholar]
- 4. Hanai T, Shiraki M, Nishimura K, Ohnishi S, Imai K, Suetsugu A, et al. Sarcopenia impairs prognosis of patients with liver cirrhosis. Nutrition 2015;31:193–199. [DOI] [PubMed] [Google Scholar]
- 5. Nishikawa H, Shiraki M, Hiramatsu A, Moriya K, Hino K, Nishiguchi S. JSH guidelines for sarcopenia in liver disease (first edition): recommendation from the working group for creation of sarcopenia assessment criteria in the JSH. 2016; 46(10): 951–963. [DOI] [PubMed] [Google Scholar]
- 6. Santilli V, Bernetti A, Mangone M, Paoloni M. Clinical definition of sarcopenia. Clin Cases Miner Bone Metab 2014;11:177–180. [PMC free article] [PubMed] [Google Scholar]
- 7. Nardelli S, Lattanzi B, Torrisi S, Greco F, Farcomeni A, Gioia S, et al. Sarcopenia is risk factor for development of hepatic encephalopathy after transjugular intrahepatic portosysthemic shunt placement. Clin Gastroenterol Hepatol 2016. Nov 2. pii: S1542‐3565(16)30999‐5. https://doi.org/10.1016/j.cgh.2016.10.028. [Epub ahead of print] [DOI] [PubMed] [Google Scholar]
- 8. Dasarathy S. Consilience in sarcopenia of cirrhosis. J Cachexia Sarcopenia Muscle 2012;3:225–237. [DOI] [PMC free article] [PubMed] [Google Scholar]
- 9. Montano‐Loza AJ. Clinical relevance of sarcopenia in patients with cirrhosis. World J Gastroenterol 2014;20:8061–8071. [DOI] [PMC free article] [PubMed] [Google Scholar]
- 10. Dasarathy S, Merli M. Sarcopenia from mechanism to diagnosis and treatment in liver disease. J Hepatol 2016;65:1232–1244. [DOI] [PMC free article] [PubMed] [Google Scholar]
- 11. St‐Onge MP. Relationship between body composition changes and changes in physical function and metabolic risk factors in aging. Curr Opin Clin Nutr Metab Care 2005;8:523–528. [PubMed] [Google Scholar]
- 12. Cheung K, Lee SS, Raman M. Prevalence and mechanisms of malnutrition in patients with advanced liver disease, and nutrition management strategies. Clin Gastroenterol Hepatol 2012;10:117–125. [DOI] [PubMed] [Google Scholar]
- 13. Charlton MR. Branched‐chain amino acid enriched supplements as therapy for liver disease. J Nutr 2006;136:295S–298S. [DOI] [PubMed] [Google Scholar]
- 14. Kawaguchi T, Izumi N, Charlton MR, Sata M. Branched‐chain amino acids as pharmacological nutrients in chronic liver disease. Hepatology 2011;54:1063–1070. [DOI] [PubMed] [Google Scholar]
- 15. Itoh S, Shirabe K, Matsumoto Y, Yoshiya S, Muto J, Harimoto N, et al. Effect of body composition on outcomes after hepatic resection for hepatocellular carcinoma. Ann Surg Oncol 2014;21:3063–3068. [DOI] [PubMed] [Google Scholar]
- 16. Fujiwara N, Nakagawa H, Kudo Y, Tateishi R, Taguri M, Watadani T, et al. Sarcopenia, intramuscular fat deposition, and visceral adiposity independently predict the outcomes of hepatocellular carcinoma. J Hepatol 2015;63:131–140. [DOI] [PubMed] [Google Scholar]
- 17. Harimoto N, Shirabe K, Yamashita YI, Ikegami T, Yoshizumi T, Soejima Y, et al. Sarcopenia as a predictor of prognosis in patients following hepatectomy for hepatocellular carcinoma. Br J Surg 2013;100:1523–1530. [DOI] [PubMed] [Google Scholar]
- 18. Iritani S, Imai K, Takai K, Hanai T, Ideta T, Miyazaki T, et al. Skeletal muscle depletion is an independent prognostic factor for hepatocellular carcinoma. J Gastroenterol 2015;50:323–332. [DOI] [PubMed] [Google Scholar]
- 19. Kamachi S, Mizuta T, Otsuka T, Nakashita S, Ide Y, Miyoshi A, et al. Sarcopenia is a risk factor for the recurrence of hepatocellular carcinoma after curative treatment. Hepatol Res 2016;46:201–208. [DOI] [PubMed] [Google Scholar]
- 20. Harimoto N, Yoshizumi T, Shimokawa M, Sakata K, Kimura K, Itoh S, et al. Sarcopenia is a poor prognostic factor following hepatic resection in patients 70 years of age and older with hepatocellular carcinoma. Hepatol Res 2016. Feb 15; https://doi.org/10.1111/hepr.12674. [Epub ahead of print]. [DOI] [PubMed] [Google Scholar]
- 21. McPherron AC, Lawler AM, Lee SJ. Regulation of skeletal muscle mass in mice by a new TGF‐beta superfamily member. Nature 1997;387:83–90. [DOI] [PubMed] [Google Scholar]
- 22. Elkina Y, von Haehling S, Anker SD, Springer J. The role of myostatin in muscle wasting: an overview. J Cachexia Sarcopenia Muscle 2011;2:143–151. [DOI] [PMC free article] [PubMed] [Google Scholar]
- 23. García PS, Cabbabe A, Kambadur R, Nicholas G, Csete M. Brief‐reports: elevated myostatin levels in patients with liver disease: a potential contributor to skeletal muscle wasting. Anesth Analg 2010;111:707–709. [DOI] [PubMed] [Google Scholar]
- 24. Qiu J, Thapaliya S, Runkana A, Yang Y, Tsien C, Mohan ML, et al. Hyperammonemia in cirrhosis induces transcriptional regulation of myostatin by an NF‐κB‐mediated mechanism. Proc Natl Acad Sci U S A 2013;110:18162–18167. [DOI] [PMC free article] [PubMed] [Google Scholar]
- 25. Davuluri G, Krokowski D, Guan BJ, Kumar A, Thapaliya S, Singh D, et al. Metabolic adaptation of skeletal muscle to hyperammonemia drives the beneficial effects of l‐leucine in cirrhosis. J Hepatol 2016;65:929–937. [DOI] [PMC free article] [PubMed] [Google Scholar]
- 26. Dasarathy S. Cause and management of muscle wasting in chronic liver disease. Curr Opin Gastroenterol 2016;32:159–165. [DOI] [PMC free article] [PubMed] [Google Scholar]
- 27. Thapaliya S, Runkana A, McMullen MR, Nagy LE, McDonald C, Naga Prasad SV, et al. Alcohol‐induced autophagy contributes to loss in skeletal muscle mass. Autophagy 2014;10:677–690. [DOI] [PMC free article] [PubMed] [Google Scholar]
- 28. Cleasby ME, Jamieson PM, Atherton PJ. Insulin resistance and sarcopenia: mechanistic links between common co‐morbidities. J Endocrinol 2016;229:R67–R81. [DOI] [PubMed] [Google Scholar]
- 29. Sharma M, McFarlane C, Kambadur R, Kukreti H, Bonala S, Srinivasan S. Myostatin: expanding horizons. IUBMB Life 2015;67:589–600. [DOI] [PubMed] [Google Scholar]
- 30. Rinnov AR, Plomgaard P, Pedersen BK, Gluud LL. Impaired follistatin secretion in cirrhosis. J Clin Endocrinol Metab 2016;101:3395–3400. [DOI] [PubMed] [Google Scholar]
- 31. Hamaguchi Y, Kaido T, Okumura S, Kobayashi A, Hammad A, Tamai Y, et al. Proposal of new criteria of low skeletal muscle mass using computed tomography imaging in Asia: analysis of 541 healthy adults. Nutrition 2016;32:1200–1205. [DOI] [PubMed] [Google Scholar]
- 32. Chindapasirt J. Sarcopenia in cancer patients. Asian Pac J Cancer Prev 2015;16:8075–8077. [DOI] [PubMed] [Google Scholar]
- 33. Meriggi F. Cancer cachexia: one step ahead. Rev Recent Clin Trials 2015;10:246–250. [DOI] [PubMed] [Google Scholar]
- 34. Kudo M, Zheng RQ, Kim SR, Okabe Y, Osaki Y, Iijima H, et al. Diagnostic accuracy of imaging for liver cirrhosis compared to histologically proven liver cirrhosis. A multicenter collaborative study. Intervirology 2008;51:17–26. [DOI] [PubMed] [Google Scholar]
- 35. Zarski JP, Sturm N, Guechot J, Paris A, Zafrani ES, Asselah T, et al., ANRS HCEP 23 Fibrostar Group . Comparison of nine blood tests and transient elastography for liver fibrosis in chronic hepatitis C: the ANRS HCEP‐23 study. J Hepatol 2012;56:55–62. [DOI] [PubMed] [Google Scholar]
- 36. Tsochatzis EA, Gurusamy KS, Ntaoula S, Cholongitas E, Davidson BR, Burroughs AK. Elastography for the diagnosis of severity of fibrosis in chronic liver disease: a meta‐analysis of diagnostic accuracy. J Hepatol 2011;54:650–659. [DOI] [PubMed] [Google Scholar]
- 37. Fukui H, Saito H, Ueno Y, Uto H, Obara K, Sakaida I, et al. Evidence‐based clinical practice guidelines for liver cirrhosis 2015. J Gastroenterol 2016;51:629–650. [DOI] [PubMed] [Google Scholar]
- 38. Kumada H, Okanoue T, Onji M, Moriwaki H, Izumi N, Tanaka E, et al., Study Group for the Standardization of Treatment of Viral Hepatitis Including Cirrhosis, Ministry of Health, Labour and Welfare of Japan . Guidelines for the treatment of chronic hepatitis and cirrhosis due to hepatitis C virus infection for the fiscal year 2008 in Japan. Hepatol Res 2010;40:8–13. [DOI] [PubMed] [Google Scholar]
- 39. Kappus MR, Mendoza MS, Nguyen D, Medici V, McClave SA. Sarcopenia in patients with chronic liver disease: can it be altered by diet and exercise? Curr Gastroenterol Rep 2016;18:43. [DOI] [PubMed] [Google Scholar]
- 40. European Association For The Study Of The Liver . European Organisation for Research and Treatment of Cancer: EASL‐EORTC clinical practice guidelines: management of hepatocellular carcinoma. J Hepatol 2012;56:908–943. [DOI] [PubMed] [Google Scholar]
- 41. Kudo M, Izumi N, Kokudo N, Matsui O, Sakamoto M, Nakashima O, et al., HCC Expert Panel of Japan Society of Hepatology . Management of hepatocellular carcinoma in Japan: consensus‐based clinical practice guidelines proposed by the Japan Society of Hepatology (JSH) 2010 updated version. Dig Dis 2011;29:339–364. [DOI] [PubMed] [Google Scholar]
- 42. Hakvoort TB, He Y, Kulik W, Vermeulen JL, Duijst S, Ruijter JM, et al. Pivotal role of glutamine synthetase in ammonia detoxification. Hepatology 2017;65:281–293. [DOI] [PubMed] [Google Scholar]
- 43. Gonzalez‐Cadavid NF, Taylor WE, Yarasheski K, Sinha‐Hikim I, Ma K, Ezzat S, et al. Organization of the human myostatin gene and expression in healthy men and HIV‐infected men with muscle wasting. Proc Natl Acad Sci U S A 1998;95:14938–14943. [DOI] [PMC free article] [PubMed] [Google Scholar]
- 44. Martin L, Birdsell L, Macdonald N, Reiman T, Clandinin MT, McCargar LJ, et al. Cancer cachexia in the age of obesity: skeletal muscle depletion is a powerful prognostic factor, independent of body mass index. J Clin Oncol 2013;31:1539–1547. [DOI] [PubMed] [Google Scholar]
- 45. Stern RA, Ashwell CM, Dasarathy S, Mozdziak PE. The effect of hyperammonemia on myostatin and myogenic regulatory factor gene expression in broiler embryos. Animal 2015;9:992–999. [DOI] [PMC free article] [PubMed] [Google Scholar]
- 46. von Haehling S, Morley JE, Coats AJS, Anker SD. Ethical guidelines for publishing in the Journal of Cachexia, Sarcopenia and Muscle: update 2015. J Cachexia Sarcopenia Muscle 2015;6:315–316. [DOI] [PMC free article] [PubMed] [Google Scholar]