Abstract
Purpose:
The objective of this study is to evaluate the diagnostic ability of retinal nerve fiber layer (RNFL), macular, optic nerve head (ONH) parameters in healthy subjects, ocular hypertension (OHT), preperimetric glaucoma (PPG), and early glaucoma (EG) patients, to reveal factors affecting the diagnostic ability of spectral domain-optical coherence tomography (SD-OCT) parameters and risk factors for glaucoma.
Methods:
Three hundred and twenty-six eyes (89 healthy, 77 OHT, 94 PPG, and 66 EG eyes) were analyzed. RNFL, macular, and ONH parameters were measured with SD-OCT. The area under the receiver operating characteristic curve (AUC) and sensitivity at 95% specificity was calculated. Logistic regression analysis was used to determine the glaucoma risk factors. Receiver operating characteristic regression analysis was used to evaluate the influence of covariates on the diagnostic ability of parameters.
Results:
In PPG patients, parameters that had the largest AUC value were average RNFL thickness (0.83) and rim volume (0.83). In EG patients, parameter that had the largest AUC value was average RNFL thickness (0.98). The logistic regression analysis showed average RNFL thickness was a risk factor for both PPG and EG. Diagnostic ability of average RNFL and average ganglion cell complex thickness increased as disease severity increased. Signal strength index did not affect diagnostic abilities. Diagnostic ability of average RNFL and rim area increased as disc area increased.
Conclusion:
When evaluating patients with glaucoma, patients at risk for glaucoma, and healthy controls RNFL parameters deserve more attention in clinical practice. Further studies are needed to fully understand the influence of covariates on the diagnostic ability of OCT parameters.
Keywords: Area under receiver operating characteristic curve, ganglion cell complex, optic nerve head, retinal nerve fiber layer, spectral domain-optical coherence tomography
Glaucoma is an optic neuropathy characterized by progressive loss of retinal ganglion cells (RGCs) and their axons, eventually resulting in visual field loss.[1,2] Spectral domain optical coherence tomography (SD-OCT) is an important diagnostic tool for glaucoma, which enables measurement of retinal nerve fiber layer (RNFL), optic nerve head (ONH) and macular parameters.
Standard automated perimetry, which is the gold standard diagnostic test for glaucomatous optic neuropathy, detects visual-field defects by the time 30%–50% of RGCs were lost.[3] Identifying RGC loss as early as possible is of paramount importance to prevent the development of irreversible visual-field defects. At this point, SD-OCT comes forward with its ability to detect early RGC loss with quantitative assessment of several parameters linked to glaucoma.[4,5]
This is a comprehensive study evaluating both diagnostic ability of OCT parameters and covariates affecting diagnostic ability of OCT parameters, in addition to determining risk factors for glaucoma. Several studies have been carried out to evaluate the diagnostic ability of different OCT parameters for glaucoma.[6,7,8,9,10,11,12,13,14,15,16,17,18,19,20,21] We aimed to conduct a study with four study groups to investigate every aspect of OCT parameters in glaucoma diagnosis and elicit the more important parameters in clinical practice.
Methods
Patients
This study included 237 eyes of 122 patients that have been followed at Glaucoma Unit of Umraniye Training and Research Hospital at least for 2 years and 89 eyes of 45 healthy controls that were selected randomly from general ophthalmology clinic. Of the 237 eyes, 77 were followed with ocular hypertension (OHT) diagnosis, 94 were followed with preperimetric glaucoma (PPG) diagnosis, and 66 were followed with early glaucoma (EG) diagnosis. All patients had been followed by one particular glaucoma expert. Informed consent was obtained from all study subjects. This study adhered to the tenets of the Declaration of Helsinki and the research protocol was approved from Local Ethic Committee.
All patients underwent full ophthalmic examination including review of medical history, measurement of best-corrected visual acuity (BCVA), and intraocular pressure (IOP) using Goldmann applanation tonometry, gonioscopy, dilated fundus examination with 90 D lens, ultrasound pachymetry, visual-field examination with the Humphrey Field Analyzer (HFA) (Carl Zeiss Meditec, Jena, Germany) Swedish Interactive Threshold Algorithm (SITA) 24-2 test and measurement of RNFL, macular, and ONH parameters with SD-OCT (RTVue-100; Optovue, Fremont, CA, USA).
Inclusion criteria were BCVA of at least 20/40, spherical refraction <±6.0 D, cylinder correction <3.0 D, open angle with gonioscopy, at least two reliable HFA SITA test results with a fixation loss of <20%, false-negative error of <15%, and false-positive error of <15%. Patients with coexisting retinal disease, uveitis, nonglaucomatous optic disc neuropathy, and any other disease resulting in visual field defects were excluded from the study.
Four groups of eyes were included (healthy, OHT, PPG and EG eyes). Healthy eyes were defined as those who had no history of intraocular surgery, no first-degree relative with glaucoma, IOP <21 mmHg, normal optic disc appearance and normal visual-field test with mean deviation (MD) >−2 dB. OHT eyes were defined as those who had IOP of >21 mmHg, normal optic disc appearance, and normal visual-field test with MD >−2 dB. PPG eyes were defined as those who had glaucomatous changes (focal/diffuse neuroretinal rim loss, notching, nerve fiber layer defects) during follow-up and normal visual field test with MD >−2 dB. EG eyes were defined as those who had glaucomatous changes (focal/diffuse neuroretinal rim loss, notching, nerve fiber layer defects) during follow-up and visual-field defects classified according to Hodapp-Parrish-Andersons criteria[22] in which EG defects described as having one of these with a MD >−6 dB: a cluster of 3 or more nonedge points with P < 5% and at least 1 point with P < 1% in the pattern deviation probability plot; pattern standard deviation (PSD) of <5%; or glaucoma hemifield test results outside normal limits.
Optical coherence tomography
OCT measurements were performed using RTVue-100 (software version 6.1.0.4; Optovue Inc., Fremont, CA, USA). The RTVue-100 is one of the SD-OCT devices with a scan rate of 26 000 A scans per se cond and an axial resolution of 5 μm, allowing fast imaging of the retinal microstructure at high resolution. ONH protocol and ganglion cell complex (GCC) protocol were used. Good quality images with a signal strength index (SSI) ≥50 were included.
Optic nerve head scan
The ONH protocol was used to obtain RNFL and ONH measurements. In the measurement of RNFL parameters, ONH protocol generates a polar RNFL thickness map from which RNFL thickness is measured along a circle 3.45 mm in diameter centered on the optic disc. Parameters including overall average, superior hemisphere, inferior hemisphere, temporal quadrant, superior quadrant, inferior quadrant, and nasal quadrant are provided. In the measurement of ONH parameters, ONH protocol consists of 12 radial scans 3.4 mm in length and 13 concentric ring scans ranging from 1.3 to 4.9 mm in diameter all centered on the optic disc. Retinal pigment epithelium (RPE) tips are detected by the software, and the optic disc margins are delinated automatically by joining the RPE tips. The optic cup is also automatically defined by the software by intersecting the nerve head inner boundary and a parallel line that is 150 μm above the joining line of the RPE tips. Parameters including disc area, rim area, rim volume, vertical cup-to-disc (C/D) ratio, horizontal C/D ratio, cup area, cup volume, C/D area ratio, and nerve head volume are provided.
Ganglion cell complex scan
The GCC protocol was used to obtain macular measurements. In the measurement of macular parameters, GCC protocol scans a 7 mm square region with 15 vertical lines at 0.55 mm intervals and 1 horizontal line. A 6 mm diameter circle inside the scanned region is centered 1 mm temporal to the fovea which provides analysis of the nasal visual field where glaucomatous damage is most likely to occur. This macular B-scan evaluates macular total retinal (TR) measurement in two layers: GCC and OR layers. GCC is composed of ganglion cell layer, nevre fiber layer, and inner plexiform layer. GCC parameters including overall average thickness, superior thickness, inferior thickness, superior minus inferior thickness, global loss volume (GLV), and focal loss volume (FLV) are provided. GLV shows the average GCC loss over the entire GCC map. FLV shows local GCC loss using a pattern deviation map to correct for overall absolute changes. TR and OR parameters including overall average thickness, superior thickness, inferior thickness, and superior minus inferior thickness are also provided.
Statistical analyses
Number Cruncher Statistical System 2007 (Kaysville, Utah, USA) software was used for the statistical analyses. Shapiro–Wilk test was used to test the distribution of numerical data. Linear-mixed model was used in the comparison of normally distributed data. Generalized linear mixed model was used in the comparison of nonnormally distributed data. The ability of the each parameter to differentiate between patient groups and healthy subjects defined as diagnostic ability and it is evaluated by area under the receiver operating characteristic curve (AUC). Sensitivity at fixed specificity of 95% was calculated for each parameter. A bootstrap resampling procedure (n = 1000 samples) was used to determine confidence intervals. As measurements from both eyes from the same subject are likely to be correlated, the cluster of the data for the study subject is considered as the unit of resampling when calculating standard errors. This method has been used when multiple correlated measurements of the same unit are present.[23] AUC of each parameter was compared using the Delong test. Sensitivity at 95% specificity of each parameter was compared using the Z-test. To determine which parameters were associated with glaucoma, we used a backward selection method to find which parameters reached a significance level of <0.25. Then, logistic regression analysis was used to determine the factors that were significantly associated with PPG and EG. Receiver operating characteristic (ROC) regression analysis was used to evaluate the influence of covariates on the diagnostic ability of certain OCT parameters. This method was previously described by Medeiros et al.[24] for the evaluation of the influence of covariates on the performance of diagnostic tests in glaucoma. ROC curves for specific values of covariates can be obtained with this model. P < 0.05 was considered to be significant in all statistical analysis.
Results
Patients
Demographics and clinical characteristics of the study subjects are shown in Table 1. Age of the study subjects was significantly different in all comparisons except when comparing OHT patients with PPG patients. MD and PSD values were significantly lower in EG patients than every other study group.
Table 1.
Demographics and clinical characteristics of the study participants

Optical coherence tomography parameters
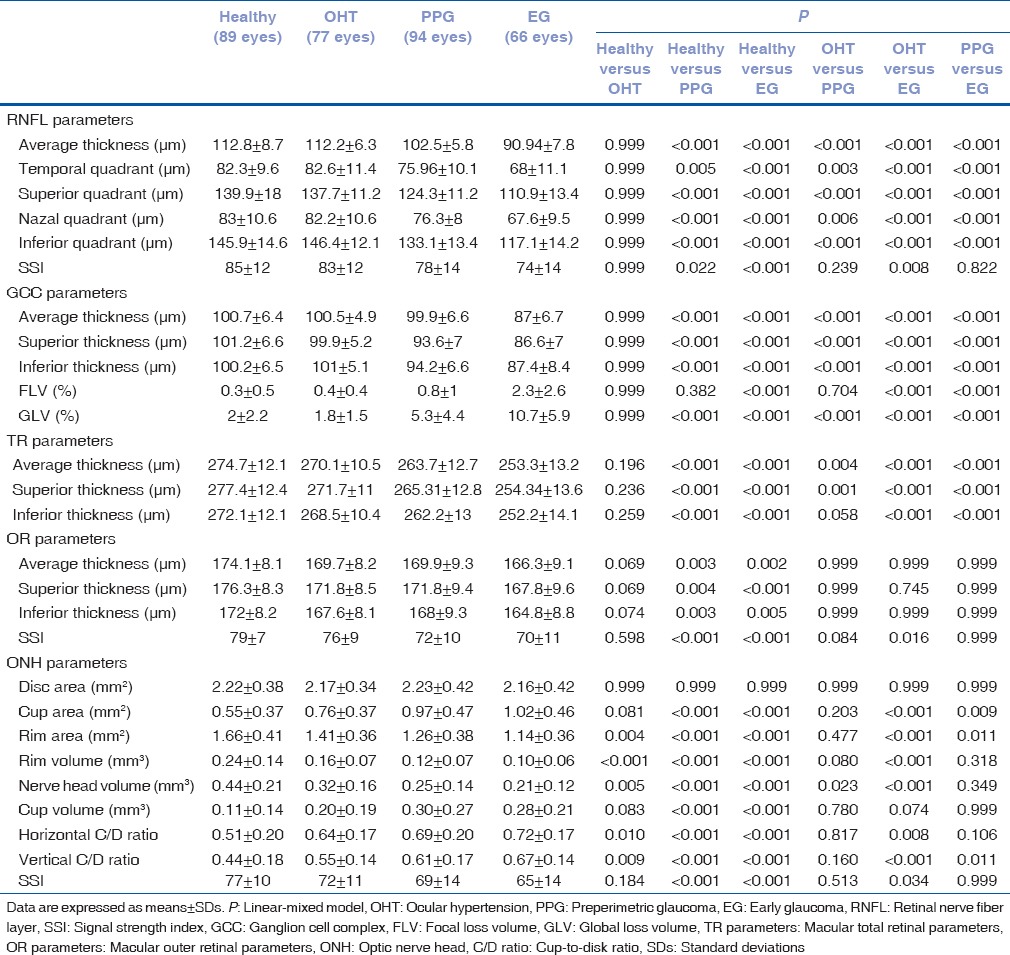
Comparison of the OCT parameters among the study groups is shown in Table 2. Almost all parameters decreased from healthy subjects to EG patients. FLV, GLV, cup area, cup volume, horizontal, and vertical C/D ratio values increased from healthy subjects to EG patients. Almost all comparisons were statistically significant among the study groups except for comparisons between healthy subjects and OHT patients and comparisons involving OR parameters and disc area. In addition, comparisons of PPG patients with OHT and EG patients for the ONH parameters were not statistically significant.
Table 2.
Comparison of the optical coherence tomography parameters among the study groups
Area under the receiver operating characteristic curves and sensitivities at 95% specificity
The AUC and sensitivity at 95% specificity of the OCT parameters to diagnose PPG and EG are shown in Table 3. When discriminating between healthy controls and PPG patients, OCT parameters that had the largest AUC value in their groups were average RNFL thickness (0.83), superior GCC thickness (0.79), superior TR thickness (0.76), superior OR thickness (0.64), and rim volume (0.83) [Fig. 1]. Pairwise comparisons did not show statistically significant differences between the AUC values of these parameters except for superior OR thickness [Table 4]. When discriminating between healthy controls and EG patients, OCT parameters that had the largest AUC value in their groups were average RNFL thickness (0.98), superior GCC thickness (0.94), superior TR thickness (0.90), superior OR thickness (0.75), and rim volume (0.90) [Fig. 2]. Average RNFL thickness performed significantly better in pairwise comparisons [Table 4].
Table 3.
The area under receiver operating characteristic curve and sensitivity at 95% specificity of the optical coherence tomography parameters to diagnose preperimetric glaucoma and early glaucoma
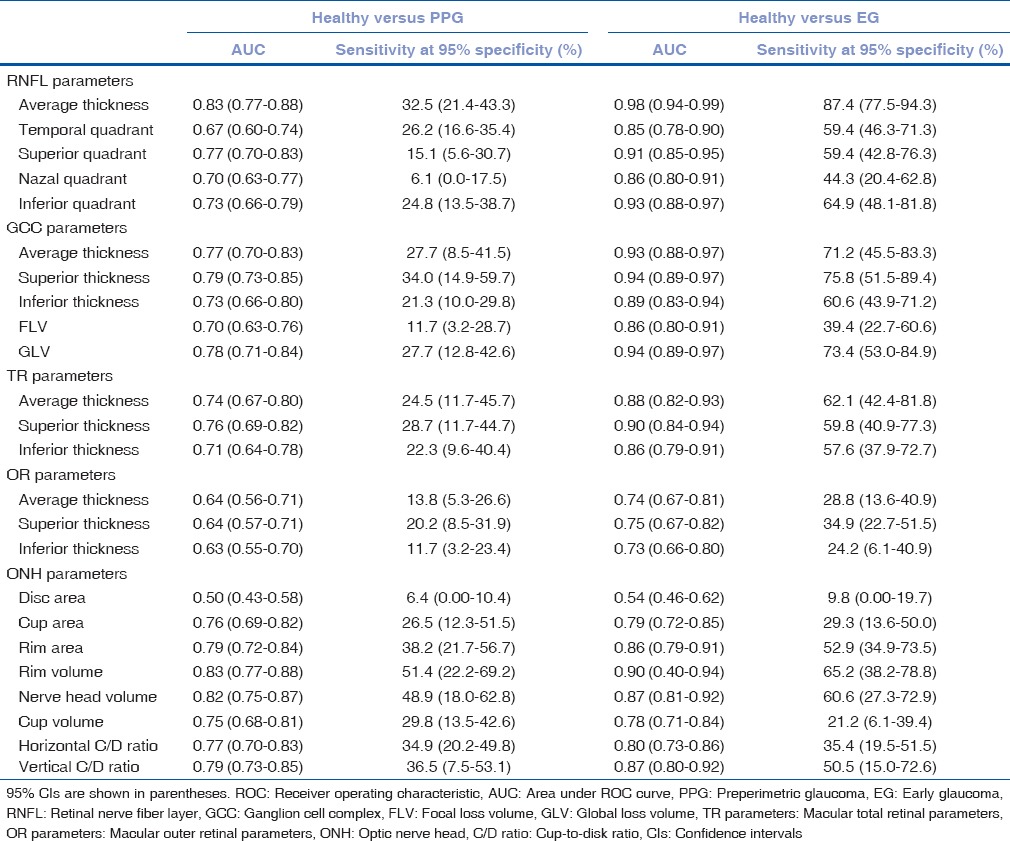
Figure 1.
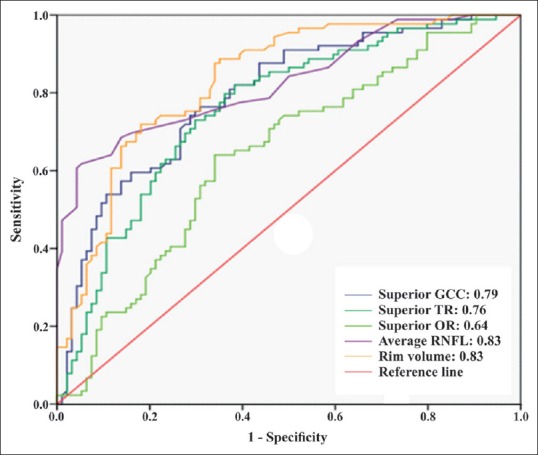
The area under the receiver operating characteristic curves of the best optical coherence tomography parameters in their groups for discriminating between healthy subjects and preperimetric glaucoma patients
Table 4.
The difference between area under receiver operating characteristic curve value of retinal nerve fiber layer, ganglion cell complex, total retinal, outer retinal, and optic nerve head parameters that had the largest area under receiver operating characteristic curve value in their groups
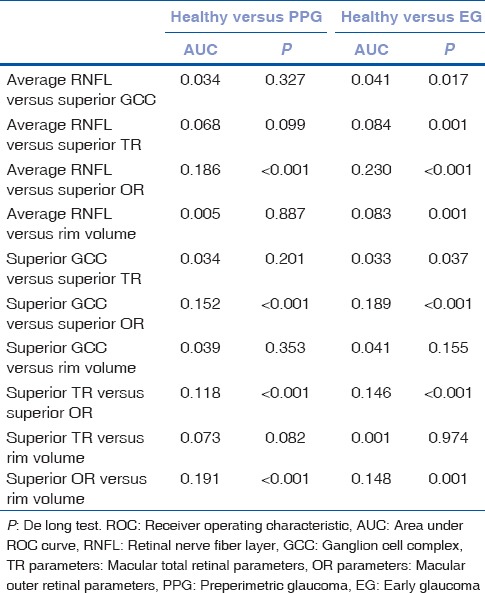
Figure 2.
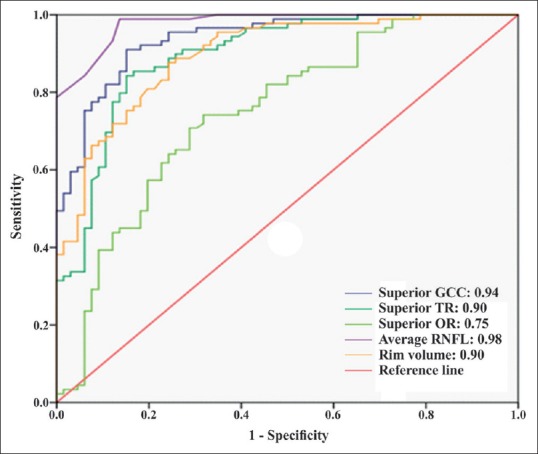
The area under the receiver operating characteristic curves of the best optical coherence tomography parameters in their groups for discriminating between healthy controls and early glaucoma patients
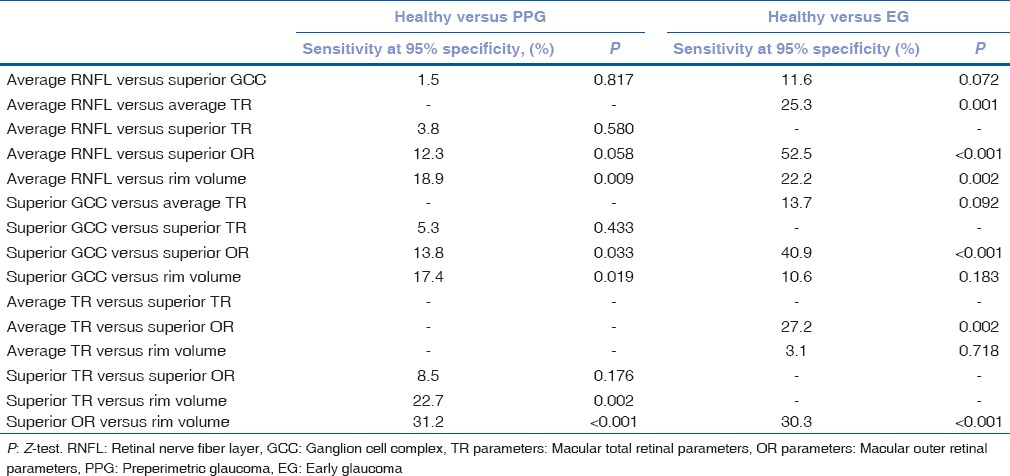
When discriminating between healthy subjects and PPG patients, OCT parameters that had the largest sensitivity at 95% specificity in their groups were average RNFL thickness (32.5%), superior GCC thickness (34.0%), superior TR thickness (28.7%), superior OR thickness (20.2%) and rim volume (51.4%). In pairwise comparisons, rim volume had significantly the highest sensitivity at 95% specificity [Table 5]. When discriminating between healthy subjects and EG patients, OCT parameters that had the largest sensitivity at 95% specificity in their groups were average RNFL thickness (87.4%), superior GCC thickness (75.8%), average TR thickness (62.1%), superior OR thickness (34.9%), and rim volume (65.2%). In pairwise comparisons, average RNFL thickness had significantly the highest sensitivity at 95% specificity except for superior GCC thickness [Table 5].
Table 5.
The difference between sensitivity at 95% specificity value of retinal nerve fiber layer, ganglion cell complex, total retinal, outer retinal, and optic nerve head parameters that had the largest sensitivity at 95% specificity value in their groups
Logistic regression analysis
The logistic regression analysis showed that average RNFL thickness was a risk factor for both PPG (odds ratio = 0.79, P < 0.001) and EG (odds ratio = 0.49, P = 0.001) [Table 6].
Table 6.
The logistic regression analysis for the optical coherence tomography parameters as glaucoma risk factors in preperimetric glaucoma and early glaucoma patients

Receiver operating characteristic regression analysis
The influence of disease severity, disk area, and SSI as covariates on the diagnostic ability of certain OCT parameters is shown in Table 7. Diagnostic ability of average RNFL and average GCC thickness increased as MD decreased (disease severity increased) (−1.8; P = 0.003 and − 2.0; P = 0.044, respectively). SSI did not have any influence on diagnostic ability. Diagnostic ability of average RNFL and rim area increased as disk area increased (4.08; P = 0.014 and 0.33; P = 0.023, respectively).
Table 7.
The influence of disease severity (based on median deviation), disk area, and signal strength index as covariates on the diagnostic ability of certain optic coherence tomography parameters in early glaucoma patients

Discussion
Glaucoma is a multifactorial disease that must be treated before irreversible damage to the RGCs occurs. In this study, we investigated several OCT parameters with different patient groups and healthy subjects to reveal the parameter that is the most crucial in the early diagnosis of glaucoma.
This study included OHT, PPG, and EG patient groups to investigate the change in OCT parameters at patients who are at risk for glaucoma, who have early signs of glaucoma and who have glaucoma. OCT parameters decreased/increased accordingly from healthy subjects to EG patients as expected. Comparison of healthy subjects with OHT patients was not statistically significant as reported in earlier studies.[6,7,8] Comparisons for OR parameters were significant only when comparing healthy controls with PPG and EG patients. This finding agrees with other studies suggesting that OR parameters are affected less during the course of glaucoma.[4,25,26]
In the comparison of PPG patients with EG patients for the ONH parameters, the difference was not significant unlike RNFL, GCC, and TR parameters. Diagnosis of PPG was based on glaucomatous changes in the optic disk before development of visual-field defects. This finding shows observation of glaucomatous changes and measurement of ONH parameters has similar courses that there was not significant difference in the ONH parameters.
In the comparison of ONH parameters between OHT parameters and healthy controls, there was a significant difference between two groups, but the difference was not significant when comparing OHT patients with PPG patients. This finding puts OHT patients in a closer position to PPG patients unlike other OCT parameters and is needed to be explored in ONH parameters for OHT patients basis.
AUCs to differentiate EG patients from healthy controls was larger than AUCs to differentiate PPG patients from healthy controls as shown earlier in a study that calculates AUCs to differentiate both groups.[9] The diagnostic ability of GCC, TR, and ONH parameters were good and comparable to RNFL parameters in PPG patients. Lisboa et al.[10] reported similar AUC values in PPG patients for all parameter groups but showed that RNFL parameters performed significantly better than ONH parameters. In their study, the control group consisted of glaucoma suspects with suspicious optic disc appearance that resulted in the poorer diagnostic performance of ONH parameters. In our study, the control group consisted of subjects with healthy optic disk appearance that resulted in ONH parameters to have similar diagnostic performance to RNFL parameters in PPG patients.
Diagnostic ability of both RNFL and ONH parameters increased in EG patients as mentioned earlier. However, RNFL parameters outrun other parameters and performed significantly better in all comparisons in EG patients. On the contrary, Sung et al.[11] reported that diagnostic performance of ONH parameters was inferior to average RNFL thickness, especially in early glaucomatous eyes but became similar in advanced glaucomatous eyes. In our study, moderate/advanced glaucomatous eyes were not included. In the diagnosis of PPG, we followed patients with glaucoma suspicion at least for 2 years for the optic disk changes. This resulted in higher diagnostic ability of ONH parameters when differentiating PPG patients from healthy controls. However, with the increasing disease severity, RNFL parameters performed better than ONH parameters. Sensitivity at 95% and specificity of ONH parameters were higher than other parameters in the diagnosis of PPG patients for the reasons mentioned above.
The diagnostic ability of RNFL, GCC, TR, and ONH parameters were good in EG patients. Rao et al.[12] reported similar AUC values for RNFL, GCC, and ONH parameters in EG patients. In some studies, GCC parameters showed similar diagnostic ability with RNFL parameters.[8,13,14,15,16,17,18,19] Moreno et al.[20] reported that GCC parameters have slightly superior ability to discriminate between eyes with EG and controls. Schulze et al.[7] reported that GCC parameters were slightly inferior to RNFL parameters in EG patients. In the diagnosis of PPG patients, Lisboa et al.[10] showed that RNFL parameters performed significantly better than macular measurements. In our study, RNFL parameters performed better than other parameters in EG patients. In that aspect, though GCC parameters can be evaluated in the diagnosis of glaucoma RNFL parameters are observed to be more valuable. Sensitivity at 95% specificity of RNFL parameters was higher than other parameters in the diagnosis of EG patients.
The highest AUC values in the EG patients for RNFL parameters were average, inferior, and superior RNFL thicknesses, which is consistent with the typical pattern of RNFL damage in glaucoma patients. Similar results have been reported by Bertuzzi et al.[8] and Rao et al.[13]. OR parameters were found inferior to other parameters in both PPG and EG patients. As mentioned above this finding shows that OR parameters are affected less during glaucoma.[4,25,26]
Logistic regression analysis for OCT parameters revealed average RNFL thickness as a glaucoma risk factor for both PPG and EG. This finding further emphasizes the importance of RNFL parameters when evaluating glaucoma. In a study Arintawati et al.[16] conducted GLV was found to be a risk factor for both PPG and EG; however, in their study, overall GCC parameters had larger AUC values than RNFL parameters in PPG and EG patients.
The influence of disease severity (based on MD), disk area, and SSI as covariates on the diagnostic ability of average RNFL thickness, average GCC thickness, FLV, GLV, and rim area were investigated. SSI value was found to have no effect on the diagnostic ability of the parameters in our study. However, Rao et al.[27] reported that diagnostic ability of average RNFL thickness and rim area got better with better SSI values. The reason for this can be the limit for SSI, which was 30 in their study and 50 in our study. In our study, SSI values were higher which led to narrower range of SSI values and minimalized the effect of different SSI values.
In our study, diagnostic ability of average RNFL and GCC thicknesses increased as severity of the disease increased. FLV, GLV, and rim area were not affected by disease severity. Rao et al.[27] reported the significant influence of disease severity on the diagnostic ability of average RNFL thickness, average GCC thickness, and rim area. The difference can be explained by MD values (disease severity), which was −3.83 in EG patients in our study and −7.31 in their study, suggesting that the increased disease severity affects more parameters.
In a study that Rao et al.[28] reported optic disk size did not influence the diagnostic ability of OCT parameters but increased the sensitivity of rim area at the expense of a decrease in specificity. Sung et al.[11] reported that increased disc area resulted in lower diagnostic ability of average RNFL thickness and rim area. In our study, diagnostic ability of both rim area and average RNFL thickness were increased in large optic discs. Since RNFL thickness decreases with increasing distance from the disc margin,[29] smaller discs have lower RNFL thickness values leading to smaller changes throughout glaucoma which results in lower diagnostic ability of RNFL thickness.
One of the limitations of our study was healthy subjects having lower age, but there are other studies with different age groups with this context. In a study Begum et al.[9] conducted control group and perimetric glaucoma group had a significant age difference.
Conclusion
When evaluating patients with glaucoma, patients at risk for glaucoma and healthy subjects in terms of diagnostic ability RNFL parameters come forward among other OCT parameters. This study is important, especially for those ophthalmologists that use OCT for routine clinical practice but are not glaucoma specialists. Influence of covariates on the diagnostic ability of OCT parameters can be researched with larger patient groups and more sophisticated statistical analysis for more precise results.
Financial support and sponsorship
Nil.
Conflicts of interest
There are no conflicts of interest.
References
- 1.Quigley HA, Dunkelberger GR, Green WR. Retinal ganglion cell atrophy correlated with automated perimetry in human eyes with glaucoma. Am J Ophthalmol. 1989;107:453–64. doi: 10.1016/0002-9394(89)90488-1. [DOI] [PubMed] [Google Scholar]
- 2.Quigley HA, Miller NR, George T. Clinical evaluation of nerve fiber layer atrophy as an indicator of glaucomatous optic nerve damage. Arch Ophthalmol. 1980;98:1564–71. doi: 10.1001/archopht.1980.01020040416003. [DOI] [PubMed] [Google Scholar]
- 3.Quigley HA, Addicks EM, Green WR. Optic nerve damage in human glaucoma. III. Quantitative correlation of nerve fiber loss and visual field defect in glaucoma, ischemic neuropathy, papilledema, and toxic neuropathy. Arch Ophthalmol. 1982;100:135–46. doi: 10.1001/archopht.1982.01030030137016. [DOI] [PubMed] [Google Scholar]
- 4.Tan O, Li G, Lu AT, Varma R, Huang D Advanced Imaging for Glaucoma Study Group. Mapping of macular substructures with optical coherence tomography for glaucoma diagnosis. Ophthalmology. 2008;115:949–56. doi: 10.1016/j.ophtha.2007.08.011. [DOI] [PMC free article] [PubMed] [Google Scholar]
- 5.Tan O, Chopra V, Lu AT, Schuman JS, Ishikawa H, Wollstein G, et al. Detection of macular ganglion cell loss in glaucoma by fourier-domain optical coherence tomography. Ophthalmology. 2009;116:2305–140. doi: 10.1016/j.ophtha.2009.05.025. [DOI] [PMC free article] [PubMed] [Google Scholar]
- 6.Garas A, Vargha P, Holló G. Diagnostic accuracy of nerve fibre layer, macular thickness and optic disc measurements made with the RTVue-100 optical coherence tomograph to detect glaucoma. Eye (Lond) 2011;25:57–65. doi: 10.1038/eye.2010.139. [DOI] [PMC free article] [PubMed] [Google Scholar]
- 7.Schulze A, Lamparter J, Pfeiffer N, Berisha F, Schmidtmann I, Hoffmann EM, et al. Diagnostic ability of retinal ganglion cell complex, retinal nerve fiber layer, and optic nerve head measurements by fourier-domain optical coherence tomography. Graefes Arch Clin Exp Ophthalmol. 2011;249:1039–45. doi: 10.1007/s00417-010-1585-5. [DOI] [PubMed] [Google Scholar]
- 8.Bertuzzi F, Benatti E, Esempio G, Rulli E, Miglior S. Evaluation of retinal nerve fiber layer thickness measurements for glaucoma detection: GDx ECC versus spectral-domain OCT. J Glaucoma. 2014;23:232–9. doi: 10.1097/IJG.0b013e3182741afc. [DOI] [PubMed] [Google Scholar]
- 9.Begum VU, Addepalli UK, Yadav RK, Shankar K, Senthil S, Garudadri CS, et al. Ganglion cell-inner plexiform layer thickness of high definition optical coherence tomography in perimetric and preperimetric glaucoma. Invest Ophthalmol Vis Sci. 2014;55:4768–75. doi: 10.1167/iovs.14-14598. [DOI] [PubMed] [Google Scholar]
- 10.Lisboa R, Paranhos A, Jr, Weinreb RN, Zangwill LM, Leite MT, Medeiros FA, et al. Comparison of different spectral domain OCT scanning protocols for diagnosing preperimetric glaucoma. Invest Ophthalmol Vis Sci. 2013;54:3417–25. doi: 10.1167/iovs.13-11676. [DOI] [PMC free article] [PubMed] [Google Scholar]
- 11.Sung KR, Na JH, Lee Y. Glaucoma diagnostic capabilities of optic nerve head parameters as determined by cirrus HD optical coherence tomography. J Glaucoma. 2012;21:498–504. doi: 10.1097/IJG.0b013e318220dbb7. [DOI] [PubMed] [Google Scholar]
- 12.Rao HL, Kumbar T, Addepalli UK, Bharti N, Senthil S, Choudhari NS, et al. Effect of spectrum bias on the diagnostic accuracy of spectral-domain optical coherence tomography in glaucoma. Invest Ophthalmol Vis Sci. 2012;53:1058–65. doi: 10.1167/iovs.11-8463. [DOI] [PubMed] [Google Scholar]
- 13.Rao HL, Zangwill LM, Weinreb RN, Sample PA, Alencar LM, Medeiros FA, et al. Comparison of different spectral domain optical coherence tomography scanning areas for glaucoma diagnosis. Ophthalmology. 2010;117:1692–9. doi: 10.1016/j.ophtha.2010.01.031. 1699.e1. [DOI] [PubMed] [Google Scholar]
- 14.Nakatani Y, Higashide T, Ohkubo S, Takeda H, Sugiyama K. Evaluation of macular thickness and peripapillary retinal nerve fiber layer thickness for detection of early glaucoma using spectral domain optical coherence tomography. J Glaucoma. 2011;20:252–9. doi: 10.1097/IJG.0b013e3181e079ed. [DOI] [PubMed] [Google Scholar]
- 15.Firat PG, Doganay S, Demirel EE, Colak C. Comparison of ganglion cell and retinal nerve fiber layer thickness in primary open-angle glaucoma and normal tension glaucoma with spectral-domain OCT. Graefes Arch Clin Exp Ophthalmol. 2013;251:831–8. doi: 10.1007/s00417-012-2114-5. [DOI] [PubMed] [Google Scholar]
- 16.Arintawati P, Sone T, Akita T, Tanaka J, Kiuchi Y. The applicability of ganglion cell complex parameters determined from SD-OCT images to detect glaucomatous eyes. J Glaucoma. 2013;22:713–8. doi: 10.1097/IJG.0b013e318259b2e1. [DOI] [PubMed] [Google Scholar]
- 17.Rolle T, Briamonte C, Curto D, Grignolo FM. Ganglion cell complex and retinal nerve fiber layer measured by fourier-domain optical coherence tomography for early detection of structural damage in patients with preperimetric glaucoma. Clin Ophthalmol. 2011;5:961–9. doi: 10.2147/OPTH.S20249. [DOI] [PMC free article] [PubMed] [Google Scholar]
- 18.Rao HL, Babu JG, Addepalli UK, Senthil S, Garudadri CS. Retinal nerve fiber layer and macular inner retina measurements by spectral domain optical coherence tomograph in indian eyes with early glaucoma. Eye (Lond) 2012;26:133–9. doi: 10.1038/eye.2011.277. [DOI] [PMC free article] [PubMed] [Google Scholar]
- 19.Barua N, Sitaraman C, Goel S, Chakraborti C, Mukherjee S, Parashar H, et al. Comparison of diagnostic capability of macular ganglion cell complex and retinal nerve fiber layer among primary open angle glaucoma, ocular hypertension, and normal population using fourier-domain optical coherence tomography and determining their functional correlation in indian population. Indian J Ophthalmol. 2016;64:296–302. doi: 10.4103/0301-4738.182941. [DOI] [PMC free article] [PubMed] [Google Scholar]
- 20.Moreno PA, Konno B, Lima VC, Castro DP, Castro LC, Leite MT, et al. Spectral-domain optical coherence tomography for early glaucoma assessment: Analysis of macular ganglion cell complex versus peripapillary retinal nerve fiber layer. Can J Ophthalmol. 2011;46:543–7. doi: 10.1016/j.jcjo.2011.09.006. [DOI] [PubMed] [Google Scholar]
- 21.Kim YJ, Kang MH, Cho HY, Lim HW, Seong M. Comparative study of macular ganglion cell complex thickness measured by spectral-domain optical coherence tomography in healthy eyes, eyes with preperimetric glaucoma, and eyes with early glaucoma. Jpn J Ophthalmol. 2014;58:244–51. doi: 10.1007/s10384-014-0315-7. [DOI] [PubMed] [Google Scholar]
- 22.Hodapp E, Parrish RK, 2nd, Anderson DR. Clinical Decisions in Glaucoma. St. Louis: The CV Mosby Co; 1993. pp. 52–61. [Google Scholar]
- 23.Zhou XH, Obuchowski NA, McClish DK. New York: John Wiley & Sons, Inc; 2002. Analysis of correlated ROC data. Statistical Methods in Diagnostic Medicine; pp. 274–306. [Google Scholar]
- 24.Medeiros FA, Sample PA, Zangwill LM, Liebmann JM, Girkin CA, Weinreb RN, et al. A statistical approach to the evaluation of covariate effects on the receiver operating characteristic curves of diagnostic tests in glaucoma. Invest Ophthalmol Vis Sci. 2006;47:2520–7. doi: 10.1167/iovs.05-1441. [DOI] [PubMed] [Google Scholar]
- 25.Vajaranant TS, Anderson RJ, Zelkha R, Zhang C, Wilensky JT, Edward DP, et al. The relationship between macular cell layer thickness and visual function in different stages of glaucoma. Eye (Lond) 2011;25:612–8. doi: 10.1038/eye.2011.17. [DOI] [PMC free article] [PubMed] [Google Scholar]
- 26.Kita Y, Kita R, Takeyama A, Anraku A, Tomita G, Goldberg I, et al. Relationship between macular ganglion cell complex thickness and macular outer retinal thickness: A spectral-domain optical coherence tomography study. Clin Exp Ophthalmol. 2013;41:674–82. doi: 10.1111/ceo.12089. [DOI] [PubMed] [Google Scholar]
- 27.Rao HL, Addepalli UK, Yadav RK, Senthil S, Choudhari NS, Garudadri CS, et al. Effect of scan quality on diagnostic accuracy of spectral-domain optical coherence tomography in glaucoma. Am J Ophthalmol. 2014;157:719–270. doi: 10.1016/j.ajo.2013.12.012. [DOI] [PubMed] [Google Scholar]
- 28.Rao HL, Leite MT, Weinreb RN, Zangwill LM, Alencar LM, Sample PA, et al. Effect of disease severity and optic disc size on diagnostic accuracy of RTVue spectral domain optical coherence tomograph in glaucoma. Invest Ophthalmol Vis Sci. 2011;52:1290–6. doi: 10.1167/iovs.10-5546. [DOI] [PMC free article] [PubMed] [Google Scholar]
- 29.Varma R, Skaf M, Barron E. Retinal nerve fiber layer thickness in normal human eyes. Ophthalmology. 1996;103:2114–9. doi: 10.1016/s0161-6420(96)30381-3. Erratum in: Ophthalmology 1997;104:174. [DOI] [PubMed] [Google Scholar]


