Abstract
Background
Asthma is a common yet incompletely understood health problem associated with a high morbidity burden. A wide variety of seasonally variable environmental stimuli such as viruses and air pollution are believed to influence asthma morbidity. This study set out to examine the seasonal patterns of asthma hospitalisations in relation to age and gender for the province of Ontario over a period of 12 years.
Methods
A retrospective, population-based study design was used to assess temporal patterns in hospitalisations for asthma from April 1, 1988 to March 31, 2000. Approximately 14 million residents of Ontario eligible for universal healthcare coverage during this time were included for analysis. Time series analyses were conducted on monthly aggregations of hospitalisations.
Results
There is strong evidence of an autumn peak and summer trough seasonal pattern occurring every year over the 12-year period (Fisher-Kappa (FK) = 23.93, p > 0.01; Bartlett Kolmogorov Smirnov (BKS) = 0.459, p < 0.01). This pattern was observed in both sexes. However, young males (0–4 years) were hospitalised at two to three times the rate of females of the same age. Rates were much lower in the older age groups. A downward trend in asthma hospitalisations was observed in the total population over the twelve-year period (beta = -0.980, p < 0.01).
Conclusions
A clear and consistent seasonal pattern was observed in this study for asthma hospitalisations. These findings have important implications for the development of effective management and prevention strategies.
Background
Asthma is a common condition associated with a high morbidity burden. The epidemiology of asthma may contribute to understanding the various factors related to its causation as well as determining the potential impact of environmental stimuli on asthma morbidity. Many factors have been shown to influence asthma ranging from viruses, dust mites, ambient dust and meteorological events such as thunderstorms [1,2]. Given the wide variety of potential influences, it could be expected that there is variability in the patterns of morbidity that depend on the ecological parameters of the area studied.
Seasonality is known to be closely associated with a range of health outcomes such as influenza [3], myocardial infarction [4] and cerebrovascular accidents [5]. Seasonal occurrence on a consistent basis may be a clue to disease aetiology, which in turn may provide a basis for the development of treatment and prevention programs.
Several studies have demonstrated seasonal patterns in hospitalisations and mortality associated with asthma. A Canadian study [6] examined the seasonal patterns of asthma hospitalisations for a 15–34 year age group where it was found that hospitalisations peaked in the autumn. However, the study did not present data for children, the group typically reported as having the highest hospitalisation rates [7-9]. More recently, a British study examined the seasonal patterns of general practitioner visits, hospital admissions and deaths from asthma [10]. Here a striking variability in these patterns was found according to age for hospital admissions, with the highest rates occurring in September among children and young adults, and the mid-winter months for older adults. Admission rates by gender were not reported. Marked differences between males and females have been reported in the literature, with admissions for young males being higher than for young females [11,12].
This study aims to improve our understanding of asthma seasonality by examining hospitalisations by gender and all age groups. Population-based data for the province of Ontario, over a period of 12 years, were used to answer the following questions:
1. What are the seasonal patterns for hospitalisation for asthma for the general population?
2. Do these patterns vary by age and sex?
3. What are the overall trends in hospitalisation during this 12-year span?
Materials and methods
We conducted a retrospective, population-based study to assess temporal patterns in hospitalisations for asthma from April 1, 1988 to March 31, 2000. Approximately 14 million residents of Ontario eligible for universal healthcare coverage during this time were included for analysis. The Canadian Institute for Health Information Discharge Abstract Database was used to obtain information on hospitalisation for asthma as the most responsible diagnosis. This database records discharges from all Ontario acute care hospitals, documenting a scrambled patient identifier, date of admission and discharge, up to 16 diagnoses as coded by the International Classification of Diseases, Ninth Revision, Clinical Modification (ICD-9-CM), and up to 10 procedures.
Researchers using these databases have found that diagnoses and surgical procedures are coded with a high degree of accuracy. There is very little missing information in the Ontario databases; other studies have similarly found that less than 1% of the basic information on patients is missing in various provincial databases. All discharges with diagnoses of asthma (ICD-9-CM code 493) were captured during the study period. The total number of discharges was assessed for each month. Annual census data for each age group for residents of Ontario were provided by Statistics Canada. Monthly population estimates were derived through linear interpolation.
Spectral analysis was conducted to assess cyclical patterns in event occurrence [13]. The data series was detrended using ordinary least squares regression prior to conducting spectral analysis where appropriate. Two tests for the null hypothesis that the series is strictly white noise were conducted. The Fisher-Kappa (FK) Test is designed to detect one major sinusoidal component buried in white noise, whereas the Bartlett Kolmogorov Smirnov (BKS) Test accumulates departures from the white noise hypothesis over all frequencies. Time series analysis using autoregressive models were used to examine trends over time.
Results
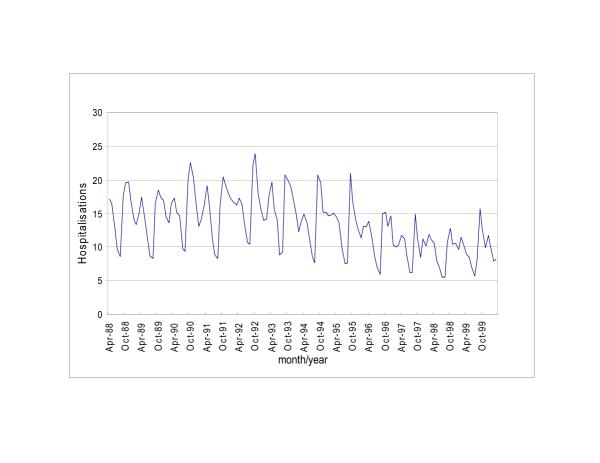
Table 1 shows monthly asthma hospital discharge descriptive statistics for the 12 year study period. Peaks in hospitalisations were observed in September and October and smaller peaks were observed between December and January, and again in April. The major trough occurs between July and August. This pattern is illustrated in Figure 1 which shows the standardised monthly rates of asthma hospitalisations per 100,000 population by year. The series shows a clear autumn peak and summer trough seasonal pattern occurring every year over the 12 year period (Fisher-Kappa (FK) = 23.93, p > 0.01; Bartlett Kolmogorov Smirnov (BKS) = 0.459, p < 0.01).
Table 1.
Asthma hospitalisations for fiscal years 1988 to 1999 for all months and by month
| Mean (SD) | Median (IQR) | Range | |
|---|---|---|---|
| January1 | 1384 (222) | 1391(1158) | 1110–1806 |
| February | 1380(214) | 1371 (1323) | 928–1750 |
| March | 1472 (277) | 1528(1187) | 969–1874 |
| April | 1621(314) | 1654 (1376) | 1034–2097 |
| May | 1427 (269) | 1482 (1267) | 922–1723 |
| June | 1158(251) | 1194 (951) | 781–1513 |
| July | 866(151) | 912 (718) | 639–1135 |
| August | 851(138) | 847 (727) | 637–1100 |
| September | 1899(345) | 1800 (1680) | 1221–2338 |
| October | 1907(381) | 1921 (1523) | 1272–2536 |
| November | 1649 (388) | 1722(1261) | 961–2119 |
| December | 1600 (227) | 1676 (1386) | 1215–1890 |
| All months2 | 1434 (423) | 1455(1122) | 637–2536 |
1 for each month n = 12 2 total n = 144 months
Figure 1.
Asthma hospitalisations per 100 000 population
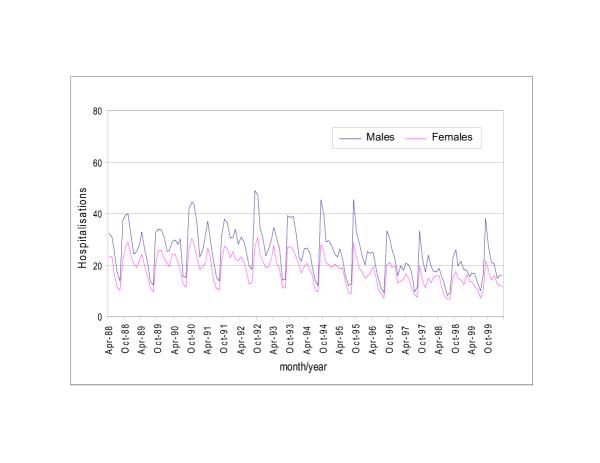
Figure 2 shows hospital discharges by gender per 100,000 population. Here it was observed that a clear seasonality exists for both males (FK = 26.8, p < 0.01; BKS = 0.431, p < 0.01) and females (FK = 28.6, p < 0.01; BKS = 0.487, p < 0.01), again with major peaks occurring in the autumn and major troughs occurring in the summer. Minor peaks were also observed in the spring. Overall, rates of admissions for males are consistently higher, with male peaks sometimes exceeding female peaks by almost two times [11].
Figure 2.
Gender specific asthma hospitalisations per 100 000 population
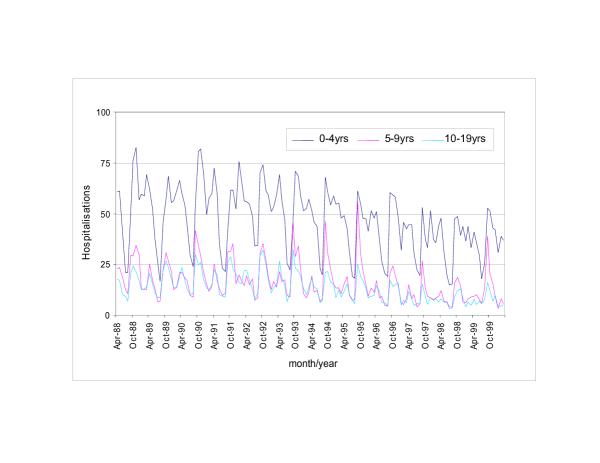
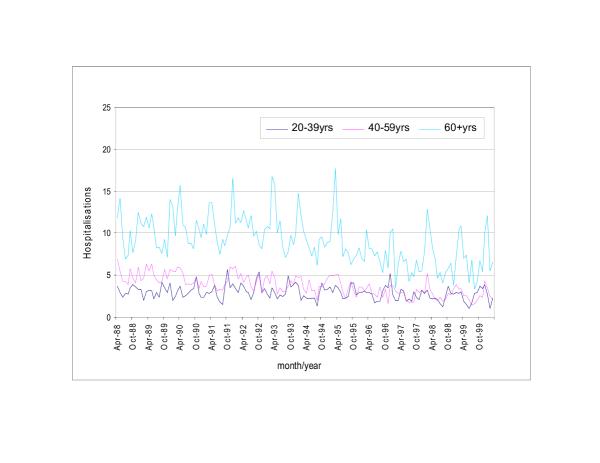
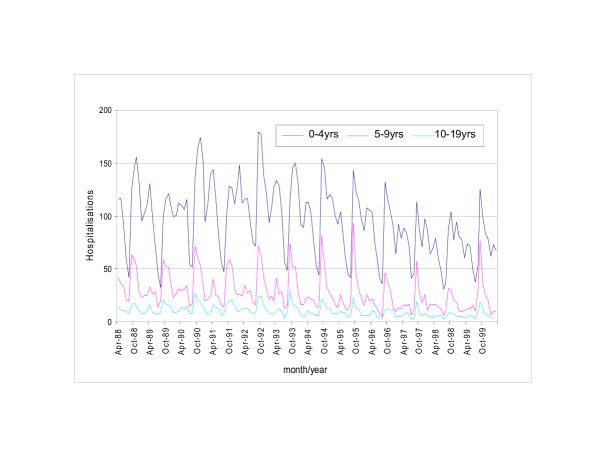
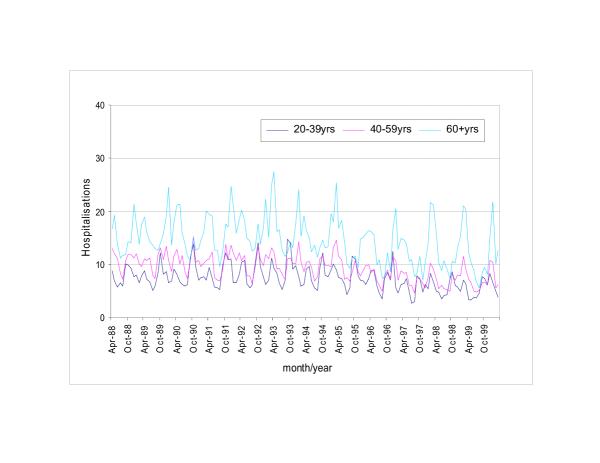
When discharges were analysed by age group (Figures 3 to 6), rates were found to be highest in the youngest groups (i.e. 0–4 years and 5–9 years) for both males and females. Boys in the 0–4 and 5–9 year age groups (Figure 5) were hospitalised at rates as high as 180 per 100,000 population in September and October, frequently at two to three times the rate of girls of the same age (Figure 3). For all other age groups the findings are reversed and female hospitalisations exceed those of males. Discharge rates for adult males and females were substantially lower than among children. More hospitalisations were seen in the 60+ age category (Figure 6) compared to other adult age groups.
Figure 3.
Age specific asthma hospitalisations per 100 000 population: females 0–19 years
Figure 6.
Age specific asthma hospitalisations per 100 000 population: males 20–60+ years
Figure 5.
Age specific asthma hospitalisations per 100 000 population: males 0–19 years
For females (Figures 3 and 4), strong seasonal patterns were observed in the youngest age groups (i.e. 0–4 years: FK = 25.6, p < 0.01; BKS = 0.499, p < 0.01) with the major peaks occurring between September and November and the major troughs in July and August. Minor troughs were also observed in December and January. In the oldest age groups (60+ years) significant seasonal variation was observed (FK = 35.6, p < 0.01; BKS = 0.445, p < 0.01) with the major peaks occurring between January and May. For females in all age groups, the major troughs occurred in the summer months.
Figure 4.
Age specific asthma hospitalisations per 100 000 population: females 20–60+ years
For males (Figures 5 and 6), strong seasonal patterns were observed in the youngest age groups (i.e. 0–4 years: FK = 24.1, p < 0.01; BKS = 0.464. p < 0.01). In the older age groups the patterns are slightly less discernible though in this case the peaks seem to occur in the winter months (FK = 23.93, p < 0.01; BKS = 0.346, p < 0.01). For males in all age groups, the major troughs occurred in July and August.
A downward trend in asthma hospitalisations was observed in the total population (Figure 1) representing approximately a 13% decrease over the twelve year period (beta = -0.980, p < 0.01). The biggest decrease was observed among young males (0–4 years: beta = -0.307, p < 0.01). Little change was observed among the older age groups for either males or females.
Discussion
This research has uncovered several important findings regarding the temporal patterns of asthma hospitalisations in Ontario. First, there is a consistent seasonal pattern of fall peaks and summer troughs for total hospitalisations. Second, when the data were analysed by gender, males and females showed the same seasonal hospitalisation patterns, however, males were hospitalised more frequently. Third, when analysed by age it is clear that the seasonal patterns are driven largely by the youngest age group (i.e. 0–4 years), specifically young males. Fourthly, it was observed that males were hospitalised at higher rates than females in the younger age groups, but the reverse pattern was observed among older age groups. Finally, a downward trend in total hospitalisations has occurred since the early 1990's, a trend most notable among young males.
The downward trend in total hospitalisations found in this study has similarly been reported by Flemming and associates [10] in a study carried out recently in Great Britain. In Ontario, the improvement of asthma treatment programs over the past decade [14], or alternatively decreased bed availability, are possible explanations for the downward trend in hospitalisations.
The seasonal pattern for total asthma-related hospitalisations found in this study is consistent with those from studies done in countries as environmentally, economically, culturally and socially different as Trinidad [15], Norway [12], Hong Kong [9], the United States [8] and England [2]. In Finland, for example, it was found that a small peak in hospitalisations occurs in May, a trough in July and a large peak between September and November [11]. A comparable summer trough/autumn peak pattern has also been reported in New Zealand, a Southern Hemisphere nation [16].
The seasonal variability in total hospitalisations in this study is largely driven by high rates among children under 10 years of age, specifically males. This finding has been reported elsewhere and possibly explained by the greater prevalence of asthma and atopy in the male population [11]. The predominance of male hospitalisations over female hospitalisations is limited to the two youngest age groups. In the population 10 years and older, females were hospitalised at approximately twice the rate of males. This reversal in rates by gender was similarly reported in New Zealand [16] and Trinidad [15]. Underlying causes for the high rates of hospitalisations among females deserves further research. Suggested theories include hormonal [17,18], psychosocial and environmental factors [16].
A wide range of environmental trigger factors have been outlined in the literature as explanations for asthma seasonality. These factors range from air pollution and aeroallergens to temperature and humidity. Studies have demonstrated that environmental factors such as these may play a role in precipitating acute asthma, however, they are unable to explain the consistent seasonal patterns reported in the wide range of environments around the world. Aeroallergens, for example, vary geographically by type, concentration and time of peak concentration, yet the seasonality of hospitalisations is geographically consistent [2,8,9,11,19]. Cold weather or related factors such as the increased use of heating systems in the fall in Ontario cannot explain the autumn peaks in hospitalisations in the tropical climate of Trinidad [15]. If cold weather was a major factor, winter would be expected to represent the peak hospitalisation season. Finally, air pollution concentrations vary significantly from place to place, and, in the case of Ontario, concentrations typically peak during the summer months [20] when asthma hospitalisations are at their lowest.
Another possible explanation for the September peaks and summer troughs in asthma hospitalisations relates to bronchial viral infections. Viral airway infections, particularly rhinovirus, are reported to be the most common cause of acute asthma exacerbations [12,21,22]. In summer, viral infections are rare. It has been postulated that school holidays disrupt the spread of viral infections in a community. However, holiday travel facilitates the acquisition of new viral strains by the community. With the reopening of school, viruses spread from student to student are brought home to younger siblings and in turn increase incidences of acute asthma exacerbations [23]. The annual summer troughs, it has been argued, are also the result of parents paying greater attention to their children's preventative asthma medication during holidays, as well as children being under less stress than when at school [11]. These are not likely to be important factors for pre-school age children (i.e. 0–4 years) who, in this study, had the highest rates of hospitalisation and similar seasonal patterns.
Several authors suggest that the seasonal asthma patterns for a given age group or gender are not the result of any one factor, but rather several synergistic or additive factors. For example, Osborne [19] in a Portland, Oregon study, suggests that fall peaks in young children are the result of aeroallergen exposures combined with increased rates of infections associated with the start of school. Harju et al. [1] adds increased time spent indoors associated with the start of school, and cooler weather to the list of synergistic factors. The low summer rates have been linked to reduced stress, fewer viruses and in the case of children, parents being more attentive regarding medication use [11], and decreased help-seeking behaviour [24].
Conclusion
This study contributes to our understanding of seasonal variations of asthma hospitalisations occurring in Ontario since 1988. A clear and consistent seasonal hospitalisation pattern was found in the total population. The highest hospitalisation rates were found among the youngest age groups, particularly males, with peaks occurring between September and November and troughs in July and August. Rates were much lower in the older age groups. The synergistic effect of factors including increased bronchial virus exposures associated with the reopening of school in September and fall aeroallergen exposures, is a possible explanation for the regular fall peaks in hospitalisations, although further research is required to demonstrate this. Given that the summer asthma trough corresponds to high air pollution months, it is unlikely that pollution has a significant impact on asthma hospitalisations. The role of air pollution and other potential trigger factors cannot, however, be dismissed. Studies done in the United States and Europe have demonstrated that asthma related mortality peaks when morbidity is at its lowest [8,24] suggesting that asthma related morbidity and mortality may be triggered by different factors.
Competing Interests
none declared
Pre-publication history
The pre-publication history for this paper can be accessed here:
Contributor Information
Eric J Crighton, Email: eric.crighton@swchsc.on.ca.
Muhammad M Mamdani, Email: muhammad.mamdani@ices.on.ca.
Ross EG Upshur, Email: rupshur@idirect.com.
Acknowledgements
Many thanks to Shari Gruman for all of her assistance and expertise in the preparation of this article.
References
- Harju T, Tuuponen T, Keistinen T, Kivela SL. Seasonal variations in hospital treatment periods and deaths among adult asthmatics. Eur Respir J. 1998;12:1362–1365. doi: 10.1183/09031936.98.12061362. [DOI] [PubMed] [Google Scholar]
- Khot A, Bum R, Evans N, Lenney C, Lenney W. Seasonal variation and time trends in childhood asthma in England and Wales 1975–81. Br Med J (Clin Res Ed) 1984;289:235–237. doi: 10.1136/bmj.289.6439.235. [DOI] [PMC free article] [PubMed] [Google Scholar]
- Upshur RE, Knight K, Goel V. Time-series analysis of the relation between influenza virus and hospital admissions of the elderly in Ontario, Canada, for pneumonia, chronic lung disease, and congestive heart failure. Am J Epidemiol. 1999;149:85–92. doi: 10.1093/oxfordjournals.aje.a009731. [DOI] [PubMed] [Google Scholar]
- Eng H, Mercer JB. Seasonal variations in mortality caused by cardiovascular diseases in Norway and Ireland. J Cardiovasc Risk. 1998;5:89–95. [PubMed] [Google Scholar]
- Lanska DJ, Hoffmann RG. Seasonal variation in stroke mortality rates. Neurology. 1999;52:984–990. doi: 10.1212/wnl.52.5.984. [DOI] [PubMed] [Google Scholar]
- Mao Y, Semenciw R, Morrison H, Wigle DT. Seasonality in epidemics of asthma mortality and hospital admission rates, Ontario, 1979–86. Can J Public Health. 1990;81:226–228. [PubMed] [Google Scholar]
- Fleming DM, Cross KW, Sunderland R, Ross AM. Comparison of the seasonal patterns of asthma identified in general practitioner episodes, hospital admissions, and deaths. Thorax. 2000;55:662–665. doi: 10.1136/thorax.55.8.662. [DOI] [PMC free article] [PubMed] [Google Scholar]
- Weiss KB. Seasonal trends in US asthma hospitalizations and mortality. Jama. 1990;263:2323–2328. doi: 10.1001/jama.263.17.2323. [DOI] [PubMed] [Google Scholar]
- Tseng RY, Lo CN, Li CK, Ling TW, Mok MM. Seasonal asthma in Hong Kong and its management implications. Ann Allergy. 1989;63:247–250. [PubMed] [Google Scholar]
- Fleming DM, Sunderland R, Cross KW, Ross AM. Declining incidence of episodes of asthma: a study of trends in new episodes presenting to general practitioners in the period 1989–98. Thorax. 2000;55:657–661. doi: 10.1136/thorax.55.8.657. [DOI] [PMC free article] [PubMed] [Google Scholar]
- Harju T, Keistinen T, Tuuponen T, Kivela SL. Seasonal variation in childhood asthma hospitalisations in Finland, 1972–1992. Eur J Pediatr. 1997;156:436–439. doi: 10.1007/s004310050632. [DOI] [PubMed] [Google Scholar]
- Carlsen KH, Orstavik I, Leegaard J, Hoeg H. Respiratory virus infections and aeroallergens in acute bronchial asthma. Arch Dis Child. 1984;59:310–315. doi: 10.1136/adc.59.4.310. [DOI] [PMC free article] [PubMed] [Google Scholar]
- Fuller W. Introduction to Statistical Time Series. New York: John Wiley and Sons, Inc.; 1976.
- Boulet LP, Bai TR, Becker A, Berube D, Beveridge R, Bowie DM, Chapman KR, Cote J, Cockcroft D, Ducharme FM, Ernst P, FitzGerald JM, Kovesi T, Hodder RV, O'Byrne P, Rowe B, Sears MR, Simons FE, Spier S. What is new since the last (1999) Canadian Asthma Consensus Guidelines? Can Respir. 2001;8 Suppl A:5A–27A. doi: 10.1155/2001/278435. [DOI] [PubMed] [Google Scholar]
- Monteil MA, Juman S, Hassanally R, Williams KP, Pierre L, Rahaman M, Singh H, Trinidade A. Descriptive epidemiology of asthma in Trinidad, West Indies. J Asthma. 2000;37:677–684. doi: 10.3109/02770900009087306. [DOI] [PubMed] [Google Scholar]
- Kimbell-Dunn M, Pearce N, Beasley R. Seasonal variation in asthma hospitalizations and death rates in New Zealand. Respirology. 2000;5:241–246. doi: 10.1046/j.1440-1843.2000.00255.x. [DOI] [PubMed] [Google Scholar]
- Troisi RJ, Speizer FE, Willett WC, Trichopoulos D, Rosner B. Menopause, postmenopausal estrogen preparations, and the risk of adult- onset asthma. A prospective cohort study. Am J Respir Crit Care Med. 1995;152:1183–1188. doi: 10.1164/ajrccm.152.4.7551368. [DOI] [PubMed] [Google Scholar]
- Lieberman D, Kopernik G, Porath A, Lazer S, Heimer D. Sub-clinical worsening of bronchial asthma during estrogen replacement therapy in asthmatic post-menopausal women. Maturitas. 1995;21:153–157. doi: 10.1016/0378-5122(94)00890-J. [DOI] [PubMed] [Google Scholar]
- Osborne ML, Vollmer WM, Buist AS. Periodicity of asthma, emphysema, and chronic bronchitis in a northwest health maintenance organization. Chest. 1996;110:1458–1462. doi: 10.1378/chest.110.6.1458. [DOI] [PubMed] [Google Scholar]
- Burnett RT, Dales RE, Raizenne ME, Krewski D, Summers PW, Roberts GR, Raad-Young M, Dann T, Brook J. Effects of low ambient levels of ozone and sulfates on the frequency of respiratory admissions to Ontario hospitals. Environ Res. 1994;65:172–194. doi: 10.1006/enrs.1994.1030. [DOI] [PubMed] [Google Scholar]
- Mygind N. The common cold as a trigger of asthma. Monaldi Arch Chest Dis. 2000;55:478–483. [PubMed] [Google Scholar]
- Johnston SL, Pattemore PK, Sanderson G, Smith S, Campbell MJ, Josephs LK, Cunningham A, Robinson BS, Myint SH, Ward ME, Tyrrell DA, Holgate ST. The relationship between upper respiratory infections and hospital admissions for asthma: a time-trend analysis. Am J Respir Crit Care Med. 1996;154:654–660. doi: 10.1164/ajrccm.154.3.8810601. [DOI] [PubMed] [Google Scholar]
- Storr J, Lenney W. School holidays and admissions with asthma. Arch Dis Child. 1989;64:103–107. doi: 10.1136/adc.64.1.103. [DOI] [PMC free article] [PubMed] [Google Scholar]
- Khot A, Bum R. Seasonal variation and time trends of deaths from asthma in England and Wales 1960–82. Br Med J (Clin Res Ed) 1984;289:233–234. doi: 10.1136/bmj.289.6439.233. [DOI] [PMC free article] [PubMed] [Google Scholar]


