Abstract
The promise of DNA vaccines is far-reaching. However, the development of potent immunization methods remains a key challenge for its use in clinical applications. Here, an approach for in vivo DNA vaccination by electrically activated plasmonic Au nanoparticles is reported. The electrical excitation of plasmonic nanoparticles can drive vibrational and dipole-like oscillations that are able to disrupt nearby cell membranes. In combination with their intrinsic ability to focus and magnify the electric field on the surface of cells, Au nanoparticles allow enhanced cell poration and facilitate the uptake of DNA vaccine. Mice immunized with this approach showed up to 100-fold higher gene expression compared to control treatments (without nanoparticles) and exhibited significantly increased levels of both antibody and cellular immune responses against a model hepatitis C virus DNA vaccine. This approach can be tuned to establish controlled and targeted delivery of different types of therapeutic molecules into cells and live animals as well.
1. Introduction
DNA vaccination is a major revolutionary breakthrough in medicine.[1] None of the available standard immunization methods are entirely satisfactory for DNA vaccination due to lack of in vivo efficiency, poor reliability, and limited safety.[1,2] Nanostructures with multiple unique physicochemical properties provide a broad range of exciting opportunities in vaccine design and preparation. Recently, various classes of nanoparticles have been investigated, including silica nanoparticles, metal nanoparticles, carbon nanotubes, dendrimers, polymers, cyclodextrins, hydrogels, and semiconductor nanocrystals.[3,4] Nobel metal nanoparticles are particularly interesting due to its easy synthesis and modification, biocompatibility, and in vivo stability.[5,6] Up to date, they have been applied to the development of new vaccines against a wide range of pathogens and diseases, including foot-and-mouth disease virus, hepatitis B virus, human immunodeficiency virus-1, influenza A virus, West Nile virus, Streptococcus pneumoniae, Yersinia pestis, tetanus, malaria, and different cancers.[7–18] For such applications, metal nanoparticles proved to be a powerful tool for enhanced vaccine delivery and/or adjuvants to stimulate certain immune pathways, which might then enhance vaccine processing and improve immunogenicity.[7–18]
Plasmonic metal nanoparticles are highly conductive and have been described to possess very responsive and interactive behavior toward the electric field. This behavior can vary from dipole-like oscillations to complete migration of particles under certain electric conditions.[19–21] Thus, we anticipate that metal nanoparticles in a dielectric environment and under controlled electrical activation can be excited to physically facilitate the membrane poration of adjacent cells. In addition, metal nanoparticles are highly conductive and can act as “electrical antenna” to focus and magnify the electric field on the surface of cells, which additionally would maximize the chance of cell membrane permeability and the subsequent uptake of biomolecules.
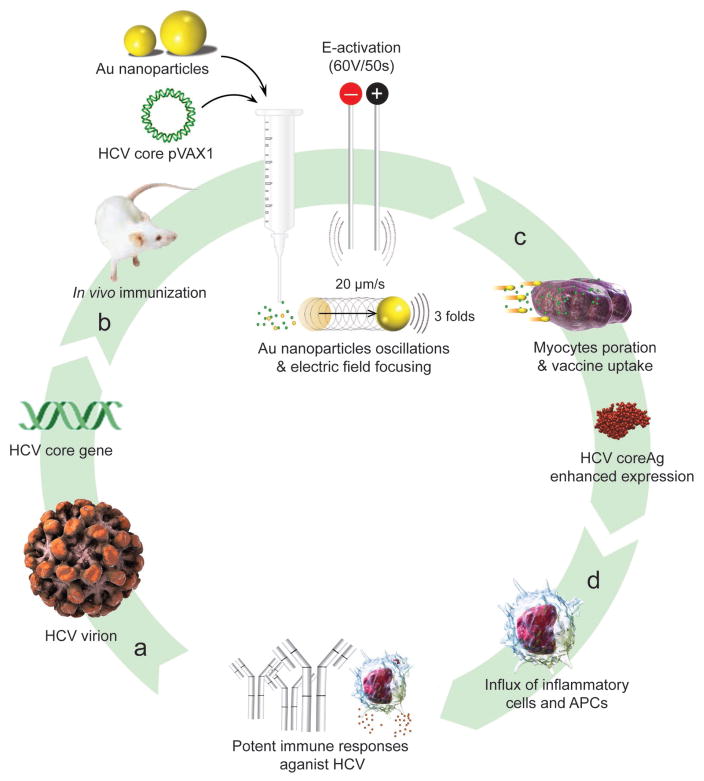
Here, we introduce a DNA vaccination protocol based on using Au nanoparticles stimulated with short DC electric pulses to mediate a highly effective in vivo vaccination; we call “oscillating plasmonic nanoparticle-based vaccination” (abbreviation: OPN Vac). In this approach, a DNA plasmid was specifically designed with the whole sequence of hepatitis C virus (HCV) core gene, one of the most conservative genes in HCV and widely known as a promising candidate for therapeutic HCV vaccine.[22,23] Then, nonconjugated Au nanoparticles were coadministrated with DNA plasmids in tibialis anterior (TA) muscle of mice followed by an immediate short electric pulsing (50 ms in duration at 60 V) to activate Au nanoparticles and initiate their oscillation. The oscillation of nanoparticles together with their ability to focus and magnify the electric field increase the uptake of the DNA by myocytes, which directly enhance the expression level of the encoded core antigen and the generated immune responses against HCV (Figure 1).
Figure 1.
Schematic of OPN Vac approach. a) HCV DNA vaccine design and propagation: HCV core gene is propagated using a plasmid DNA (pDNA) vector of pVAX1. b) HCV core pVAX1 DNA vaccine and Au nanoparticles coadministration: DNA vaccine is mixed with Au nanoparticles and injected into muscle tissue, and then activated by a gentle electrical (E) stimulus comprising of 6 short pulses, each 50 ms at 60 V. Au nanoparticles begin to vibrate and oscillate (up to 20 μm s−1), and simultaneously focus the electric field on their surface to nearly threefold higher compared to the average bulk electric field. c) Au nanoparticles-mediated DNA vaccine in vivo delivery: the activated Au nanoparticles increase the cell membrane poration and directly facilitate DNA uptake by myocytes, which subsequently result in an increased antigen expression (up to 100-fold higher). d) Au nanoparticles induce the influx of supporting inflammation cues of monocytes, macrophages, and dendritic cells. The enhanced expression of target antigen concurrently in the presence of such large immune infiltrate helps to generate potent cellular and humoral immunity against the target pathogen.
2. Results and Discussion
We initially synthesized Au nanoparticles of 5 nm (with variable surface charges −30, −10, and +0.1 mV), 50 nm (−45.8 mV), and 100 nm (−36.5 mV) in size. The synthesis and surface modification of Au nanoparticles were performed following the standard protocols (see Section S1, Supporting Information). The physicochemical and morphological characteristics of modified and unmodified Au nanoparticles were confirmed by several analytical techniques, including UV–vis spectroscopy, Fourier-transform infrared (FT-IR) spectroscopy, transmission electron microscopy (TEM), dynamic light scattering (DLS), and zeta potential techniques. The synthesized Au nanoparticles were spherical in shape with average diameters of 5.5 ± 1.4 nm, 47.8 ± 6.1 nm, and 104.2 ± 2.9 nm and with an acceptable size uniformity inferred from the results obtained by TEM and DLS techniques (Table 1; Figures S1–S6, Supporting Information). The surface modification of 5 nm Au nanoparticles with amino-thiol cysteamine (CA) decreasing negative surface charge of Au nanoparticles from −30.5 ± 6.322 mV of unmodified Au nanoparticles to −10.3 ± 3.141 and 0.1 ± 3.901 mV when reacted with 0.5 and 1 M CA, respectively (Figure S6, Supporting Information).
Table 1.
Chemical, physical, and morphological properties of Au nanoparticles used in this study. CA = cystamine hydrochloride.
| Diametera) [nm] | Ligand shell compositionb) | DLS [nm] | ζ Potential [mV] | Particle morphology/Surface chemical structures |
|---|---|---|---|---|
| 5.5 ± 1.4 | Citrate | 9.1 ± 3.2 | −30.5 ± 6.322 |

|
| 47.8 ± 6.1 | Citrate | 60.2 ± 8.3 | −45.8 ± 1.969 |

|
| 104.2 ± 2.9 | Citrate | 101.5 ± 3.6 | −36.5 ± 2.635 |

|
| 5.5 ± 1.4 | Citrate + 0.5 m CA | 10.8 ± 1.378 | −10.3 ± 3.141 |

|
| 5.5 ± 1.4 | Citrate + 1 m CA | 12.6 ± 2.048 | 0.1 ± 3.901 |
|
Estimated from TEM;
Estimated from the applied molar ratio in the surface modification reaction.
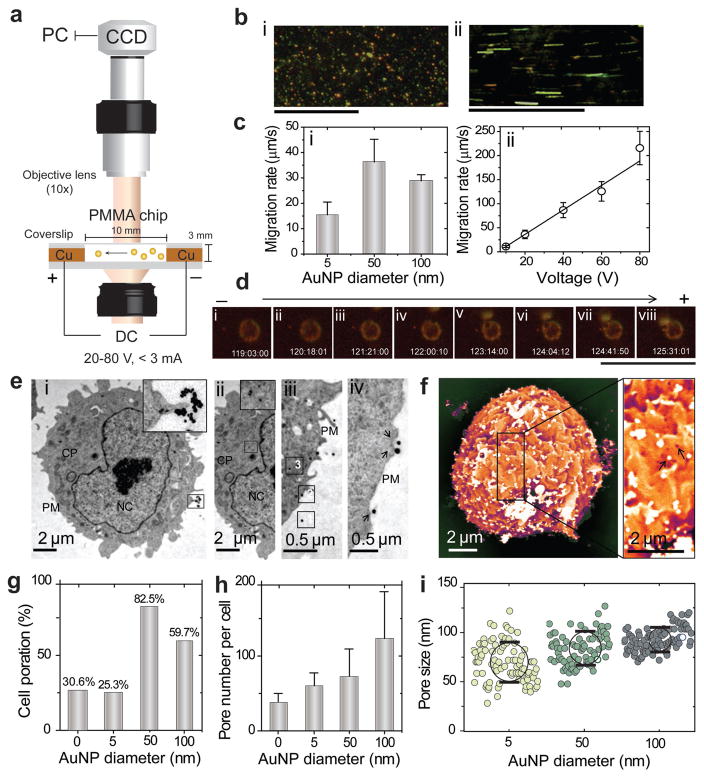
The oscillatory motion of the prepared Au nanoparticles under an electric field and their interaction with live cells were monitored by a dark-field microscopy (DFM) system using a specifically designed electrophoretic chip (Figure 2a).[21] In this experiment, small aliquots of Au nanoparticle suspension prepared in 1x Tris acetate-EDTA (TAE) buffer were subjected to different voltages (20, 40, 60, and 80 V) at 25 °C. The suspended Au nanoparticles showed a highly dynamic electrophoretic behavior, which includes both small and large oscillations, and fast particle migration toward the positive electrode. The nanoparticles started to immediately move and rapidly oscillate after electric field application in a size-dependent manner and with rates that directly proportional to the strength of the applied electric voltage (Figure 2b,ci,ii). However, these oscillations were neither regular nor uniform and included both large and small displacement steps. Typical time-averaged trajectories during an oscillation period are presented in Figure S7 (Supporting Information). On average, the smaller Au nanoparticles exhibited larger and faster oscillations, and the highest oscillation amplitude was observed to be 20.5 μm s−1 for 5 nm Au nanoparticles. In addition, the physical interaction of electrically activated Au nanoparticles, and their internalization into viable Chinese hamster ovary (CHO-K1) cells was also visualized using the DFM system. A remarkable interaction of Au nanoparticles with living cells was observed. Figure 2d shows a single 100 nm Au nanoparticle electrically bombarded into a single CHO-K1 cell. Au nanoparticle was moving at an average speed of 3 μm s−1 toward a freely moving CHO-K1 cell and was completely internalized into the cell within 8 s. It is worth noting that, this unique behavior of nanoparticles can significantly vary based on the type of cell and its electrical properties. However, the oscillation velocity of nanoparticles can be controlled through optimizing the morphology of nanoparticles and the strength of the applied electric field to suit different cell types, allowing efficient interactions and particle internalization into the cells.
Figure 2.
Au nanoparticles oscillation and cell poration analysis. a) Schematic of DC electrophoretic mobility assay of Au nanoparticles (AuNPs) using DFM system supported with a specifically designed poly(methyl methacrylate) (PMMA) chip. b) Representative DFM images of Au nanoparticles: (i) 50 nm AuNPs; (ii) 50 nm AuNPs under an electric field of 60 V in 1x TAE. Scale bars are 100 μm. c) Oscillation rates of AuNPs: (i) AuNPs of different sizes (5, 50, 100 nm) under 20 V; (ii) 50 nm AuNPs under the effect of different voltages (20, 40, 60, 80 V). d) DFM imaging of the interaction of a single 100 nm AuNP with CHO-K1 cell under 20 V. The scale bar is 100 μm. e) TEM analysis of cell poration and particle entry into CHO-K1 cells: (i) 50 nm AuNPs on the surface of cell; (ii) 50 nm AuNPs in the cytoplasm of cells; (iii) steps (1–3) of AuNPs entry into the cells; (iv) the relation between the incidence of cell membrane poration and the presence of 100 nm AuNPs on the cell surface. Arrows are indicating clear ruptures in cell membrane frequently exist with the presence of AuNPs on the cell surface. CP, cytoplasm; PM, plasma membrane; NC, nucleus. f) SEM image of CHO-K1 cell poration with 100 nm AuNPs. The position of pores is related to the presence of AuNPs on the surface of cells, as indicated by arrows. g) Cell poration (%) as calculated from the number of porated cells to nonporated cells. h) Pore number per cells. i) The size distribution and uniformity of pores. All error bars represent standard deviations.
Further studies using transmission and scanning electron microscopy (SEM) were conducted to evaluate the effect of the electrically activated Au nanoparticles on the cell poration. Au nanoparticles were able to significantly enhance the cell poration when compared to control treatments without Au nanoparticles (Figure 2e–i; Figures S9 and S10, Supporting Information). This effect was typically dependent on the size of Au nanoparticles and 50 and 100 nm Au nanoparticles were the most efficient, resulting in 59%–82% cell poration efficiency. 5 nm Au nanoparticles recorded a significantly lower cell poration efficiency of 25.3% compared to control. Moreover, the number of cell membrane pores; their uniformity, and size distribution were directly correlated to the size of Au nanoparticles (Figure 2h,i). The presence of large 100 nm Au nanoparticles increased the size of cell membrane pores to more than 100 nm (Figure 2i). Interestingly, we observed that both the incidence and the position of pores were frequently correlated to the presence of Au nanoparticles on the surface of cells (Figure 2e,f; Figure S10, Supporting Information). In addition, TEM analysis confirmed an immediate internalization of Au nanoparticles into cells, which implies an efficient cell poration adequate for the uptake of nanoparticles and other nearby molecules (Figure 2e; Figure S11, Supporting Information). Further, this was verified with a pilot in vivo experiment using the standard luciferase assay in which luciferase plasmid (pLuc) was delivered into TA muscle of ICR-mice by the OPN Vac approach. The results showed a 20- to 100-fold increase in the level of pLuc expression over control treatments (without Au nanoparticles) (Figure S12, Supporting Information).
To evaluate the ability of Au nanoparticles to focus and amplify the electric field in muscle tissue, the distributions of electric field in the vicinity of Au nanoparticles were simulated using COMSOL Multiplysics (Mathworks, Natick, MA). We calculated the electric field intensities at computational domain defined to be a cubic shape with a dimension of 300 nm and the applied electric stimulus from the top and bottom surfaces. The results confirmed localized enhancement of the electric field around the surface of Au nanoparticles by a factor of 3 (Figure S8, Supporting Information). This focusing effect extended up to several nanometers from the surface of particles. The increase in size of nanoparticle results in increasing the focusing effect of the particle. The 5 nm nanoparticles were observed to focus the electric field to a distance less than 1 nm while larger particles of 50 and 100 nm showed a focusing effect of electric field extended to 10 nm that typically exceed the diameter of the adjacent cell membrane.[24,25]
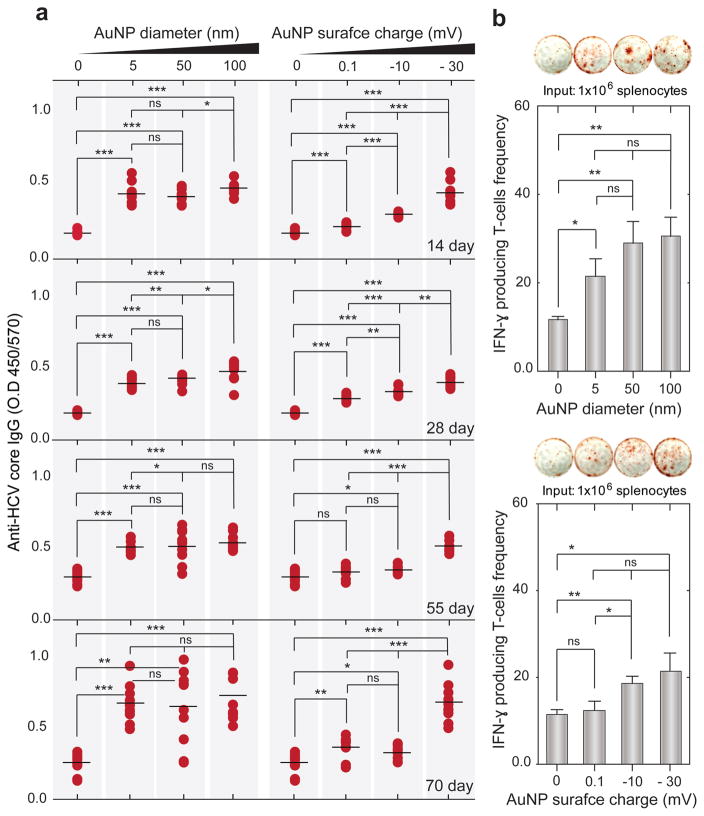
We investigated the efficacy of our OPN Vac approach to induce potent immune responses against the tested HCV DNA vaccine (Table S2 and Figure S13, Supporting Information). The subsequent antibody and cellular immune responses were independently evaluated by enzyme-linked immunosorbent assay (ELISA) and enzyme-linked immunospot (ELISPOT) techniques, respectively (Section S1 and Table S2, Supporting Information). Table S2 (Supporting Information) includes a summary of the different in vivo OPN Vac treatments. Generally, the presence of Au nanoparticles was accompanied by significantly elevated levels of both anti-HCV IgG and interferon-gamma (IFNγ) secreting T-cells over controls (without Au nanoparticles). However, the generated response usually increased with increasing the particle size and negative surface charge of particles. The large 100 nm Au nanoparticles that have a negative surface charge of −36.5 ± 2.6 mV induced the highest levels of both anti-HCV IgG and T-cells (Figure 3a,b). The antibody responses surprisingly appeared early at 2 weeks after immunization and maximally boosted to a level sevenfold higher than control by the end of immunization protocol (Figures S14 and S15, Supporting Information), while the highest count of T-cells was 32 cells per well, surpassing control by 18.6% (Figure 3b).
Figure 3.
Efficacy of OPN Vac approach to generate specific immune responses against HCV DNA vaccine. a) Total anti-HCV core IgG measured by ELISA. b) The frequency of IFN-γ producing T-cells assessed by ELISPOT. Mice were immunized with 100 μg HCV core pDNA coadministrated with Au nanoparticles (AuNPs) of different sizes (5, 50, and 100 nm) or with 5 nm AuNPs carrying different surface charges (−30, −10, and +0.1 mV) into TA muscles of ICR mice. Blood samples were collected at 2 week intervals for 3 months after the first dose. All mice in each group (n = 5) were euthanized at the end of the immunization course, and splenocytes were isolated from their spleens and stimulated in vitro with rCore protein to measure the number of cytokine secreting cells at the concentrations of 106 cells per well. The results are expressed as the average values of two independent experiments. All error bars represent standard deviations. *P < 0.05, **P < 0.01, ***P < 0.001; ns, nonsignificant versus the corresponding control mice group (no Au nanoparticles), calculated using the Mann–Whitney test.
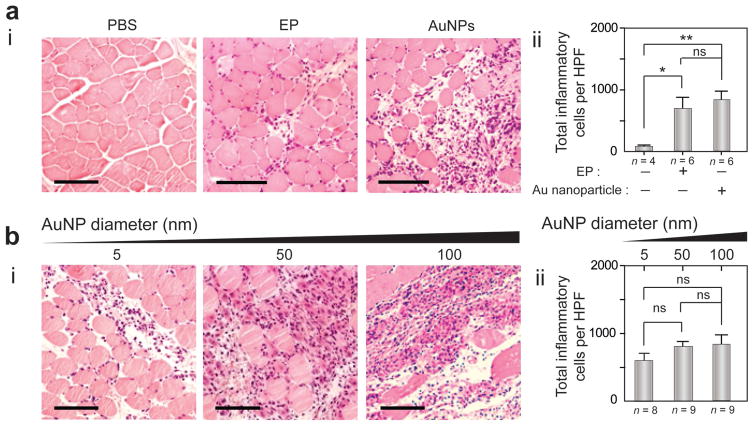
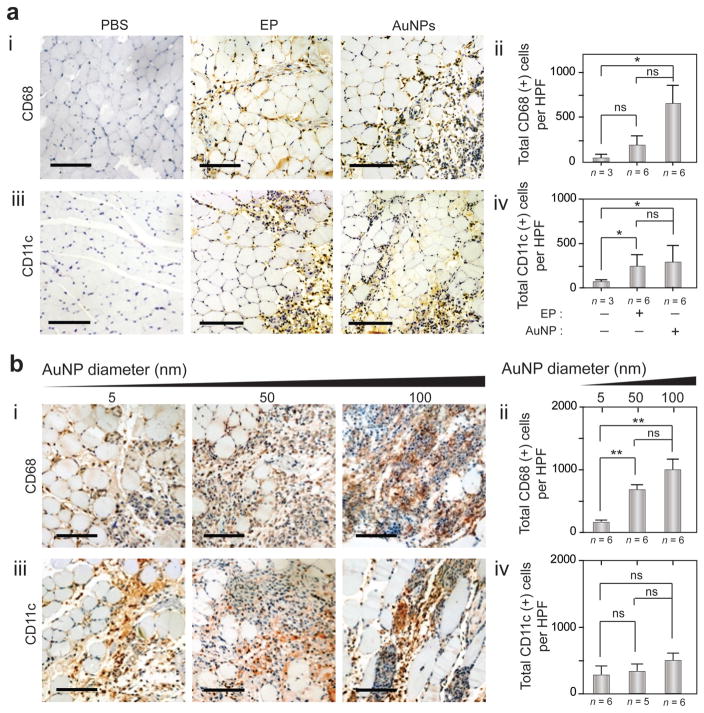
The histological changes in TA muscles due to OPN Vac treatments were investigated using hematoxylin and eosin (H&E) staining and immunohistochemistry (IHC) techniques (see the Experimental Section). H&E technique showed a noticeably prolonged inflammation (≥3 d) with large populations of inflammatory cells (e.g., macrophages, dendritic cells, lymphocytes, platelets).[26,27] Au nanoparticles without any electric pulsing elicited significant inflammation and large infiltrates of antigen presenting cells (APCs) compared to control (without treatments). This inflammation was even higher than the inflammation observed in muscle tissues treated with electric stimulus without nanoparticles (Figures 4 and 5; Figure S16, Supporting Information). This effect of Au nanoparticles was directly correlated to their size, and larger nanoparticles of 50 and 100 nm in diameter had higher inflammatory activity compared to smaller Au nanoparticles of 5 nm in diameter. In addition, IHC analysis using CD68 and CD11c monoclonal antibodies revealed the induction of heavy infiltrates of macrophages and dendritic cells with different treatments at 3 d after immunization, with positive cell counts in the range of 100–1000 cell per high-power field (HPF) (Figure 5a,b).
Figure 4.
Hematoxylin and eosin (H&E) staining of TA muscle tissue after OPN Vac treatments in mice. a) H&E analysis of muscle tissue in mice 3 days after receiving treatment with electric pulsing (EP) or Au nanoparticles (AuNPs) alone, compared to phosphate buffered saline (PBS) control: (i) representative sections of treated tissue; (ii) quantification of total inflammatory cells per HPF. b) H&E analysis of muscle tissues in mice 3 days after OPN Vac treatments using AuNPs of different sizes (5, 50, and 100 nm): (i) representative sections of treated tissue; (ii) quantification of total inflammatory cells per HPF. The scale bar is 100 μm. The results are expressed as the average values of two independent experiments. All error bars represent standard deviations. *P < 0.05, **P < 0.01, ***P < 0.001; ns, nonsignificant versus the corresponding control mice (no Au nanoparticles), calculated using the Mann–Whitney test.
Figure 5.
Immunohistochemistry (IHC) analysis of TA muscle tissue after OPN Vac treatments in mice. a) IHC analysis of muscle tissue in mice 3 days after receiving treatment with electric pulsing (EP) or Au nanoparticles (AuNPs) alone, compared to phosphate buffered saline (PBS) control: (i) representative sections of treated tissue stained with mAb to CD86; (ii) quantification of total CD68+ cells per HPF; (iii) representative sections of treated tissue stained with mAb to CD11c; (iv) quantification of total CD11c+ cells per HPF. b) IHC analysis of muscle tissues in mice 3 days after OPN Vac treatments using AuNPs of different sizes (5, 50, and 100 nm): (i) representative sections of treated tissue stained with mAb to CD86; (ii) the number of CD68+ cells per HPF; (iii) representative sections of treated tissue stained with mAb to CD11c; (iv) the number of CD11c+ cells per HPF. The scale bar is 100 μm. The results are expressed as the average values of two independent experiments. All error bars represent standard deviations. *P < 0.05, **P < 0.01, ***P < 0.001; ns, nonsignificant versus the corresponding control mice (no Au nanoparticles), calculated using the Mann–Whitney test.
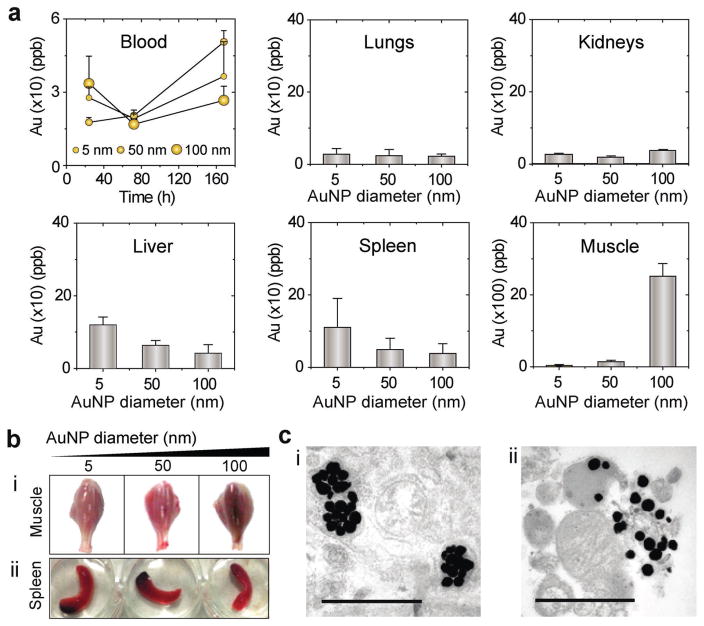
We also evaluated the biodistribution and organ uptake of Au nanoparticles under the applied electrical stimulation to confirm their in vivo stability and lack of toxicity. Generally, no sign of toxicity or injury appeared on the tested mice during the entire 3 month study period. This is, in part, due to the effective and rapid removal of particles indicated by the inductively coupled plasma mass spectrometry (ICP-MS) profiling, which confirmed the active participation of several body organs, including liver and spleen to Au nanoparticles uptake and removal (Figure 6a).[28] It is worth noting that, the flow of Au nanoparticles from injection sites at TA muscles into other body parts and subsequent removal were typically relying on their size. The small 5 nm Au nanoparticles rapidly flowed to blood 24 h postimmunization to be systemically taken and removed by body organs, while larger 50 and 100 nm nanoparticles were retained in tissues for longer periods (up to 3 days postimmunization), and phagocytosis of particles was observed by TEM (Figure 6b,c; Figure S17, Supporting Information).
Figure 6.
Biodistribution analysis and organ uptake of Au nanoparticles after OPN Vac treatments in mice. a) Blood circulation and quantitative organ uptake of Au nanoparticles (AuNPs) 3 days post OPN treatment. The results are expressed as the average values of two independent experiments. All error bars represent standard deviations. b) Whole mounts of the lower part of the hind legs of mice 3 days after OPN Vac treatment (i), and spleen 1 day after OPN Vac treatment (ii). The images show normal organ morphology and the accumulation of AuNPs remained visible at the tested times. c) Signs of tissue interaction with AuNPs and its removal through phagocytosis observed by TEM in muscle tissues 3 days after OPN treatment. The scale bar is 1 μm.
In our OPN Vac approach, we attribute this high potency of the tested model DNA vaccine of HCV to the enhanced cell poration and increased internalization of DNA vaccine. The electrophoretic oscillatory motion of the nanoparticles combined with their intrinsic ability to enhance electric field increased the cell poration and influenced the formation of more uniform pores that were ten times larger compared to pores commonly created by electric pulsing only.[29] To the extent that large 100 nm Au nanoparticles have been shown to enter cells both in vitro and in vivo; therefore, it is easy to imagine a 3.5 kb plasmid DNA vaccine (≈70 nm in size)[30] to flow independently into the cell without being stretched or compressed. This, in turn, resulted in an increased level of antigen expression, which boosted the rate of antibody and T cell production. In addition, the inflammatory activity of Au nanoparticles observed in our results induced the influx of large number of APCs to the immunization sites that are known to play an important role in priming the in vivo immune responses.[31,32] In terms of size, negatively charged Au nanoparticles with large size showed a significantly increased ability to improve cell poration. They are also better immunostimulant compared to smaller Au nanoparticles, which to an extent explain the significance of some particle parameters, such as particle size and surface charge in our approach. Furthermore, the increase in particle size reduces the rate of their self-clearance (≥3 d), causing a prolonged inflammation and higher numbers of APCs are ready to be primed by high levels of expressed antigens from the transfected myocytes. Despite this long retention time for the intramuscularly injected Au nanoparticles, there was no sign of toxicity on the tested mice during the whole protocol that extends for almost 3 months, which is in consistence with many recent reports about the in vivo safety and biocompatibility of Au nanoparticles.[33,34]
Here, we demonstrated an efficient and highly potent DNA vaccination against HCV with electrically activated plasmonic Au nanoparticles in vivo. Such strategy of using free plasmid DNA (pDNA) mixed with nanoparticles (not tethered) provides an important advantage over all other conjugation-based delivery methods of maintaining the original structure and conformation of pDNA. The conjugation of DNA plasmid either by electrostatic or covalent bonding usually alters the plasmid properties and its tight interaction to the surface of the delivery carrier limits its release after cell internalization. In addition, the developed large-sized plasmid-carrier complexes after conjugation are susceptible to endosomal degradation that can adversely affect the expression level of the target gene.[35,36] On contrary, pDNAs in our approach can freely flow into the cells by electromigration, allowing the highest possible expression level of encoded genes, which is a well-known bottleneck for DNA vaccination.[37,38] Although, several strategies have been successfully developed based on using high DNA concentrations or advanced delivery systems,[2,39] our method remains superior in terms of being simple and efficient. It completely eliminates the need for any modification step for the plasmid DNA or nanoparticles. One additional attractive advantage is that Au nanoparticles can permit an effective transfection at a considerably low electric field, helping to avoid harsh lysis and cell destruction due to Joule heating and irreversible electroporation, a major drawback of conventional or bulk electroporation.[40,41] Thus, the vaccinated tissues can recover faster, allowing rapid and more efficient DNA expression that can additionally improve the in vivo vaccination efficiency. Furthermore, the preparation and modification of Au nanoparticles is well developed and the properties of nanoparticles can be tuned together with the electric field properties to suit different types of cells and tissues for wide use and controlled applications.
3. Conclusions
We developed a highly efficient approach for DNA vaccination against HCV based on electrically stimulated Au nanoparticles in vivo. The refinement of this approach can permit controlled nonvehicle-based vaccine delivery through engineering the surface of metal nanoparticles with specific targeting moieties. Practically, loading the particles with a certain amount of biomolecules can be achieved and by adjusting the parameters of the electric field, the number of internalized particles can further be controlled, allowing smart and precise delivery into cells. The depth of electric field penetration into tissues is easy to be controlled using several commercially available devices. Hence, the field application of this method in human can be either invasive or noninvasive using the suitable pulsing devices, which would additionally encourage the easy and widespread use of our developed approach. Moving forward, this platform can be adapted to mediate efficient in vivo delivery of other types of small therapeutic agents, such as peptides, proteins, DNA, miRNAs, and siRNA.
4. Experimental Section
Au Nanoparticles
Several Au nanoparticles with different sizes and surface chemistries were prepared following previously published protocols.[42–44] The synthesis and surface modification of Au nanoparticles were confirmed by different physical and chemical characterization methods, including TEM, FTIR, DLS, UV–vis, and zeta potential techniques. For detailed synthesis and characterization see Section S1 in the Supporting Information.
DNA Vaccine Constructs
DNA vaccine plasmid specific to HCV core gene was constructed using the basic molecular biology protocols (Figure S13, Supporting Information). The prepared plasmids were propagated in Escherichia coli and purified using endotoxin-free plasmid isolation kit. The isolated plasmids were characterized using UV–vis spectroscopy and gel electrophoresis techniques (Section S1, Supporting Information).
Cell Culture
CHO-K1 cell line was utilized to evaluate the effect of OPN treatment on cell poration and particle internalization. Cells were routinely cultured in 25 T-flasks containing 5 mL of Dulbecco’s modified Eagle’s medium supplemented with 10% (v/v) fetal bovine serum, and 100 IU mL−1 penicillin/streptomycin. Cells were incubated at 37 °C in a humidified atmosphere, containing 5% CO2, and subcultured every 2 d to maintain the exponential growth phase.
OPN Vaccination Protocol
Optimized OPN protocol for DNA vaccination was conducted by applying six square-wave electric pulses, 50 ms in duration, and 1 s apart at a voltage of 60 V in the presence of 0.1 × 10⁻⁹ M Au nanoparticles mixed with DNA plasmid. This protocol was conducted in vitro using Bio-Rad Gene Pulser Xcell (Bio-Rad Laboratories, Hercules, CA, USA) to deliver DNA plasmid into cells (1 × 10⁶ cell mL−1 in phosphate buffer pH 7.2), and in vivo in ICR mice using TRESA-EPT machine (Section S1, Supporting Information). The subsequent responses of both cells and tissues were evaluated using several analytical techniques, including TEM, SEM, DFM, ICP-MS, and several immunological and histochemical analyses.
Electrophoretic Motion Analysis and Electric Field Simulation
The motion of electrically activated Au nanoparticles was studied using poly(methyl methacrylate) electrophoretic chip based system (Section S1, Supporting Information).[21] The corresponding motions of Au nanoparticles were monitored using a dark-field microscope (microscope objective: 10×, IX71; Olympus, Tokyo, Japan) equipped with a CCD camera (Pro-microscan, OPLENIC). COMSOL Multiplysics (Mathworks, Natick, MA) was used to simulate the enhancement and focusing effect of the electric field around AuNP in the protocol. Details are given in the Supporting Information.
Histological and Histochemical analyses
Mice were euthanized at 0 and 3 d time intervals after DNA injection and OPN treatment. Hind limb tissues were collected and TA muscles were further removed, transected axially through the middle portion of muscle belly, and either paraffin-embedded for histological analysis or frozen to perform immunohistochemistry (Section S1, Supporting Information).[45] Slides were evaluated for the detection of tissue changes, inflammation, and the presence of specific antigen presenting cells.
Immunological Analyses
The immune responses, including both specific antibody- and cellular-mediated responses induced by different OPN treatments against HCV were evaluated using ELISA and ELISPOT techniques, respectively. For detailed protocols see Section S1 in the Supporting Information.
Pharmacokinetics and Organ Uptake
The distribution and accumulation of Au nanoparticles in different body organs were evaluated using ICP-MS assay. Both blood and other tissue samples were completely lysed in aqua regia, centrifuged, and total gold concentration was detected by ICP-MS (SCIEX ELAN 5000, Perkin Elmer) using the standard protocol (Supporting Information).
Statistical Analysis
Statistical analyses were performed by using GraphPad Prism software version 5.01 (GraphPad Software, Inc. La Jolla, CA, USA). Data were analyzed by using the Mann–Whitney U test, and differences between groups were considered significant when P values were not more than 0.05, and levels of significance were assigned as *P ≤ 0.05, **P ≤ 0.01, and ***P ≤ 0.001.
Supplementary Material
Acknowledgments
The authors wish to acknowledge supports received from the National Institute of Allergy and Infectious Disease (NIAID), National Institute of Health (NIH) through 1R01AI118502, Brigham and Women’s Hospital (BWH), Harvard Medical School (HMS) through the Bright Futures Prize and Fund to Sustain Research Excellence, Department of Medicine, Harvard Medical School through the Innovation Evergreen Fund, and Department of Science and Technology of China through “863” Grant No. 2014AA020700 (to Y. Xu). The authors wish to thank Dr. Jinliang Peng, Wang Wei, Yuta Dobashi, and Anish Vasan for helping in the preliminary experiments, discussions, and electric field simulation.
Footnotes
Supporting Information is available from the Wiley Online Library or from the author.
Contributor Information
Dr. Mohamed Shehata Draz, Division of Engineering in Medicine, Department of Medicine, Brigham and Women’s Hospital, Harvard Medical School, Boston, MA 02115, USA. Faculty of Science Tanta University Tanta 31527, Egypt. State Key Laboratory for Diagnosis and Treatment of Infectious Diseases, Collaborative Innovation Center for Diagnosis and Treatment of Infectious Diseases, The First Affiliated Hospital, School of Medicine, Zhejiang University, Hangzhou, Zhejiang 310003, P. R. China
Prof. Ying-Jie Wang, State Key Laboratory for Diagnosis and Treatment of Infectious Diseases, Collaborative Innovation Center for Diagnosis and Treatment of Infectious Diseases, The First Affiliated Hospital, School of Medicine, Zhejiang University, Hangzhou, Zhejiang 310003, P. R. China
Prof. Frank Fanqing Chen, Life Sciences Division, Lawrence Berkeley National Laboratory, Mailstop 977, 1 Cyclotron Road, Berkeley, CA 94720, USA
Prof. Yuhong Xu, School of Pharmacy, Shanghai Jiao Tong University, Shanghai 200240, P. R. China
Prof. Hadi Shafiee, Division of Engineering in Medicine, Department of Medicine, Brigham and Women’s Hospital, Harvard Medical School, Boston, MA 02115, USA. Department of Medicine, Harvard Medical School, Boston, MA 02115, USA
References
- 1.Kutzler MA, Weiner DB. Nat Rev Genet. 2008;9:776. doi: 10.1038/nrg2432. [DOI] [PMC free article] [PubMed] [Google Scholar]
- 2.Luo D, Saltzman WM. Nat Biotechnol. 2000;18:33. doi: 10.1038/71889. [DOI] [PubMed] [Google Scholar]
- 3.Zhao L, Seth A, Wibowo N, Zhao CX, Mitter N, Yu C, Middelberg AP. Vaccine. 2014;32:327. doi: 10.1016/j.vaccine.2013.11.069. [DOI] [PubMed] [Google Scholar]
- 4.Mura S, Nicolas J, Couvreur P. Nat Mater. 2013;12:991. doi: 10.1038/nmat3776. [DOI] [PubMed] [Google Scholar]
- 5.Shukla R, Bansal V, Chaudhary M, Basu A, Bhonde RR, Sastry M. Langmuir. 2005;21:10644. doi: 10.1021/la0513712. [DOI] [PubMed] [Google Scholar]
- 6.Dykman L, Khlebtsov N. Chem Soc Rev. 2012;41:2256. doi: 10.1039/c1cs15166e. [DOI] [PubMed] [Google Scholar]
- 7.Chen YS, Hung YC, Lin WH, Huang GS. Nanotechnology. 2010;21:195101. doi: 10.1088/0957-4484/21/19/195101. [DOI] [PubMed] [Google Scholar]
- 8.Zhou XF, Zhang XH, Yu XH, Zha X, Fu Q, Liu B, Wan X, Chen Y, Chen Y, Shan YM, Jin YH, Wu YG, Liu JQ, Kong W, Shen JC. Biomaterials. 2008;29:111. doi: 10.1016/j.biomaterials.2007.09.007. [DOI] [PubMed] [Google Scholar]
- 9.Xu LG, Liu Y, Chen ZY, Li W, Liu Y, Wang LM, Liu Y, Wu XC, Ji YL, Zhao YL, Ma LY, Shao YM, Chen CY. Nano Lett. 2012;12:2003. doi: 10.1021/nl300027p. [DOI] [PubMed] [Google Scholar]
- 10.Niikura K, Matsunaga T, Suzuki T, Kobayashi S, Yamaguchi H, Orba Y, Kawaguchi A, Hasegawa H, Kajino K, Ninomiya T, Ijiro K, Sawa H. ACS Nano. 2013;7:3926. doi: 10.1021/nn3057005. [DOI] [PubMed] [Google Scholar]
- 11.Safari D, Marradi M, Chiodo F, Dekker HAT, Shan YL, Adamo R, Oscarson S, Rijkers GT, Lahmann M, Kamerling JP, Penades S, Snippe H. Nanomedicine. 2012;7:651. doi: 10.2217/nnm.11.151. [DOI] [PubMed] [Google Scholar]
- 12.Gregory AE, Williamson ED, Prior JL, Butcher WA, Thompson IJ, Shaw AM, Titball RW. Vaccine. 2012;30:6777. doi: 10.1016/j.vaccine.2012.09.021. [DOI] [PMC free article] [PubMed] [Google Scholar]
- 13.Ahn S, Lee IH, Kang S, Kim D, Choi M, Saw PE, Shin EC, Jon S. Adv Healthc Mater. 2014;3:1194. doi: 10.1002/adhm.201300597. [DOI] [PubMed] [Google Scholar]
- 14.Lee IH, Kwon HK, An S, Kim D, Kim S, Yu MK, Lee JH, Lee TS, Im SH, Jon S. Angew Chem. 2012;51:8800. doi: 10.1002/anie.201203193. [DOI] [PubMed] [Google Scholar]
- 15.Lin AY, Almeida JPM, Bear A, Liu N, Luo L, Foster AE, Drezek RA. PLoS One. 2013;8:e63550. doi: 10.1371/journal.pone.0063550. [DOI] [PMC free article] [PubMed] [Google Scholar]
- 16.Tao W, Ziemer KS, Gill HS. Nanomedicine. 2014;9:237. doi: 10.2217/nnm.13.58. [DOI] [PMC free article] [PubMed] [Google Scholar]
- 17.Parween S, Gupta PK, Chauhan VS. Vaccine. 2011;29:2451. doi: 10.1016/j.vaccine.2011.01.014. [DOI] [PubMed] [Google Scholar]
- 18.Barhate GA, Gaikwad SM, Jadhav SS, Pokharkar VB. Int J Pharm. 2014;471:439. doi: 10.1016/j.ijpharm.2014.06.002. [DOI] [PubMed] [Google Scholar]
- 19.Schatz G. J Mol Struct: THEOCHEM. 2001;573:73. [Google Scholar]
- 20.Trau M, Saville DA, Aksay IA. Science. 1996;272:706. doi: 10.1126/science.272.5262.706. [DOI] [PubMed] [Google Scholar]
- 21.Kloepper KD, Onuta TD, Amarie D, Dragnea B. J Phys Chem B. 2004;108:2547. [Google Scholar]
- 22.Bukh J, Purcell RH, Miller RH. Proc Natl Acad Sci USA. 1994;91:8239. doi: 10.1073/pnas.91.17.8239. [DOI] [PMC free article] [PubMed] [Google Scholar]
- 23.Law LMJ, Landi A, Magee WC, Tyrrell DL, Houghton M. Emerging Microbes Infect. 2013;2:e79. doi: 10.1038/emi.2013.79. [DOI] [PMC free article] [PubMed] [Google Scholar]
- 24.Hu Q, Viswanadham S, Joshi R, Schoenbach KH, Beebe SJ, Blackmore P. Phys Rev E. 2005;71:031914. doi: 10.1103/PhysRevE.71.031914. [DOI] [PubMed] [Google Scholar]
- 25.Gerber HL, Bassi A, Tseng CC. IEEE Trans Plasma Sci. 2006;34:1425. [Google Scholar]
- 26.Chen H, Dorrigan A, Saad S, Hare DJ, Cortie MB, Valenzuela SM. PLoS One. 2013;8:e58208. doi: 10.1371/journal.pone.0058208. [DOI] [PMC free article] [PubMed] [Google Scholar]
- 27.El-Drieny EAEA, Sarhan NI, Bayomy NA, Elsherbeni SAE, Momtaz R, Mohamed HED. J Microsc Ultrastruct. 2015;3:181. doi: 10.1016/j.jmau.2015.05.001. [DOI] [PMC free article] [PubMed] [Google Scholar]
- 28.Moghimi SM, Hunter AC, Andresen TL. Annu Rev Pharmacol. 2012;52:481. doi: 10.1146/annurev-pharmtox-010611-134623. [DOI] [PubMed] [Google Scholar]
- 29.Sukharev S, Klenchin V, Serov S, Chernomordik L, YuA C. Biophys J. 1992;63:1320. doi: 10.1016/S0006-3495(92)81709-5. [DOI] [PMC free article] [PubMed] [Google Scholar]
- 30.Henderson E. Nucleic Acids Res. 1992;20:445. doi: 10.1093/nar/20.3.445. [DOI] [PMC free article] [PubMed] [Google Scholar]
- 31.Boyle JS, Brady JL, Lew AM. Nature. 1998;392:408. doi: 10.1038/32932. [DOI] [PubMed] [Google Scholar]
- 32.Qin H, Cha SC, Neelapu SS, Lou Y, Wei J, Liu YJ, Kwak LW. Blood. 2009;114:4142. doi: 10.1182/blood-2009-05-219683. [DOI] [PubMed] [Google Scholar]
- 33.Connor EE, Mwamuka J, Gole A, Murphy CJ, Wyatt MD. Small. 2005;1:325. doi: 10.1002/smll.200400093. [DOI] [PubMed] [Google Scholar]
- 34.De Jong WH, Hagens WI, Krystek P, Burger MC, Sips AJ, Geertsma RE. Biomaterials. 2008;29:1912. doi: 10.1016/j.biomaterials.2007.12.037. [DOI] [PubMed] [Google Scholar]
- 35.Zhang Y, Satterlee A, Huang L. Mol Ther. 2012;20:1298. doi: 10.1038/mt.2012.79. [DOI] [PMC free article] [PubMed] [Google Scholar]
- 36.Güven GU, Laçin NT, Pis’kin E. J Tissue Eng Regener Med. 2008;2:155. doi: 10.1002/term.78. [DOI] [PubMed] [Google Scholar]
- 37.Remaut K, Sanders NN, Fayazpour F, Demeester J, De Smedt SC. J Controlled Release. 2006;115:335. doi: 10.1016/j.jconrel.2006.08.009. [DOI] [PubMed] [Google Scholar]
- 38.Xie TD, Tsong TY. Biophys J. 1993;65:1684. doi: 10.1016/S0006-3495(93)81208-6. [DOI] [PMC free article] [PubMed] [Google Scholar]
- 39.Gurunathan S, Klinman DM, Seder RA. Annu Rev Immunol. 2000;18:927. doi: 10.1146/annurev.immunol.18.1.927. [DOI] [PubMed] [Google Scholar]
- 40.Guido I, Xiong CY, Fang J. Microelectron Eng. 2012;98:707. [Google Scholar]
- 41.Aihara H, Miyazaki JI. Nat Biotechnol. 1998;16:867. doi: 10.1038/nbt0998-867. [DOI] [PubMed] [Google Scholar]
- 42.Brown KR, Walter DG, Natan MJ. Chem Mater. 2000;12:306. [Google Scholar]
- 43.Perrault SD, Chan WCW. J Am Chem Soc. 2009;131:17042. doi: 10.1021/ja907069u. [DOI] [PubMed] [Google Scholar]
- 44.Aslan K, Perez-Luna VH. Langmuir. 2002;18:6059. [Google Scholar]
- 45.Naota M, Shimada A, Morita T, Yamamoto Y, Inoue K, Takano H. Toxicol Pathol. 2013;41:487. doi: 10.1177/0192623312457271. [DOI] [PubMed] [Google Scholar]
Associated Data
This section collects any data citations, data availability statements, or supplementary materials included in this article.


