

Abstract
The poor delivery efficiency remains a major challenge in nanomaterial based tumor targeted imaging and drug delivery. This work demonstrated a strategy to improve nanoparticle delivery and intratumoral distribution using a sub-5 nm (3.5 nm core size) ultrafine iron oxide nanoparticles (uIONPs) that can easily extravasate from the tumor vasculature and readily diffuse into the tumor tissue compared to iron oxide nanoparticles (IONP) with larger sizes, followed by self-assembling in the acidic tumor interstitial space to limit their re-entering the circulation. By combining enhanced extravasation and reduced intravasation, improved delivery and tumor retention of nanoparticles are achieved. Multi-photon imaging of mice bearing orthotopic tumors co-injected with fluorescent dye labeled nanoparticles with different sizes showed that uIONPs exhibited more efficient extravasation out of tumor vessels and penetrated deeper into the tumor than larger sized IONP counterparts. Moreover, in vivo magnetic resonance imaging (MRI) revealed that uIONPs exhibited “bright” T1 contrast when dispersed in the tumor vasculature and peripheral area at 1 hour after intravenous administration, followed by emerging “dark” T2 contrast in the tumor after 24 hours. Observed T1–T2 contrast switch indicated that uIONPs single-dispersed in blood with T1 contrast may self-assemble into larger clusters with T2 contrast after entering the tumor interstitial space. Improved passive targeting and intratumoral delivery along with increased tumor retention of uIONP are due to both easy extravasation into the tumor when single-dispersed and restricting intravasation back into circulation after forming clusters, thus, exerting the enhanced permeability and retention (EPR) effect for nanoparticle delivery to tumors.
Keywords: magnetic nanoparticles, iron oxide nanoparticles, magnetic resonance imaging, enhanced permeability and retention (EPR), drug delivery, cancer imaging
Graphical Abstract
Nanomaterials have demonstrated favorable properties and great potentials for imaging and drug delivery applications, especially in cancer diagnosis and treatment. In recent years, a rapidly growing number and a wide range of nanomaterials have been developed in recent years.1–3 While much greater knowledge and understanding in the interface of nanomaterials and biological systems has been gained to guide the rational design and engineering of nanomaterials with controlled composition, size, shape, surface properties and functions,4–7 some major challenges that hinder the further advance of nanomedicine and its clinical translation are also recognized.7–9 In particular, the efficiency of delivering nanoparticle probes or drug carriers to the targeted diseased tissues (e.g. tumors) is generally poor.8 The enhanced permeability and retention (EPR) effect mediated by leaky tumor vasculatures, albeit the debate on the presence and extent of the EPR effect given the heterogeneity of tumors and tumor microenvironment,10 is widely considered to be a major driving force for nanoparticles to reach and accumulate in the tumor, through either passive or active targeting.11 However, few strategies have been explored to take advantage of the EPR effect for increased tumor specific delivery and efficient intratumoral penetration without compromising other favorable properties of nanoparticles or introducing other complications (e.g. systematic toxicity, poor clearance and degradation).
Increasing evidence has shown that the interactions between nanoparticles and the biological environment, such as cells, tissues and plasma, are strongly associated with their physical and chemical properties, e.g., size, shape, composition, properties and functionalities of surface and surface coating materials, which subsequently affect the delivery efficiency and tumor accumulation.2,6,9,12–16 Earlier studies have suggested that larger sized nanoparticles, e.g., 50–200 nm, could enhance the EPR effect by limiting nanoparticle intravasate back to the circulation.17–19 However, in addition to poor biodegradation and clearance,15 which is a concern particularly related to the nanoparticles containing metal element(s), nanoparticles with larger sizes are also less efficient in extravasation from the leaky tumor vessel and more difficult to diffuse or navigate deep into the central areas of a tumor.17,20 On the other hand, nanoparticles with small sizes, i.e., <8 nm, are capable of avoiding rapid renal clearance compared to low molecular weight small molecules, delaying reticuloendothelial system (RES) uptake and then being degraded faster than larger particles in RES organs.15,21 Moreover, smaller nanoparticles (i.e., core size <15 nm) can permeate farther in the tumor with better intratumoral distribution compared with their larger counterparts.22–26 For example, 15 nm gold nanoparticles showed the longest permeation distance in the xenograft tumors among a series of particles with different sizes (15, 30, 60 and 100 nm) at 48 h after intravenously (i.v.) administration.26 One approach to facilitate the EPR effect while preserving the clearance advantages of small size nanoparticles is to construct a large nanocomplex with smaller nanoparticles in order to restrict the extravasated nanocomplex back to the vessel after delivered to the tumor. Delivered nanocomplex then can be dissociated to small nanoparticles under the stimulation of external energy or a physiological condition that is the characteristic to the tumor environment, e.g., acidic condition.27 However, such EPR enhancing approach is “one directional” in promoting retention by slowing down intravasation, but extravasation of such large nanocomplex from the blood vessels to the tumor tissue interstitial is slow and kinetically restricted.
Here, we report that ultrafine iron oxide nanoparticles (uIONPs) with a 3.5 nm core size and size dependent bright-to-dark (or T1–T2) magnetic resonance imaging (MRI) contrast switching can easily extravasate through tumor vessel and subsequently penetrate deeper into the tumor comparing to the IONPs with larger sizes. More importantly, uIONPs can self-assemble or form clusters in the tumor interstitial space to prevent the nanoparticles re-entering into the circulation via blood and lymphatic vessels, thus resulting in improved passive tumor targeting and delivery. The possible mechanism of “bi-directionally” exerting the EPR effect is illustrated in Figure 1. The EPR driven delivery and intra-tumor clustering of uIONPs were visualized in the 4T1 mouse mammary cancer model by MRI, in which “bright” signal from longitudinal relaxation time T1 weighted contrast (single dispersed uIONPs) switching to “dark” signal from transverse relaxation time T2 weighted contrast (clustered or packed uIONPs) was observed. Greater tumor uptake, deeper tumor penetration and more extended intratumoral distribution of uIONPs were confirmed by ex vivo multiphoton microscopic imaging. Results from this study further demonstrate the critical role of the size-dependent effect in nanoparticle drug delivery, especially for intratumoral delivery and distribution, and more importantly, introduce a strategy for rational design and optimization of engineered nanomaterials for tumor-targeted imaging and imaging-guided drug delivery.
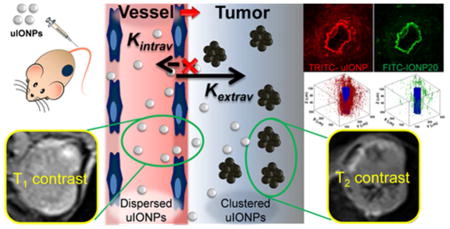
Figure 1.

Schematic illustration of the mechanism of enhancing the EPR effect and tumor accumulation by ultrafine iron oxide nanoparticles (uIONPs) with bright-to-dark T1–T2 MRI contrast switch. uIONPs extravasate faster and easier from the leaky tumor vessels into a tumor with favorable kinetics (increased Kin) and then self-assemble to clusters in the tumor interstitial space with relatively low pH (~6.5), thus restricting clustered uIONPs intravasation back into circulation (decreased Kout).
RESULTS AND DISCUSSION
Efficient Delivery and improved Intratumoral Distribution of Sub-5 nm uIONPs
We used multi-photon microscopic imaging to investigate extravasation, penetration and diffusion of fluorescent dye labeled uIONPs and larger IONPs in tumors, which not only allow us to measure and compare the amount of the nanoparticles in the tissue, but also provide the better spatial information and resolution on intratumoral distribution of the nanoparticles in 2D sections and in a 3D volume than chemical element analysis or conventional in vivo optical imaging2, 6,22 used in several earlier studies on the size dependent effect on passive tumor targeting with gold nanoparticles. To investigate the size effect exclusively, we co-injected two different types of IONPs, i.e., 3 nm uIONPs labeled with a red fluorescent dye tetramethylrhodamine or TRITC (TRITC-uIONP) and 20 nm IONP labeled with a green fluorescent dye fluorescein isothiocyanate or FITC (FITC-IONP20), in the same mice bearing orthotopic mouse mammary tumors, then used different readout channels to detect and differentiate the different nanoparticles in the same regions of interest. With co-injection, the delivery route and barriers, the intratumoral pressure and physiological environment that nanoparticles of different sizes navigate through are the same for both types of nanoparticles. As observed by the two-photon microscopy images (Figure 2) collected 3 h after co-injection of 3 nm TRITC-uIONP and 20 nm FITC-IONP20, both types of nanoparticles exhibited mostly dense and heterogeneous distributions around the blood vessel as shown in Figure 2a. Imaging analysis based on FITC (green) and TRTIC (red) fluorescence over the extended area around the selected tumor blood vessel revealed distinct nanoparticle extravasation profiles for TRITC-uIONP and FITC-IONP20, respectively (Figure 2b–d and Figure S1). 3D reconstruction of a representative tumor site containing a selected blood vessel (Figure 2c, d) showed a 6.4-fold higher accumulation of uIONPs in this region than that of larger IONP20 based on the number of particles derived from computing and counting pixels with respective fluorescent colors. This quantitation is highly dependent on the number of the particles in the voxel or in the selected volume of interest regardless the signal intensity, size of the nanoparticles and the amount of iron. Compared to the larger IONP20, most uIONPs (> 95%) appeared to extravasate through the tumor blood vessel into the tumor interstitial space and reached to the area as far as 60–80 μm away from the blood vessel wall (n=3) (Figure 2d). In contrast, most of larger IONP20 diffused within the perivascular space only 10 μm from the same blood vessel. Given the same injected dose (i.e., 20 Fe mg/kg mouse weight), delivery route and tumor microenvironment encountered by different nanoparticles, this result indicates that the extravasation of uIONP from the tumor vessel is more efficient than larger sized counterparts. Furthermore, uIONP may be easier to navigate through the tumor interstitial space and tumor tissue microenvironment than large nanoparticles.
Figure 2.

(a) Multiphoton images of TRITC-uIONP (red) and FITC-IONP20 (green) distributions in the tumor sections. TRITC-uIONP and FITC-IONP20 were i.v. co-injected in the same mice bearing orthotopic 4T1 mouse mammary tumors. Images were recorded from the tumor collected at 3 h after co-injection. The extravasation of two different nanoparticles from the same tumor vessel, which is seen as an irregular donut with the brightest fluorescent intensity, can be observed based on two distinct fluorescent colors. 3D rendering of the volume reconstructed from z-stacked images of the selected tumor sections showing the spatial distributions of TRITC-uIONP (b) and FITC-IONP20 (c) in a tumor after extravasating from the vessel (colored in blue), and (d) the corresponding profiles of the amounts of nanoparticles with two different sizes over the distance away from the vessel.
In addition to the 3D volumetric analysis, we further examined the intratumoral distributions of the different particles in different sections of the whole tumors using confocal fluorescence microscope. Figure 3 shows the fluorescent signal profiles and signal quantifications obtained from confocal fluorescence micrographs. Compared with IONP20, smaller sized uIONPs showed more extensive and spread distribution in both the peripheral and the central areas of the tumor, although the peripheral area is typically more vascularized. Quantitative analysis of co-localization of different nanoparticles revealed more TRITC-uIONPs in the tumor calculated from the number of fluorescent pixels in red, over FITC-IONP20 in green (Figure 3f), suggesting the greater penetration and more intratumoral distribution of red TRITC-uIONP. By estimating average amounts of accumulated TRITC-uIONP and FITC-IONP20 in each field of view from different tumor sections (n = 28), we found approximately 1.6-fold higher accumulation of uIONP compared with that of IONP20 (Figure 3f). Although there is a discrepancy in particle quantitation based on confocal microscopic analysis of sections from the tissue slices and based on analysis of 3D volume rendered tumor areas around the selected tumor vessel obtained from multiphoton imaging, both consistently showed the higher accumulation and intratumoral distributions of uIONPs than the larger particles. In the case of multiphoton imaging, the data were obtained from only those areas much closer to a tumor vessel rather than more spread areas in 2D confocal images of the tumor slices. Prussian blue staining for iron further confirmed the presence of the nanoparticles in the tumors (Figure S2).
Figure 3.

Quantitative analysis of fluorescent signals in the selected confocal microscopic images of tumor sections collected 3 h after co-injecting TRITC-uIONP (red) and FITC-IONP20 (green) into an orthotopic 4T1 tumor collected from the tumor bearing mouse. (a-d) Representative merged fluorescent images of a tumor section show more uIONPs (indicated with the arrow head) in the areas at the peripheral (a, b) and the deeper region (c, d) of the tumor. b, d are the magnified regions of interest (ROI) selected from a and c. The scale bar is 200 μm in a, c and 100 μm in b, d. (e) A representative co-localization plot shows the distribution of fluorescent signals in different colors in an individual field of view. Although TRITC-uIONP (red) and FITC-IONP20 (green) are co-localized in some pixels (the overlapped region), more signals come from the “red” region of TRITC-uIONP. (f) The correlation plot describes the overall red and green pixels in each individual field of view. The average number of pixels counted from TRITC-uIONPs is 1.6 fold higher than that of FITC-IONP20.
Worth noting, unlike larger nanoparticles that were engulfed by Kupffer cells and trapped in the RES organs, e.g., liver, uIONPs stayed in the hepatic sinusoids (Figure S3) at the time organs and tissue samples were collected. This observation suggests a longer blood circulation time of uIONP, which is in consistence with the observation from the other studies.8,28 The prolonged circulation time, which is estimated at 10 hours (blood half life time, or t1/2) for reported uIONP, has been proven to be a critical factor that contributes to the improved efficiency of tumor accumulation and the less loss of nanoparticles in the RES organs.5,8,28 Moreover, uIONPs were found in the void space in Bowman’s capsule (Figure S4), supporting the early report and MRI observation of the renal excretion and clearance of uIONPs,15,21 while larger IONP20 could not cross the capillary wall in glomerulus.
Intratumoral Clustering of uIONPs Revealed by T1–T2 MRI Contrast Switch
IONPs have been intensively studied as MRI contrast agents and drug carriers.2,29 Most formulations of IONPs with a core size over 10 nm exhibit strong “darkening” or transverse relaxation time T2 weighted contrast in MRI due to very high ratios of the transverse relaxivity (r2 or 1/T2) to the longitudinal relaxivity (r1 or 1/T1), i.e., r2/r1 (typically 10–200).15, 30–31. In comparison, gadolinium chelate based “bright” T1 weighted contrast agents widely used in clinical applications have r2/r1 < 1, typically. From our early investigation of the relationship between the IONP size and MRI relaxivities,15,32 the uIONPs with a diameter of 3.5 nm and an r2/r1 ratio of 3.8 can generate effective T1 weighted MRI contrast when the nanoparticles are highly dispersed, e.g., in the circulating blood and at low concentrations.15 The T1 contrast is attributed to the ultrafine size, which leads to the higher portion of magnetic Fe ions on the particle surface to effectively altering the longitudinal and transverse relaxation times of surrounding water protons. In addition, the forms of dispersion (i.e., single-dispersed or clustering or self-assembling) of IONPs may affect the relaxation times and MRI contrast behaviors, often seeing drastically increasing the T2 contrast effect by clustering of the small sized IONPs.33–36 As we reported early, uIONPs induced bright T1 contrast when single-dispersed in the circulating blood, whereas turned into dark T2 contrast when being engulfed and confined in the cells or taken up by the liver.15 This T1 to T2 contrast switch caused by the change of surrounding microenvironment and the dispersion form of uIONPs therefore may enable probing of delivery process and intratumoral accumulation of uIONPs in vivo by MRI.
We performed T1 and T2 weighted MRI scans on BALB/c mice bearing orthotopic 4T1 tumors before and after i.v. administering uIONPs. In the first 5–150 mins after injection, T1 weighted MRI revealed gradually increased bright contrast (i.e., hyperintensity) in the peripheral tumor regions where vasculatures were well developed (Figure 4a), similar to the contrast enhancing pattern of the typical T1 weighted contrast enhancement by gadolinium chelate based contrast agents that widely used in the clinical imaging (Figure S5). However, the hyperintensity from the T1 contrast enhancing effect that induced by the single-dispersed uIONPs in the circulating blood diminished at 24 h post injection, whereas the dark T2 contrast with hypointensity emerged in the tumor in T2 weighted images of the same tumor sections. These changes of MRI signal intensity (SI) suggested that uIONPs exhibit the T1 contrast effect while single-dispersed in the circulating blood and tumor vasculature, and turned to the T2 contrast effect while forming clusters in the tumor interstitial. In contrast, this T1 to T2 contrast switch was not observed in the groups of tumor bearing animals that received larger nanoparticles (i.e., IONP10 or IONP20) under the similar experimental conditions (Figure S6). Measurements of pre- and post-injection SI in T2 weighted images of tumor showed that the group received uIONPs (Figure 4b) had the most significant SI change compared with the groups treated with IONP10 and IONP20, indicating the highest accumulation of uIONP in the tumor. Colorimetric methods measuring the total iron amount in the collected tumors confirmed the greater amount of uIONPs delivered to the tumors than the nanoparticles with larger sizes (Figure 4c).
Figure 4.

(a) T1 and T2 weighted MRI of a mouse bearing orthotopic 4T1 tumors before and after i.v. administration of uIONP at different time points. Bright contrast with increasing signal in T1 weighted MR images was observed in the tumor, particularly peripheral regions (inserted panel), at early time points (i.e. 5 – 150 min.) resulted from the single dispersed uIONP, while signals in several regions of the tumor turning dark (arrow indicated) was observed in T2 weighted images 24 h after uIONP injection because of uIONPs clustering in the tumor interstitials. (b) T2 weighted MRI signal changes in the tumors at 24 h in vivo and (c) iron contents in the collected tumor tissue measured ex vivo by the colorimetric method (n=3), showing that a higher tumor accumulation of uIONPs comparing to those of IONPs with larger sizes. Even though the clustered uIONP has lower r2 value than larger counterparts (10 and 20 nm), it showed the greatest decrease of SI in tumor because of the highest accumulation amount.
The observed contrast switch suggested a possible mechanism of “bidirectional” kinetic facilitation of the EPR effect by uIONP that leads to the greater tumor accumulation as illustrated in Figure 1. Different from the conventional approach that focused on using larger nanoparticles with sizes of 80–300 nm which promote the retention part of the EPR effect as larger particles may be more effectively trapped in the tumor once extravasate from the tumor blood vessels, this bidirectional mechanism of exerting the EPR effect with uIONPs emphasizes on improving particle extravasation as well as restricting intravasation of nanoparticles, taking advantage of both key elements of the EPR effect. In this case, uIONPs are highly dispersed in the vasculature during the circulation and can readily extravasate from the blood vessel to the tumor interstitial space with less hindrance than larger particles, but may assemble into aggregated clusters in the tumor interstitial space where there is a tighter space and relatively lower pH condition or even being endocytosed by the cancer cells, thus enhancing the tumor retention by restricting clustered uIONPs circulating back to blood or lymphatic vessels.
The reported capability of tissue environment and dispersion-form dependent T1–T2 contrast switch in uIONP is important as there is lack of in vivo and non-invasive capability to report the temporal and spatial information on the tissue and even cellular compartmentalization of the nanoparticle imaging probes and drug delivery systems. For image-guided delivery with MRI capable nanoparticles the tissue environment specific MRI contrast switching from T1 to T2 contrast not only enables anatomically tracking the delivery of the nanoparticle probe/carriers, but also reporting the tissue characteristics and environment where the nanoparticles accumulate.
In terms of biodistribution of uIONPs, we used in vivo MRI to determine the uptake and retention of uIONPs in selected mouse organs, i.e., vessel, spleen, liver, lung, tumor, muscle and kidney (Figure S7). In contrast to larger counterparts (IONP10 and IONP20), uIONPs showed enhanced T1 signal in vessels while IONP10 and IONP20 showed T2 signal drops. In addition, uIONP induced T1 MRI signal in tumor maintained for even after 4 h post injection. Notably, the SI in spleen of the mice received uIONPs changed gradually instead of getting saturated at first time point (10 min) that exhibited by IONP10 and IONP20, suggesting that uIONPs are not as quickly trapped by RES. Bright hyperintense T1 signal was observed in kidney of mice received uIONPs during 24 h observation, which is attributed to the prolonged half life (t1/2~10 h). Besides the renal clearance as we reported earlier15, uIONPs were believed to be cleared quicker than the larger counterpart via biliary tract/intestine or drainage by lymph system,37–39 and degraded in major RES organs (i.e. liver and spleen) as estimated by the recovering of T2 relaxation times measured by MRI non-invasively.15
Confirmation of the Size Dependent MRI Contrast Switch by in vitro Intercellular Imaging
The relaxivities of IONPs were found to be size dependent. Furthermore, enhanced T2 weighted MRI contrast caused by assembling or clustering single-dispersed magnetic nanoparticles has been observed in earlier studies.15,34–36 Usually T2 relaxation accelerates substantially after magnetic nanoparticles assembling together, resulting in a large increase of the r2 relaxivity and subsequent strong T2 contrast enhancing effect. However, switching between T2 and T1 effect is difficult for most magnetic nanoparticles made in larger sizes due to their high r2/r1 ratios. Since the r2/r1 ratio of uIONP is significantly low at 3.8–4, thus uIONPs can exhibit a sharp relaxivity switch/transition after clustering into larger counterparts.
To demonstrate the capability of the size dependent contrast switch with uIONPs, more specifically the contrast switch between single-dispersed to the clustered form, we first prepared protein (casein) micelle encapsulated uIONPs (CM-uIONPs) to mimic the clustered form of uIONPs. MRI of phantoms containing single-dispersed uIONPs or micelle encapsulated CM-uIONPs exhibited a clear T1 to T2 contrast switch as shown in Figure 5a, presenting as bright to dark, for single-dispersed uIONPs and micelle encapsulated CM-uIONPs, respectively. The r1 and r2 values were calculated to be 1.7 and 65 mM−1•s−1 (for CM-uIONPs, compared to 4.1 and 16.4 mM−1•s−1 for uIONPs. A significant increase of the r2/r1 ratio from 4.0 for single-dispersed uIONPs to 44 after uIONPs being clustered and micelle encapsulated resulted in a dominant T2 signal darkening effect overwhelming the T1 effect. The contrast switch between single-dispersed and aggregated forms is attributed to the reduction of the total Fe cations on the unit surface of the nanoparticles and the inter-particle dipolar interactions after clustering, accompanying by the decrease of r1 and the increase of r2.
Figure 5.

T1 to T2 contrast switching is observed when uIONPs are localized in different environments. Bright T1 contrast in T1 weighted MRI diminished when uIONPs encapsulated in casein micelle CM-uIONPs which turned completed signal void (dark) in T2 weighted MRI (a). Similarly but in a reverse order, when cell engulfed uIONPs strong T2 effect and darkened contrast was observed in the cell phantom as uIONPs packed in the lysosome, whereas it turned to the bright T1 contrast when uIONPs released from the cells. However, this contrast switch is not obvious with IONP20 (b). The scale bar for the insert is 50 nm. (c) Bright T1 contrast was seen in the hepatic vessel in T1 weighted liver MR images, which was induced by the single-dispersed uIONPs, while dark T2 contrast was seen in the background liver tissue (c, left). IONP20 with 20 nm core size showed no such dual contrast effect (c, right).
To support the contrast switch as the result of clustering of uIONPs in the tumor interstitial space or uptake by cells, we investigated the MRI contrast changes in cells that first internalized uIONPs and then released encapsulated uIONPs when cells were broken down after treating with the cell lyzing agent. Mouse macrophage Raw264.7 cells were incubated with uIONPs for 4 h, allowing for macrophages becoming labeled with uIONPs, MRI of the cell phantoms with suspended labeled cells showed distinct hypointensity (dark T2 contrast) resulted from the cellular uptake of uIONPs (Figure 5b). Transmission electron microscopy (TEM) images revealed that uIONPs packed in the cell lysosomes in the aggregated/clustered form. After half of uIONP labeled cells being treated with the cell lysing buffer, MRI scans of phantoms containing cell lysing buffer treated cells revealed hyperintense MRI signal and bright T1 contrast emerged as a result of the re-dispersion of the intracellularly clustered uIONPs released from the lyzed cells. TEM images confirmed the single-dispersion of the released uIONPs in the lysate (Figure 5b). This T1 to T2 contrast switch is similar to the process we demonstrated in the in vivo MRI experiments. Using liver imaging as an example, strong T1 contrast resulted from uIONP dispersing in the blood allowed clear depiction of the hepatic vasculatures, while the darkening of the liver tissue in the background is attributed to the accumulation of uIONPs in hepatic sinusoids (Figure 5c). Notably, no such T1 to T2 switch was observed in both in vitro and in vivo MRI when using larger IONPs (core sizes of 10 and 20 nm).
In addition to the factors that tight interstitial space and interstitial pressure of the tumor may promote the clustering of uIONPs, it is possible that the acidic intratumoral pH may also facilitate the uIONP clustering. Indeed, the reported uIONP exhibited pH responsive self-assembling in vitro when tuning pH conditions to mimic various physiological environments, including in blood (pH~7.4), tumor interstitial (pH~6.5), intracellular lysosomes (pH 5.5) (Figure 6). While at pH 7.4, uIONPs showed the least T2 effect and greatest T1 effect. There is 1.5% SI decrease in T2 weighted imaging along with 222% SI increase in T1 weighted imaging, compared with the buffer solution containing no uIONPs. The pH responsive SI changes were especially significant at pH 6.5 where a 54% SI change in T2 weighted imaging and 120% SI change in T1 weighted imaging were observed. These SI changes were 66% and 105% at pH 5.5, 60% and 104% at pH 4.5, respectively. These results suggest that the lower pH conditions could promote self-assembly of highly dispersed uIONPs to form clusters or larger aggregations, making the switch of T1 contrast (bright) into T2 contrast (dark). The pH-responsive behavior and the tissue microenvironment-stimulated MRI contrast switch may be resulted from the presence of a large number of carboxyl and amine groups in the oligosaccharide coating of uIONPs. The surface charge was estimated to be −27 mV at pH 7.0 while the carboxyl groups are deprotonated. This negative surface charge decreased sharply as the pH decreased, due to gradual protonation of the surface carboxyl groups, thus reducing the repelling electrostatic force between particles and resulted in self-assembled aggregates. The coexisted carboxyl and amine groups on the nanoparticle surface leads to a zwitterionic-like system that is pH responsive and can be tuned to a certain pH condition to destabilize mono-dispersed uIONPs and promote aggregation of the nanoparticles. Similar phenomena have been observed in the zwitterionic small molecules coated gold nanoparticles.40
Figure 6.

pH-responsive properties of the reported uIONP. (a) Surface charge and hydrodynamic size of uIONP vary at different pH conditions; (b) pH dependent MR signal intensity changes as MRI contrast switching with the different forms of uIONPs.
CONCLUSIONS
In summary, we demonstrated that sub-5 nm uIONPs enhanced the EPR driven passive targeting in tumors and were delivered into the tumor center with a high efficiency comparing to the particles with large sizes (i.e. 10 and 20 nm). The greater tumor accumulation of uIONPs in orthotopic mouse mammary tumors is attributed to more efficient nanoparticle extravasation from tumor vessels and deeper penetration into tumor tissue evidenced by two-photon microscopy, accompanied by the less “wash-out” from the tumor as the result of tissue environment triggered self-assembling/clustering in the tumor interstitial or in the cells. The self-assembling/clustering of uIONPs in the tumor was evidenced by the observed switching of bright T1 contrast to dark T2 contrast in MRI. The mechanism for uIONP enhancing the EPR effect is “bidirectional”, taking advantage of both easy extravasation of single-dispersed uIONPs from the tumor vessels and restricted intravasation of clustered uIONPs. Given the tumors are typically acidic, the pH-responsive properties exhibited by the reported uIONPs may play a role in forming nanoparticle aggregates, however, other possible tumor environment specific conditions promoting nanoparticles aggregating may exist and can be used to apply for exerting the EPR effect and improving delivery. In addition, adjuvant vessel normalization or extracellular matrix (ECM) breakdown is expected to benefit this exertion effect for other tumor types that with very poor vascularization or high stromal extent, such as pancreatic tumors.41–42 However, given the heterogeneity of different cancers and tumor microenvironment, the applicability of the demonstrated EPR enhancing approach need to be further investigated and tested in different tumor types and animal models with different nanoprobes. Important to image-guided delivery with MRI capable nanoparticles, the tissue environment specific MRI contrast switch from T1 to T2 contrast not only enables anatomically tracking the delivery of the nanoparticle probe/carriers, but also reports the tissue characteristics and environment where the nanoparticles accumulate. As we demonstrated in this work, the size dependent effect in delivery, especially in the intratumoral transportation, together with the possible utilization of the physiological conditions in the tumor microenvironment as stimulations to control and modulate the nanoparticle size in vivo provides an effective strategy for the rational design and optimization of engineered nanotheranostics for tumor-targeted imaging and imaging-guided drug delivery.
EXPERIMENTAL SECTION
Materials
All materials were used as received. Ferric nitrite (FeNO3·9H2O), sodium oleate, dimethylformamide (DMF), glucose, chloroform, dimethyl sulfoxide (DMSO), ethanol, aceton, sodium hydroxide (NaOH), hydrochloric acid (HCl), ammonium hydroxide (NH4OH), fluorescein isothiocyanate (FITC), tetramethylrhodamine (TRITC), 4′,6-diamidino-2-phenylindole (DAPI), optimal cutting temperature compound (OCT), agarose was obtained from Thermo Fisher Scientific (Rockford, IL). Dulbecco’s phosphate-buffered saline (PBS), methanol, sodium bicarbonate (NaHCO3), trypsin (0.25%) and fetal bovine serum (FBS) were obtained from Mediatech INC (Herndon, VA). Eagle’s Minimum Essential Medium (EMEM), Penicillin-streptomycin solution, Trypsin-EDTA solution, Tyrode’s solution, Hank’s balanced salt solution (HBSS), casein, ninhydrin and Toluidine Blue O (TBO) were purchased from Sigma (St. Louis, MO, USA).
Synthesis of ultrafine iron oxide nanoparticles
The synthesis of oligosaccharide coated ultrafine iron oxide nanoparticles (uIONP) with a 3.5 nm core size and iron oxide nanoparticles with larger core sizes at 10 and 20 nm (IONP10 and IONP20) were prepared as previously reported.15 The sizes of the prepared IONPs were confirmed by TEM (Figure S8). For multiphoton microscopy investigation of the size dependent tumor accumulation, the oligosaccharide coated uIONP and IONPs were labeled with either green fluorescent dye FITC or red fluorescent dye TRITC through the amine groups on the nanoparticle surface that were functionalized using the method reported by Josephson et al.43 Briefly, 1 mg IONPs were dispersed in 2 mL ammonia solution, and incubated at 37 °C overnight. The functionalized IONPs were washed carefully with ultra-4 centrifuge tubes for several times to get rid of the free amines. Then the functionalized IONPs were redispersed in deionized water and reacted with TRITC or FITC following the protocol provided by the manufacturer. For casein milk protein encapsulated uIONP micelles that mimic the assembled cluster form, 2 mg pretreated casein were added to 1 mg uIONP or IONP aqueous solutions under rapid stirring. 0.4% Glutaraldehyde was added dropwise to crosslink casein layer outside uIONP clusters after 1 h stirring. Particles were washed by centrifuge for several times to get rid of the unbound casein.
Confirming MRI contrast switching caused by intracellular uptake and packing of uIONPs
To better understand the contrast switching in physiological conditions, MRI scans and TEM observations were performed with cells internalized with uIONPs. Mouse macrophage Raw264.7 cells were obtained from ATCC (Manassas, VA), and cultured following the supplier’s instructions. RAW264.7 cells were seeded in the flask with 10% FBS containing RPMI-1640 cell culture medium. After attached for 24 h, the medium was replaced with the one containing uIONPs or IONP20 at a concentration of 100 μg Fe/mL. Control cells without IONP labeling were treated with fresh medium without nanoparticles. After incubating at 37 °C for 4 h, the medium was removed. Cells were washed with PBS twice carefully to remove the free nanoparticles. Then the cells were trypsinized by 0.05% trypsin/EDTA, washed with PBS twice and collected in centrifuge tubes. For each group, cells were divided into two equal parts, one of which was treated with cell lysis buffer, while the other added with equal volume of PBS. The lysis was allowed to proceed for 30 mins assistant with pipette mixing. After suspension, MRI scan of the cell phantoms was performed on a 3T MRI scanner (Tim Trio, Siemens, Erlangen, Germany) using a T1 and T2 weighted fast spin echo sequences. To investigate the internalized nanoparticles in cells by TEM, RAW264.7 cells were seeded in 6-well plate at a density of 3×10⁵ cells per well and treated under the same conditions. Then the cells were washed with PBS twice carefully and fixed with 2.5% glutaraldehyde in 0.1 M cacodylate buffer (pH 7.4) and then washed and post-fixed with 1% osmium tetroxide. After rinsing with de-ionized water, samples were dehydrated through an ethanol series to 100% ethanol, and then infiltrated with Eponate 12 resin (Ted Pella Inc., Redding, CA) overnight. After additional infiltration, samples were placed in labeled Beem capsule and polymerized at 60 °C in an oven. Ultrathin sections were cut at 70–80 nm thickness on a Leica UltraCut S ultramicrotome (Leica Microsystems Inc., Buffalo Grove, IL). Grids with ultrathin sections were stained with 5% uranyl acetate and 2% lead citrate. Ultrathin sections were imaged on a JEOL JEM-1400 TEM (JEOL Ltd., Tokyo, Japan) equipped with a Gatan US1000 CCD camera (Gatan, Pleasanton, CA).
Determining pH-responsive clustering of uIONPs
To study the response of uIONPs under different pH conditions, the pH-responsive properties of uIONPs were tested by adjusting the solution pH from 2.0 to 7.0 with 1 M NaOH or HCl under rapid stirring. The pH adjusted nanoparticle solutions were then equilibrated for 30 min, followed by measuring the changes of hydrodynamic size and surface charge by dynamic light scattering (DLS, Malvern Zeta Sizer Nano S-90) instrument. To determine the changes in MRI contrast as the result of packing or clustering of nanoparticles responding to the change of pH, uIONP solutions were prepared at different pH conditioned PBS (i.e. pH 7.4, 6.5, 5.5 and 4.5) and balanced for 4 h. T1 and T2 weighted fast spin echo images of these phantom solutions were recorded on a 3T MRI scanner (Tim/Trio, Siemens, Erlangen, Germany) using MRI sequences and parameters reported previously.
Animal Model
All animal experiments were conducted following a protocol approved by Institutional Animal Care and Use Committee (IACUC) at Emory University. Orthotopic 4T1 breast tumor model was established by injecting 2×10⁶ of the 4T1 mouse mammary tumor cells into the mammary fat pad of 6- to 8-week old female Balb/c mice (Harlan Laboratories, Indianapolis, IN). The tumors were allowed to grow 10–14 days to reach a volume of approximately 100 mm3 for in vivo or ex vivo experiment.
Observing Size-dependent tumor accumulation by MRI
Tumor bearing mice were randomly divided into 3 groups (n=3), received i.v. injection of uIONPs, IONP10, IONP20, respectively. The dosage is 20 mg Fe per kg of mouse body weight. In vivo MR images were obtained before, 60, 100, 150 min and 24 h after i.v. administration on a 3T MRI scanner using a fat-suppressed T1 and T2 weighted fast spin echo sequence. The parameters were TR = 3600 ms, TE = 86 ms, flip angle = 150, image matrix = 154 × 320, field of view (FOV) = 40 × 120 mm2, slice thickness = 1 mm and the number of averages = 3. Regions of interest (ROI) with the same areas were drawn in the tumor at the same depth. The relative contrast enhancement at different time points was calculated as ΔSI= (SIpre−SIpost)/SIpre×100%.
Multi-photon microscopy of IONPs in the dissected tumor tissues ex vivo
Two different sized IONPs labeled with either red or green fluorescent dye, i.e., TRITC-uIONP and FITC-IONP20 were co-injected to the same animas bearing the 4T1 tumor (n = 3) at a dose of 30 mg Fe/kg. Mice were euthanized 3 h after receiving the co-injection of IONPs with different sizes and fluorescent colors. After tumors were collected, they were sliced into 2 mm thick sections which then were placed on glass slides. Fluorescent images were taken with two photon microscope (Zeiss LSM 710, Jena, Germany) with a Chameleon titanium-sapphire NIR tunable laser (Coherent Inc., CA, USA) at 880 nm. The red fluorescent signal from TRITC and green fluorescent signal from FITC were collected with filter sets BP 565–610 (red channel) and BP 500–550 (green channel) simultaneously, with a resolution of 512×512 (for NND) or 1024×1024 (for single panel) pixels and a scan speed of 3.15 μs per pixel. The histograms of the green (FITC) and red (TRITC) fluorescent intensities of selected region/areas of interest (indicated by the circular lines surrounding a selected blood vessel, Figure S1) in the fluorescence images of tumor sections were analyzed by an in-house built MATLAB program. The 3D reconstruction and visualization was conducted by also the in-house MATLAB program using 70 layers of Non-Descanned Detector (NDD) images (2 μm interval) to obtain a reconstructed tumor volume. Each image was processed with a threshold binarization method to visualize and isolate the nanoparticle based on the fluorescence distinguished from background baseline.
Analyzing nanoparticle biodistribution by ex vivo confocal microscopy and tissue iron measurement
To better quantify the intratumoral distribution and tumor accumulation of nanoparticles, we analyzed the collected tumors using ex vivo histological examinations with confocal microscope and Prussian blue iron staining, and quantification of iron contents. For confocal microscopy, the tumors and main organs (i.e. liver and kidney) were collected 4 after h injection of nanoparticles. The tissue samples were embedded in OCT and frozen in liquid nitrogen. After cryostated into 8 μm slice, the tumor sections were stained with DAPI, and placed under a confocal microscope (Zeiss LSM510, Jena, Germany). Quantitative co-localization analysis of confocal fluorescence micrographs and red/green fluorescence intensities from dye labeled nanoparticles were determined in Zeiss Zen2009. A total of 21 tumor slices was analyzed to obtain the average levels of red and green fluorescence. Prussian blue staining to confirm the localization of IONPs in tissue sections and colorimetric method to quantify the amount of iron in tumors was performed as described in previous work.15
Statistical analysis
Data were presented as mean ± standard derivation (SD). Statistical differences in cell uptake and in vivo imaging were determined by unpaired student t-test. p<0.05 was considered as significant.
Acknowledgments
Funding Sources
This work is supported in parts by the grants from NIH (R01CA154846-02 and Cancer Nanotechnology Platform Project U01CA151810-02) to HM and LY.
We would like to thank Deborah Eltzroth Martinson in Emory Integrated Cellular Imaging (ICI) core for the assistance on capturing two-photon micrographs.
Footnotes
Author Contributions
The manuscript was written through contributions of all authors. All authors have given approval to the final version of the manuscript.
Supporting Information Available: Multi-photo microscopic image data of intratumoral distributions of 3 nm uIONP and 20 nm IONP20; Confocal microscopic and Prussian blue iron staining images of uIONPs in tumor and kidney tissue sections, MRI data on tumor and organ distributions of different IONPs and TEM images of different IONPs. This material is available free of charge via the Internet at http://pubs.acs.org.
References
- 1.Min YZ, Caster JM, Eblan MJ, Wang AZ. Clinical Translation of Nanomedicine. Chem Rev. 2015;115:11147–11190. doi: 10.1021/acs.chemrev.5b00116. [DOI] [PMC free article] [PubMed] [Google Scholar]
- 2.Huang J, Li Y, Orza A, Lu Q, Guo P, Wang L, Yang L, Mao H. Magnetic Nanoparticle Facilitated Drug Delivery for Cancer Therapy with Targeted and Image-Guided Approaches. Adv Funct Mater. 2016;26:3818–3836. doi: 10.1002/adfm.201504185. [DOI] [PMC free article] [PubMed] [Google Scholar]
- 3.Tian G, Zhang X, Gu ZJ, Zhao YL. Recent Advances in Upconversion Nanoparticles-Based Multifunctional Nanocomposites for Combined Cancer Therapy. Adv Mater. 2015;27:7692–7712. doi: 10.1002/adma.201503280. [DOI] [PubMed] [Google Scholar]
- 4.Nel AE, Mädler L, Velegol D, Xia T, Hoek EM, Somasundaran P, Klaessig F, Castranova V, Thompson M. Understanding Biophysicochemical Interactions at the Nano-Bio Interface. Nat Mater. 2009;8:543–557. doi: 10.1038/nmat2442. [DOI] [PubMed] [Google Scholar]
- 5.Blanco E, Shen H, Ferrari M. Principles of Nanoparticle Design for Overcoming Biological Barriers to Drug Delivery. Nat Biotechnol. 2015;33:941–951. doi: 10.1038/nbt.3330. [DOI] [PMC free article] [PubMed] [Google Scholar]
- 6.Setyawati MI, Tay CY, Docter D, Stauber RH, Leong DT. Understanding and Exploiting Nanoparticles’ Intimacy with the Blood Vessel and Blood. Chem Soc Rev. 2015;44:8174–8199. doi: 10.1039/c5cs00499c. [DOI] [PubMed] [Google Scholar]
- 7.Shi J, Kantoff PW, Wooster R, Farokhzad OC. Cancer Nanomedicine: Progress, Challenges and Opportunities. Nat Rev Cancer. 2016;17:20–37. doi: 10.1038/nrc.2016.108. [DOI] [PMC free article] [PubMed] [Google Scholar]
- 8.Wilhelm S, Tavares AJ, Dai Q, Ohta S, Audet J, Dvorak HF, Chan WC. Analysis of Nanoparticle Delivery to Tumours. Nat Rev Mater. 2016;1:16014. [Google Scholar]
- 9.Prabhakar U, Maeda H, Jain RK, Sevick-Muraca EM, Zamboni W, Farokhzad OC, Barry ST, Gabizon A, Grodzinski P, Blakey DC. Challenges and Key Considerations of the Enhanced Permeability and Retention Effect for Nanomedicine Drug Delivery in Oncology. Cancer Res. 2013;73:2412–2417. doi: 10.1158/0008-5472.CAN-12-4561. [DOI] [PMC free article] [PubMed] [Google Scholar]
- 10.Maeda H. Toward a Full Understanding of the EPR Effect in Primary and Metastatic Tumors as Well as Issues Related to its Heterogeneity. Adv Drug Deliv Rev. 2015;91:3–6. doi: 10.1016/j.addr.2015.01.002. [DOI] [PubMed] [Google Scholar]
- 11.Bertrand N, Wu J, Xu X, Kamaly N, Farokhzad OC. Cancer nanotechnology: The Impact of Passive and Active Targeting in the Era of Modern Cancer Biology. Adv Drug Deliv Rev. 2014;66:2–25. doi: 10.1016/j.addr.2013.11.009. [DOI] [PMC free article] [PubMed] [Google Scholar]
- 12.Frellsen AF, Hansen AE, Jølck RI, Kempen PJ, Severin GW, Rasmussen PH, Kjær A, Jensen AT, Andresen TL. Mouse Positron Emission Tomography Study of the Biodistribution of Gold Nanoparticles with Different Surface Coatings Using Embedded Copper-64. ACS Nano. 2016;10:9887–9898. doi: 10.1021/acsnano.6b03144. [DOI] [PubMed] [Google Scholar]
- 13.Elci SG, Jiang Y, Yan B, Kim ST, Saha K, Moyano DF, Yesilbag Tonga G, Jackson LC, Rotello VM, Vachet RW. Surface Charge Controls the Suborgan Biodistributions of Gold Nanoparticles. ACS Nano. 2016;10:5536–5542. doi: 10.1021/acsnano.6b02086. [DOI] [PubMed] [Google Scholar]
- 14.Rampersaud S, Fang J, Wei Z, Fabijanic K, Silver S, Jaikaran T, Ruiz Y, Houssou M, Yin Z, Zheng S. The Effect of Cage Shape on Nanoparticle-Based Drug Carriers: Anticancer Drug Release and Efficacy via Receptor Blockade Using Dextran-Coated Iron Oxide Nanocages. Nano Lett. 2016;16:7357–7363. doi: 10.1021/acs.nanolett.6b02577. [DOI] [PMC free article] [PubMed] [Google Scholar]
- 15.Huang J, Wang L, Zhong X, Li Y, Yang L, Mao H. Facile Non-Hydrothermal Synthesis of Oligosaccharide Coated Sub-5 nm Magnetic Iron Oxide Nanoparticles with Dual MRI Contrast Enhancement Effects. J Mater Chem B. 2014;2:5344–5351. doi: 10.1039/C4TB00811A. [DOI] [PMC free article] [PubMed] [Google Scholar]
- 16.Anselmo AC, Mitragotri S. Impact of Particle Elasticity on Particle-Based Drug Delivery Systems. Adv Drug Deliv Rev. 2016;108:51–67. doi: 10.1016/j.addr.2016.01.007. [DOI] [PubMed] [Google Scholar]
- 17.Cabral H, Matsumoto Y, Mizuno K, Chen Q, Murakami M, Kimura M, Terada Y, Kano M, Miyazono K, Uesaka M. Accumulation of Sub-100 nm Polymeric Micelles in Poorly Permeable Tumours Depends on Size. Nat Nanotechnol. 2011;6:815–823. doi: 10.1038/nnano.2011.166. [DOI] [PubMed] [Google Scholar]
- 18.Chauhan VP, Jain RK. Strategies for Advancing Cancer Nanomedicine. Nat Mater. 2013;12:958–962. doi: 10.1038/nmat3792. [DOI] [PMC free article] [PubMed] [Google Scholar]
- 19.Tang L, Gabrielson NP, Uckun FM, Fan TM, Cheng J. Size-Dependent Tumor Penetration and in vivo Efficacy of Monodisperse Drug–Silica Nanoconjugates. Mol Pharm. 2013;10:883–892. doi: 10.1021/mp300684a. [DOI] [PMC free article] [PubMed] [Google Scholar]
- 20.Matsumoto Y, Nichols JW, Toh K, Nomoto T, Cabral H, Miura Y, Christie RJ, Yamada N, Ogura T, Kano MR. Vascular Bursts Enhance Permeability of Tumour Blood Vessels and Improve Nanoparticle Delivery. Nat Nanotechnol. 2016;11:533–538. doi: 10.1038/nnano.2015.342. [DOI] [PubMed] [Google Scholar]
- 21.Choi HS, Liu W, Misra P, Tanaka E, Zimmer JP, Itty Ipe B, Bawendi MG, Frangioni JV. Renal Clearance of Quantum Dots. Nat Biotechnol. 2007;25:1165–1170. doi: 10.1038/nbt1340. [DOI] [PMC free article] [PubMed] [Google Scholar]
- 22.Huang K, Ma H, Liu J, Huo S, Kumar A, Wei T, Zhang X, Jin S, Gan Y, Wang PC. Size-Dependent Localization and Penetration of Ultrasmall Gold Nanoparticles in Cancer Cells, Multicellular Spheroids, and Tumors in vivo. ACS Nano. 2012;6:4483–4493. doi: 10.1021/nn301282m. [DOI] [PMC free article] [PubMed] [Google Scholar]
- 23.Chauhan VP, Stylianopoulos T, Martin JD, Popović Z, Chen O, Kamoun WS, Bawendi MG, Fukumura D, Jain RK. Normalization of Tumour Blood Vessels Improves the Delivery of Nanomedicines in a Size-Dependent Manner. Nat Nanotechnol. 2012;7:383–388. doi: 10.1038/nnano.2012.45. [DOI] [PMC free article] [PubMed] [Google Scholar]
- 24.Popović Z, Liu W, Chauhan VP, Lee J, Wong C, Greytak AB, Insin N, Nocera DG, Fukumura D, Jain RK. A Nanoparticle Size Series for in vivo Fluorescence Imaging. Angew Chem Int Ed Engl. 2010;122:8831–8834. doi: 10.1002/anie.201003142. [DOI] [PMC free article] [PubMed] [Google Scholar]
- 25.Chou LY, Chan WC. Fluorescence-Tagged Gold Nanoparticles for Rapidly Characterizing the Size-Dependent Biodistribution in Tumor Models. Adv Healthc Mater. 2012;1:714–721. doi: 10.1002/adhm.201200084. [DOI] [PubMed] [Google Scholar]
- 26.Sykes EA, Chen J, Zheng G, Chan WCW. Investigating the Impact of Nanoparticle Size on Active and Passive Tumor Targeting Efficiency. ACS Nano. 2014;8:5696–5706. doi: 10.1021/nn500299p. [DOI] [PubMed] [Google Scholar]
- 27.Chou LY, Zagorovsky K, Chan WC. Assembly of Nanoparticle Superstructures for Controlled Biological Delivery and Elimination. Nat Nanotechnol. 2014;9:148–155. doi: 10.1038/nnano.2013.309. [DOI] [PMC free article] [PubMed] [Google Scholar]
- 28.Zhang GD, Yang Z, Lu W, Zhang R, Huang Q, Tian M, Li L, Liang D, Li C. Influence of Anchoring Ligands and Particle Size on the Colloidal Stability and in vivo Biodistribution of Polyethylene Glycol-Coated Gold Nanoparticles in Tumor-Xenografted Mice. Biomaterials. 2009;30:1928–1936. doi: 10.1016/j.biomaterials.2008.12.038. [DOI] [PMC free article] [PubMed] [Google Scholar]
- 29.Huang J, Zhong XD, Wang LY, Yang LL, Mao H. Improving the Magnetic Resonance Imaging Contrast and Detection Methods with Engineered Magnetic Nanoparticles. Theranostics. 2012;2:86–102. doi: 10.7150/thno.4006. [DOI] [PMC free article] [PubMed] [Google Scholar]
- 30.Mikhaylov G, Mikac U, Magaeva AA, Itin VI, Naiden EP, Psakhye I, Babes L, Reinheckel T, Peters C, Zeiser R. Ferri-Liposomes as an MRI-Visible Drug-Delivery System for Targeting Tumours and Their Microenvironment. Nat Nanotechnol. 2011;6:594–602. doi: 10.1038/nnano.2011.112. [DOI] [PubMed] [Google Scholar]
- 31.Huang J, Bu L, Xie J, Chen K, Cheng Z, Li X, Chen X. Effects of Nanoparticle Size on Cellular Uptake and Liver MRI with Polyvinylpyrrolidone-Coated Iron Oxide Nanoparticles. ACS Nano. 2010;4:7151–7160. doi: 10.1021/nn101643u. [DOI] [PMC free article] [PubMed] [Google Scholar]
- 32.Zhang L, Zhong X, Wang L, Chen H, Wang YA, Yeh J, Yang L, Mao H. T1-Weighted Ultrashort Echo Time Method for Positive Contrast Imaging of Magnetic Nanoparticles and Cancer Cells Bound with the Targeted Nanoparticles. J Magn Reson Imaging. 2011;33:194–202. doi: 10.1002/jmri.22412. [DOI] [PMC free article] [PubMed] [Google Scholar]
- 33.Chen H, Yeh J, Wang L, Khurshid H, Peng N, Wang AY, Mao H. Preparation and Control of the Formation of Single Core and Clustered Nanoparticles for Biomedical Applications Using a Versatile Amphiphilic Diblock Copolymer. Nano Res. 2010;3:852–862. [Google Scholar]
- 34.Arosio P, Thévenot J, Orlando T, Orsini F, Corti M, Mariani M, Bordonali L, Innocenti C, Sangregorio C, Oliveira H. Hybrid Iron Oxide-Copolymer Micelles and Vesicles as Contrast Agents for MRI: Impact of the Nanostructure on the Relaxometric Properties. J Mater Chem B. 2013;1:5317–5328. doi: 10.1039/c3tb00429e. [DOI] [PubMed] [Google Scholar]
- 35.Pöselt E, Kloust H, Tromsdorf U, Janschel M, Hahn C, Maßlo C, Weller H. Relaxivity Optimization of a PEGylated Iron-Oxide-Based Negative Magnetic Resonance Contrast Agent for T2-Weighted Spin–Echo Imaging. ACS Nano. 2012;6:1619–1624. doi: 10.1021/nn204591r. [DOI] [PubMed] [Google Scholar]
- 36.Paquet C, de Haan HW, Leek DM, Lin HY, Xiang B, Tian G, Kell A, Simard B. Clusters of Superparamagnetic Iron Oxide Nanoparticles Encapsulated in a Hydrogel: a Particle Architecture Generating a Synergistic Enhancement of the T2 relaxation. ACS Nano. 2011;5:3104–3112. doi: 10.1021/nn2002272. [DOI] [PubMed] [Google Scholar]
- 37.Zhang YN, Poon W, Tavares AJ, McGilvray ID, Chan WC. Nanoparticle–Liver Interactions: Cellular Uptake and Hepatobiliary Elimination. J Control Release. 2016;240:332–348. doi: 10.1016/j.jconrel.2016.01.020. [DOI] [PubMed] [Google Scholar]
- 38.Arami H, Khandhar A, Liggitt D, Krishnan KM. In vivo Delivery, Pharmacokinetics, Biodistribution and Toxicity of Iron Oxide Nanoparticles. Chem Soc Rev. 2015;44:8576–8607. doi: 10.1039/c5cs00541h. [DOI] [PMC free article] [PubMed] [Google Scholar]
- 39.Tsoi KM, MacParland SA, Ma XZ, Spetzler VN, Echeverri J, Ouyang B, Fadel SM, Sykes EA, Goldaracena N, Kaths JM. Mechanism of Hard-Nanomaterial Clearance by the Liver. Nat Mater. 2016;15:1212–1221. doi: 10.1038/nmat4718. [DOI] [PMC free article] [PubMed] [Google Scholar]
- 40.Liu X, Chen Y, Li H, Huang N, Jin Q, Ren K, Ji J. Enhanced Retention and Cellular Uptake of Nanoparticles in Tumors by Controlling Their Aggregation Behavior. ACS Nano. 2013;7:6244–6257. doi: 10.1021/nn402201w. [DOI] [PubMed] [Google Scholar]
- 41.Alvarez R, Musteanu M, Garcia-Garcia E, Lopez-Casas P, Megias D, Guerra C, Muñoz M, Quijano Y, Cubillo A, Rodriguez-Pascual J. Stromal Disrupting Effects of Nab-Paclitaxel in Pancreatic Cancer. Br J Cancer. 2013;109:926–933. doi: 10.1038/bjc.2013.415. [DOI] [PMC free article] [PubMed] [Google Scholar]
- 42.Adiseshaiah PP, Crist RM, Hook SS, McNeil SE. Nanomedicine Strategies to Overcome the Pathophysiological Barriers of Pancreatic Cancer. Nat Rev Clin Oncol. 2016;13:750–765. doi: 10.1038/nrclinonc.2016.119. [DOI] [PubMed] [Google Scholar]
- 43.Josephson L, Tung CH, Moore A, Weissleder R. High-Efficiency Intracellular Magnetic Labeling with Novel Superparamagnetic-Tat Peptide Conjugates. Bioconjug Chem. 1999;10:186–191. doi: 10.1021/bc980125h. [DOI] [PubMed] [Google Scholar]