Abstract
Purpose/Objective(s)
Prophylactic cranial irradiation (PCI) involves giving radiation to the entire brain with the goals of reducing the incidence of brain metastasis and improving overall survival. Experimentally, we demonstrated PCI prevents brain metastases in a breast cancer mouse model. Here we developed a computational model to expand upon and aid interpretation of our experimental results.
Methods and Materials
MATLAB was used to develop a computational model of brain metastasis and PCI in mice. Model input parameters were optimized so that model output would match the experimental number of metastases per mouse from the unirradiated group. An independent in vivo limiting dilution experiment was performed to validate the model. The effect of whole-brain irradiation at different time points after tumor cells were injected was evaluated in terms of incidence, number of metastases, and tumor burden and was then compared with the corresponding experimental data.
Results
In the optimized model, the correlation between number of metastases per mouse and the experimental fits was >95. Our attempt to validate the model with a limiting dilution assay produced 99.9% correlation with respect to incidence of metastases. The model accurately predicted the effect of whole-brain irradiation given 3 weeks after cell injection, but substantially underestimated its effect when delivered 5 days after cell injection. The model further demonstrated that delaying whole-brain irradiation until the development of gross disease introduces a dose threshold that must be reached before a reduction in incidence can be realized.
Conclusions
Our computational model of mouse brain metastasis and PCI correlated strongly with our experiments with unirradiated mice. The results further suggest that early treatment of subclinical disease is more effective than irradiating established.
INTRODUCTION
Patients with brain metastases from breast cancer have very poor outcomes, with only 20%–30% surviving more than 1 year after diagnosis [1,2]. One potential method to improve outcomes for patients at high risk of brain metastasis is prophylactic cranial irradiation (PCI), the goal of which is to eliminate subclinical disease before it can grow into overt metastases; PCI has significantly reduced the incidence of brain metastasis and increased the overall survival for some patients with small cell lung cancer or acute lymphoblastic leukemia [3–8]. Because some subsets of patients with breast cancer are at high risk of developing brain metastases, interest has been expressed in extending PCI to such patients.
We recently developed and characterized novel mouse xenograft models of brain metastasis from a heterogeneous group of breast cancer cell lines (Debeb et al, JNCI in press). Using the HER2-neu-overexpressing brain metastasis mouse model, we investigated if PCI could reduce the incidence of brain metastasis. Our work (unpublished) demonstrated that a single-fraction dose of 4 Gy given 5 days after tail-vein injection of MDA-IBC3 cells led to significant reductions in both the incidence of brain metastasis and the metastatic burden, but the same dose had no observable effect when administered 3–6 weeks after cell injection (Supplementary Fig. S1).
Because the PCI experiment was limited to only a single fraction of 4 Gy given on one of four different days, we sought to expand on our experimental results by evaluating how radiation dose and timing could affect the incidence of brain metastasis in a mouse model. We developed a computational model to describe how disseminated breast tumor cells (DTCs) grow in the mouse brain after intravenous injection and how those DTCs respond to different doses of radiation given at different times; the expected radiation responses at different doses were based on results from our in vitro clonogenic survival assays. We hypothesized that if the benefit of whole-brain irradiation was primarily from direct killing of the tumor cells, then the in vitro input would effectively recapitulate the effects in vivo; conversely, any gap between the model and experimental data would implicate the microenvironment or other in vivo factors not accounted for by the in vitro data.
MATERIALS & METHODS
All computational modeling was done with MATLAB (MathWorks). The model development process is illustrated graphically in Figure 1 and is described more thoroughly in the Supplementary material. Briefly, the number and volume of metastases from the unirradiated mice (from our previous PCI experiment) were fit to distributions, and growth kinetics was modeled. From this, the number of DTCs in the brain after injection, the efficiency with which metastases formed, and the time from injection to proliferation were optimized to match the experimental data. An independent in vivo experiment was done to validate the optimized inputs. Next, combining the input dose and timing of whole-brain irradiation with α and β values from the in vitro clonogenic assays, we used the linear quadratic equation to translate a dose into a survival fraction. Finally, comparisons were made between model predictions and the experimental results.
Fig. 1. Model conceptualization.
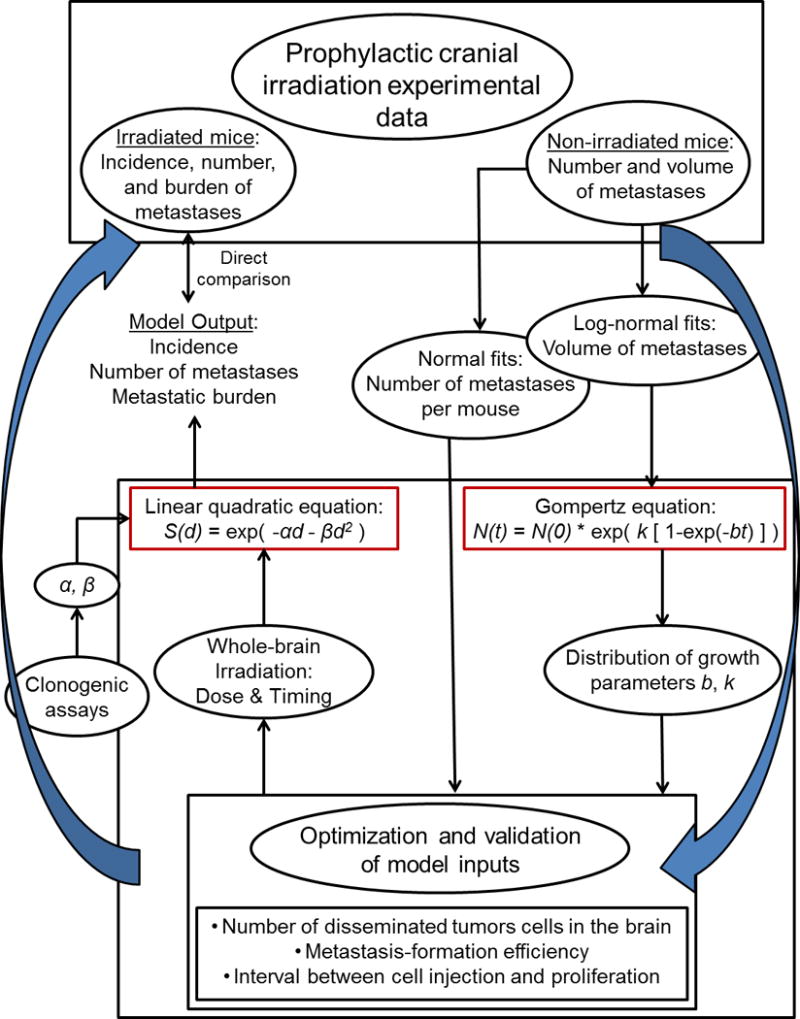
The computational model was developed and optimized with data from the unirradiated control group in a previous experiment of prophylactic cranial irradiation (PCI) in combination with tumor-cell injection. The growth of the metastases was assumed to follow Gompertzian kinetics, and log-normal volume fits were used to generate a distribution of Gompertz parameters b and k. The fits for the number of metastases per mouse were the reference points for the optimization. The linear quadratic formula was used to convert radiation dose into a survival fraction, in which the parameters α and β were determined through clonogenic assays. The model output could then be compared with the irradiated groups in the PCI experiment.
PCI in vivo experiment
Briefly, 3–5-week old female SCID/Beige mice were injected with 5 × 10⁵ HER2-neu-overexpressing MDA-IBC3 cells via tail vein. Mice were either untreated or given whole-brain irradiation 2 days before cells were injected or 5, 21, or 42 days after cells were injected. Mice were sacrificed at either four or eight weeks after cells were injected and the brains were excised; the incidence, number of metastases per mouse, and metastatic burden per mouse in the brain was evaluated on a Nikon AZ100 microscope. The data from the unirradiated mice was used to develop the computational model, and the data from the irradiated mice was directly compared to the model output. All animal experiments were conducted in accordance with approved institutional animal care and use policies.
Conversion of experimental data to probability distributions
In our PCI experiment, we assessed numbers of metastases that had formed at 4 weeks and at 8 weeks after mice had been intravenously injected with MDA-IBC3 cells. Numbers of metastases per mouse were fit to both a Gaussian and a negative binomial distribution for both the 4-week and the 8-week endpoints (Supplementary Fig. S2); these fits were used in the optimization of model inputs. While the negative binomial is often used to describe the distribution of the number of metastases per mouse, a Gaussian was also included.
The volume of metastatic lesions in the previous PCI experiment was estimated from the area and intensity of each metastatic focus on microscopic images; those volumes were fit to log-normal curves (Supplementary Fig. S3) [9,10]. After the volumes were converted into a number of cells (with the cell density assumed to be 109 cells per cm3 [11]), these fits were then used to determine the parameters for Gompertzian growth.
Determination of growth kinetics
The volume doubling time for tumors generally decreases over time, and this growth pattern can be described by using the Gompertz equation [11–13]. Here, we assumed that the brain metastases follow Gompertzian kinetics (as described below and shown in the Supplementary materials, the Gompertz equation is both simple and fits our experimental data well) and grow continuously from the start of proliferation until the 8-week endpoint. The number of cells, N(t), is given as a function of time, t, by the Gompertz equation [11]:
| (1) |
where N(0) represents the initial number of cells, which in the case of our experiment was assumed to be 1; and the parameters b and k define the deceleration of growth and the upper limit of tumor volume. The log-normal volume fits were used to determine possible growth kinetics by selecting random combinations of volumes from the 4- and 8-week endpoints and solving for b & k in a set of two equations:
| (2) |
| (3) |
The cells start proliferating not immediately but rather several days after being injected, as estimated through the optimization process; therefore, t1 and t2 equal less than 4 weeks and less than 8 weeks, respectively. 104 combinations of b & k were calculated (Examples of growth curves are shown in Supplementary Figure S4.).
Optimization of the model in the unirradiated condition
The major input parameters are the number of DTCs in the brain shortly after cell injection, the potential of a DTC to form a metastatic focus, and the interval between cell injection and when the cell begins to proliferate. Each of these input parameters was optimized to yield an output that matched the reference (the Gaussian and negative binomial fits for the number of metastases per mouse at the 4-week and 8-week endpoints).
The execution of the model is described below, and the model output corresponds to the experimental results: incidence of brain metastasis, number of brain metastases per mouse, and brain metastatic burden.
Model validation
The computational model was validated by conducting a limiting dilution in vivo assay and comparing the incidence of brain metastasis between this experiment and the model. The limiting dilution assay conditions were matched to the conditions for the unirradiated mice in the PCI experiment upon which the computational model is based. Briefly, 3-to-5-week-old SCID/Beige mice were injected with different numbers of MDA-IBC3 cells via tail vein (5 × 10², 5 × 10³, 5 × 10⁴, 2.5 × 10⁵, or 5 × 10⁵ cells). Eight weeks later, the mice were killed and the brains excised and evaluated for the presence of green fluorescent protein-labeled metastases with a Nikon AZ100 microscope.
The MDA-IBC3 cells were generated as described elsewhere [14]. Briefly, MDA-IBC3 cells were cultured in Ham’s F-12 medium supplemented with 10% fetal bovine serum, 1 μg/mL hydrocortisone, 5 μg/mL insulin, and 1% antibiotic-antimycotic and maintained in humidified conditions with 5% CO2 at 37°C.
In vitro clonogenic assays
To derive α and β values in the linear quadratic equation for input into the computational model, we assessed clonogenic survival of MDA-IBC3 cells in monolayer cultures as follows: Cells were seeded in six-well plates and irradiated at different doses (250 cells at 0 Gy, 500 cells at 2 Gy, 1000 cells at 4 Gy, 3000 cells at 6 Gy) at 3–4 hours after plating; cell cultures were then grown for 3 weeks before being stained with crystal violet. Each dose condition and experiment was run in triplicate (n=9). Colonies were counted by using a GelCount colony counter (Oxford Optronix, Oxford, UK). The best fit of the data to a linear quadratic curve was determined with MATLAB. MDA-IBC3 cells were also grown and irradiated under mammosphere conditions (Supplementary materials), but we selected α and β values from the monolayer assays because of their more accurate reflection of the radiation response of gross disease.
Modeling of whole-brain irradiation
To assess the effect of the whole-brain irradiation, the input radiation dose, d (Gy), was converted into a surviving fraction of cells, S(d), with the linear quadratic equation:
| (4) |
The values of α and β were extracted from the clonogenic assays. Radiation was assumed to act immediately on the cells, with the survival fraction S(d) becoming the coefficient in front of equation (1) from the day of irradiation until the 8-week endpoint.
In the PCI experiment, irradiated mice had been treated with a single dose of 4 Gy. A total dose (D) and dose per fraction (d) can be converted into an isoeffective dose in 4-Gy fractions (equivalent dose of 4 Gy [EQD4]) by:
| (5) |
Because D and d are the same in the case of single-fraction experiments, rearranging this formula enabled us to calculate the single-fraction dose (the model input dose) for a desired EQD4 [11,15]. Doses reported in this paper are EQD4 (Conversions are supplied in Supplementary Table S1). One hundred simulations of ten mice each were executed for each radiation dose and timing condition.
Model execution
We briefly list the steps involved in the execution of the model that are performed for each simulated mouse:
A number of disseminated tumor cells in the brain is randomly drawn from the input Gaussian distribution (Figure 2C, first row)
For each of those disseminated tumor cells, determine if it will begin to grow into a metastasis (if a randomly drawn number between 0 and 1 is less than the randomly selected value from the input Gaussian distribution [Figure 2C, second row], then that cell will form a metastasis)
For each cell that can form a metastasis, determine when it will begin to grow by randomly drawing from the input Gaussian distribution (Figure 2C, third row)
For each cell that can form a metastasis, determine its growth parameters b and k by randomly drawing a pair from the distributions of b and k that recapitulate the experimental volume data (stored in model)
For each cell that can form a metastasis, record its growth based on the Gompertz equation (equation 1), where t=0 is the time when the cell begins to proliferate, not when the cells are injected
If whole-brain irradiation is applied in the model (user inputs the dose and time of irradiation), the survival fraction (determined by the linear quadratic equation in equation 4, where α and β were determined from the clonogenic assays described above) becomes the coefficient in front of the Gompertz equation (equation 1)
Output the incidence of brain metastasis, the number of brain metastases, and the brain metastatic burden for each mouse at both 28 and 56 days after cell injection (corresponds to the experimental endpoints)
Fig. 2. Model optimization.
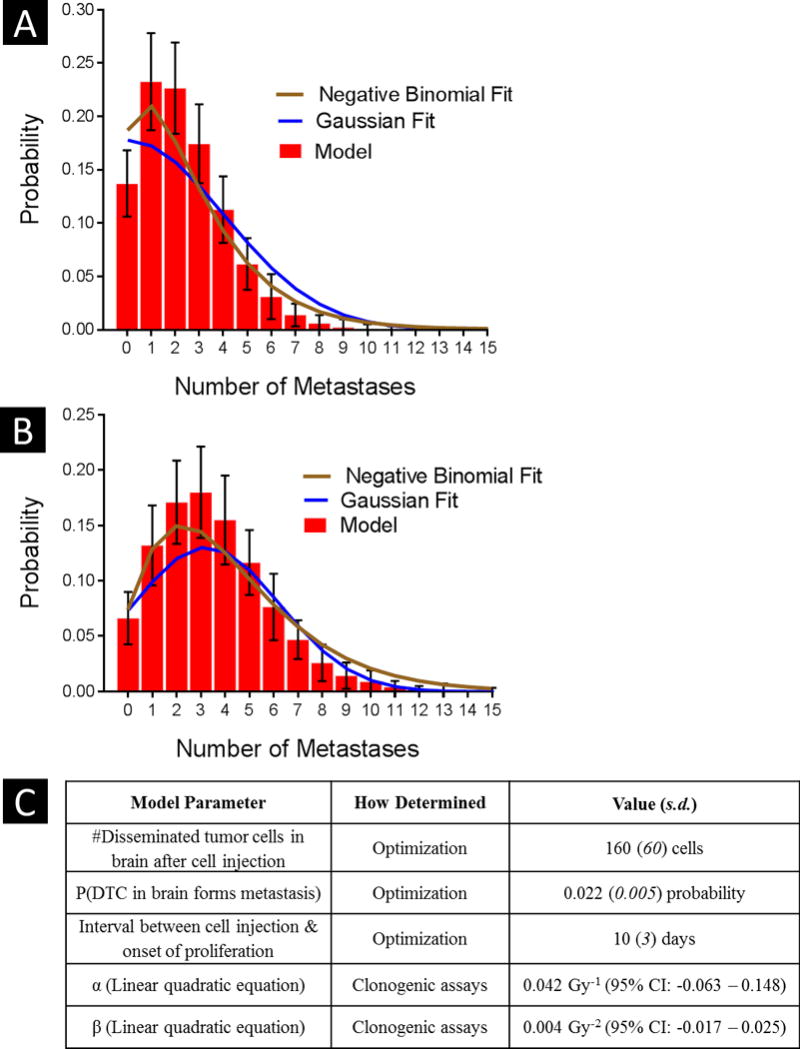
The major input parameters – number of disseminated tumor cells in the brain after cell injection, metastasis-formation efficiency, and interval between cell injection and the start of proliferation – were modified to improve the agreement between the model output and the Gaussian/negative binomial fits of the experimental number of metastases per mouse. After optimization, correlations at the 4 weeks (A) and at 8 weeks (B) were 95% and 98%, respectively for the Gaussian, and 97% and 99%, respectively for the negative binomial. Errors bars indicate standard error of the mean. (C) Input parameters used in the execution of the model are shown with their corresponding values.
RESULTS
The execution of the computational model depends on three major input parameters that were optimized so that the model output matched the Gaussian fits of the experimental data for the number of brain metastases per mouse (Supplementary Fig. S2). The optimized means (standard deviation) were 160 (60) for the number of DTCs in the brain, 0.022 (0.005) for metastasis-formation efficiency, and 10 (3) days for the interval between injection and proliferation (Figure 2C lists the input parameters used in the execution of the model). With the model randomly selecting numbers from these input distributions, the correlation between the experimental fits and the model output was 94.8% at the 4-week endpoint and 97.5% at the 8-week endpoint for the Gaussian fits and 97.0% and 98.8% for the negative binomial fits (Fig. 2).
When the limiting dilution experiment was done to validate the assumptions and input distributions in the model, the correlation between the experimental results and the model predictions was 99.9% (Fig. 3).
Fig. 3. Model validation.
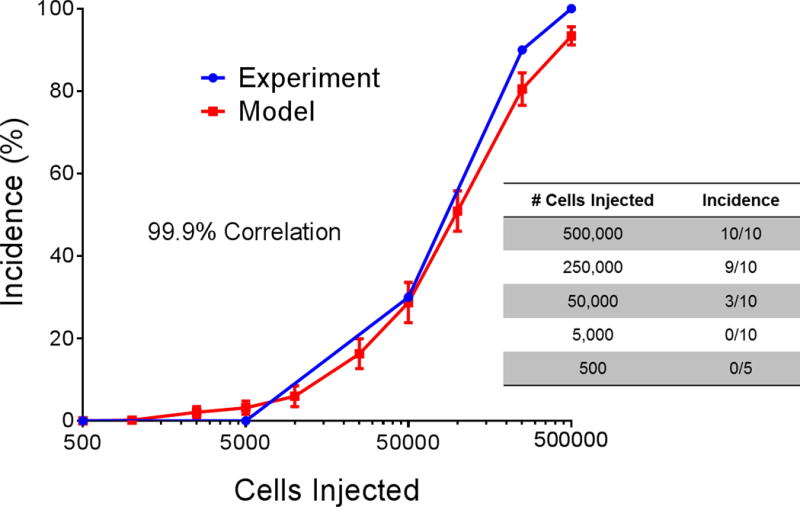
An in vivo limiting dilution assay was conducted that involved tail-vein injection of different concentrations of MDA-IBC3 cells into female SCID/Beige mice. The input of number of disseminated tumor cells in the brain to the computational model was scaled according to the number of cells injected into the mice, and the agreement was approximately 100%. Error bars indicate standard error of the mean.
Clonogenic assays with the MDA-IBC3 cell line were done to determine which α and β values should be used to convert a radiation dose to a survival fraction with the linear quadratic equation (1). In monolayer cultures, α = 0.077 Gy−1 (95% confidence interval [CI] –0.016 – 0.170) and β = 0.042 Gy−2 (95% CI 0.017 – 0.066), where r2 = 0.97 for the fit. The corresponding α/β ratio was 1.85 Gy. The experimental data and the best fit survival curves as a function of dose are depicted in Supplementary Figure S5.
After different combinations of radiation dose and timing of whole-brain irradiation were simulated, the experimental results were directly compared against the model predictions (Fig. 4). When the whole-brain irradiation (4 Gy) was delivered 5 days after tumor-cell injection, the model substantially underestimated the effect of the 4-Gy dose: In the model, the 4-Gy dose reduced the incidence (vs. the unirradiated control) by approximately 25%, whereas the incidence was reduced by roughly 70% in the corresponding experimental group (Fig. 4A). A similar trend was observed for the number of metastases per mouse and the tumor burden. However, no clear difference was found between the model and experimental results when the radiation was delivered at 3 weeks after cell injection (Fig. 4B).
Fig. 4. Model predictions versus experimental results.
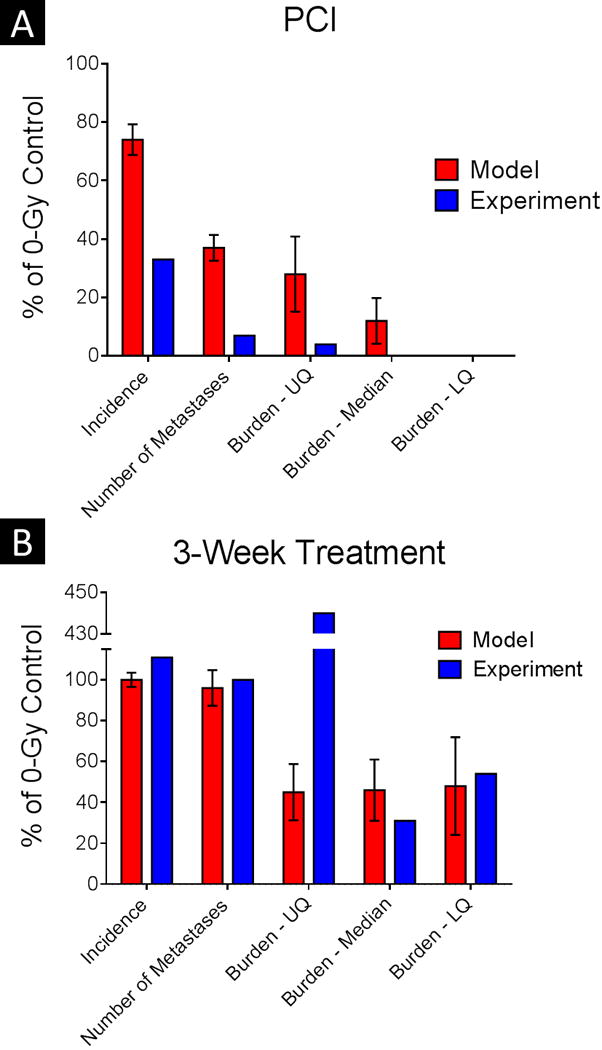
Results of the computational model for 4-Gy whole-brain irradiation are shown with the experimental results when the irradiation was delivered at 5 days after tumor-cell injection (PCI, for prophylactic cranial irradiation) (A) or at 3 weeks after tumor-cell injection (B). Explicit comparisons are made for the incidence of brain metastasis, the average number of metastases per mouse, and the tumor burden per mouse (upper quartile [UQ], median, and lower quartile [LQ]), in each case normalized to the corresponding 0-Gy control. In the PCI condition, the model consistently underestimated the effect of the 4-Gy dose on the experimental endpoints. Error bars indicate standard error of the mean.
The predicted incidence of brain metastasis as a function of whole-brain irradiation dose and timing is shown in Figure 5A. The experimental result of 30% incidence when the irradiation was given 5 days after tumor-cell injection (experimental results are indicated by red circles) is consistent with roughly 10 Gy in the model, a dose that is considerably higher than the 4-Gy experimental dose.
Fig. 5. Effect of radiation timing and dose on incidence of brain metastasis.
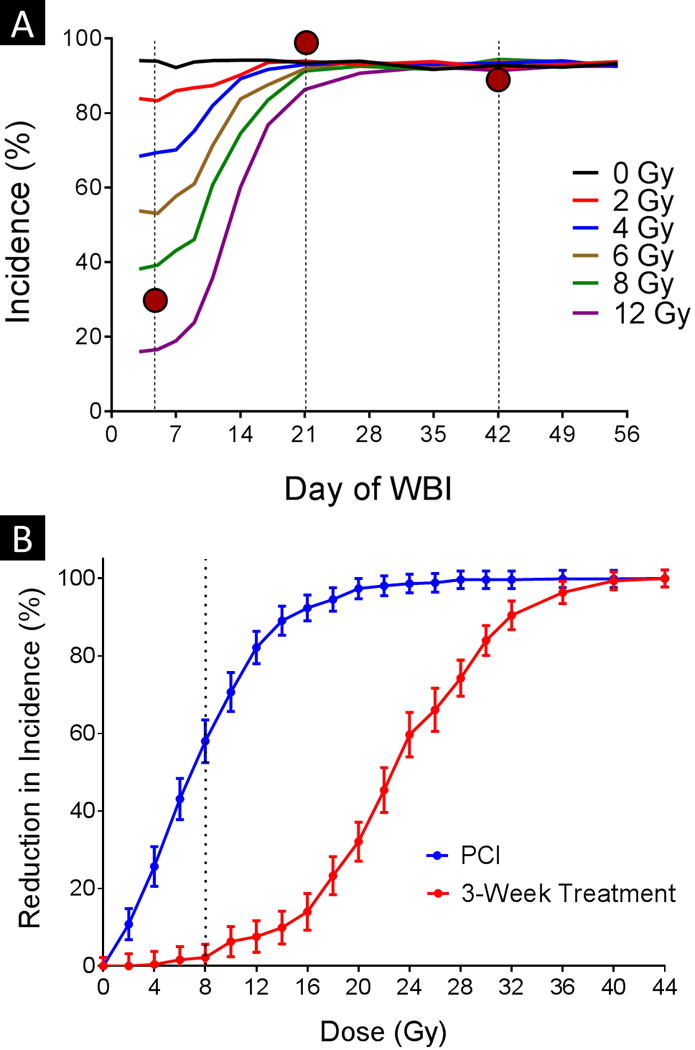
(A) The incidence of brain metastasis was evaluated for different combinations of dose and timing of whole-brain irradiation (WBI) with respect to tumor-cell injection. The vertical dotted lines represent the experimental irradiation time points, and the red circles reference the relevant experimental results. (B) The incidence at different doses was also compared against the incidence of the 0-Gy control when the irradiation was delivered at either 5 days (blue curve, labeled ‘PCI’) or 21 days after tumor-cell injection. The vertical dotted line represents the threshold dose required to see an effect when radiation was given at 21 days after tumor-cell injection. Error bars indicate standard error of the mean.
Figure 5B shows how increasing the dose reduces the incidence of brain metastasis in the model. Although the incidence was reduced immediately when radiation was given at 5 days after cell injection, a threshold dose of approximately 8 Gy (dotted line) was evident when the irradiation was delayed until 3 weeks after cell injection.
The model predictions for metastatic burden are depicted in Figure 6. As was true for incidence, the experimental data point (red circles) for irradiation at 5 days after cell injection was consistent with a higher dose input to the model than the 4 Gy used in the experiment. When treatment is delayed for more than 3 weeks after cell injection, the burden reflects only radiation dose; the timing has little effect for the dose range shown.
Fig. 6. Effect of timing and radiation dose on tumor burden.
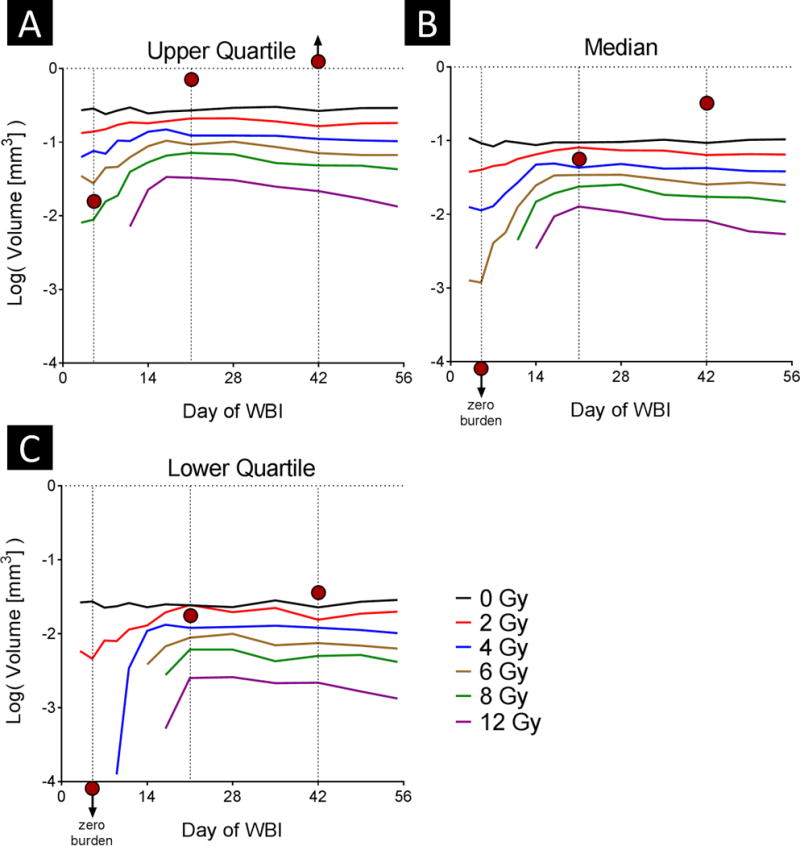
The tumor burden per mouse was evaluated for different combinations of radiation dose and timing of whole-brain irradiation (WBI) with respect to tumor-cell injection. Results shown as the upper quartile (A), median (B), and lower quartile (C) burden. The vertical dotted lines represent the experimental irradiation time points, and the red circles reference the relevant experimental results.
DISCUSSION
With our computational model of subclinical breast cancer radiation dose-response, we showed that we can recapitulate the experimental results observed in the unirradiated control mice in our previous PCI experiment by optimizing and validating the input distributions. By estimating survival fractions based on our clonogenic assays, we demonstrated that the computational model substantially underestimated the effect of the 4-Gy whole-brain irradiation when given at 5 days after cell injection, but was accurate in predicting the effect of the 4-Gy irradiation when given at 3 weeks after cell injection, leading us to speculate that in vivo factors are most relevant in amplifying the effect of radiation when the whole-brain irradiation is delivered early, whereas direct cell kill dictates the outcome of gross disease. We attempted to keep this computational model as simple as possible, and therefore much of the underlying complexity that dictates the outcome of radiation response was not captured by our model and would potentially explain some of the divergence we observe between model output and experimental results for the early whole-brain treatment.
The reduction of incidence-versus-dose curve plotted in Figure 5B has the signature sigmoid shape characteristic of dose-response curves. This curve is also analogous to that published by Suwinski et al. [16] in their meta-analysis of PCI clinical trials of patients small cell lung cancer. In that report, a 20-Gy threshold was noted for “late” PCI versus “early” PCI; in our case, the dose threshold was approximately 8 Gy when comparing irradiation on day 5 with irradiation on day 21. However, the difference is much starker when considering the 15-Gy dose required to reduce the incidence by half (22 Gy at day 21 vs. 7 Gy at day 5). Notably, because the modeling underestimated the effect of the whole-brain irradiation given at 5 days after tumor-cell injection, the difference between the two curves may be understated.
As shown in Figure 5A and Figure 6, beyond a certain point the timing of irradiation had little effect on the incidence of brain metastasis or on the metastatic burden for the dose range shown (0–12 Gy), consistent with the dose threshold effect described above. These results suggest that for subclinical disease, early treatment is critical for reducing incidence and burden. Dose reduction could be considered for subclinical disease (e.g. after stereotactic radiosurgery in patients with few established metastases but at risk for more); in conjunction with other strategies to reduce the toxicity of whole-brain irradiation, this may be a feasible approach to prevent future disease without incurring the risks of whole-brain irradiation [17,18].
A major limitation of this computational model, and the animal model on which it is based, is the inclusion of only single cells as the starting point for metastases to form. This may not accurately reflect the clinical situation, as some evidence suggests that clumps of DTCs give rise to approximately of half of all metastases [19–21]. Had clumps been included in the computational model, the dose required for tumor control would be higher than what was measured under the current conditions, because more cells would need to be eradicated. A list of the assumptions made for this model is provided in the Supplementary Methods.
One pragmatic application of the model is in estimating the sample size required to see a significant effect when the mice, under the same experimental conditions as in the PCI experiment, are treated with radiation plus a radiation sensitizer. If the synergistic effect of the sensitizer has been evaluated through in vitro assays, then a sample size range can be estimated by running a series of simulations. On a related note, this model could also help to inform the period during which the endpoints are most sensitive to a therapeutic or prophylactic agent.
In summary, we used computational modeling to expand upon our experimental results regarding the use of PCI to reduce the incidence of brain metastasis from breast cancer in mice. Our results could provide insight for management strategies for patients with breast cancer at high risk of developing brain metastases.
Supplementary Material
Footnotes
Conflict of interest: none
References
- 1.Eichler AF, Kuter I, Ryan P, et al. Survival in patients with brain metastases from breast cancer: The importance of her-2 status. Cancer. 2008;112:2359–2367. doi: 10.1002/cncr.23468. [DOI] [PubMed] [Google Scholar]
- 2.Lu J, Steeg PS, Price JE, et al. Breast cancer metastasis: Challenges and opportunities. Cancer Research. 2009;69:4951–4953. doi: 10.1158/0008-5472.CAN-09-0099. [DOI] [PubMed] [Google Scholar]
- 3.Aupérin A, Arriagada R, Pignon JP, et al. Prophylactic cranial irradiation for patients with small-cell lung cancer in complete remission. New England Journal of Medicine. 1999;341:476–484. doi: 10.1056/NEJM199908123410703. [DOI] [PubMed] [Google Scholar]
- 4.Slotman B, Faivre-Finn C, Kramer G, et al. Prophylactic cranial irradiation in extensive small-cell lung cancer. New England Journal of Medicine. 2007;357:664–672. doi: 10.1056/NEJMoa071780. [DOI] [PubMed] [Google Scholar]
- 5.Pui CH, Mullighan CG, Evans WE, et al. Pediatric acute lymphoblastic leukemia: Where are we going and how do we get there? Blood. 2012;120:1165–1174. doi: 10.1182/blood-2012-05-378943. [DOI] [PMC free article] [PubMed] [Google Scholar]
- 6.Aur RJA, Hustu HO, Verzosa MS. Comparison of two methods of preventing central nervous system leukemia. Blood. 1973;42:349–357. [PubMed] [Google Scholar]
- 7.Bovi JA, White J. Radiation therapy in the prevention of brain metastases. Current Oncology Reports. 2012;14:55–62. doi: 10.1007/s11912-011-0208-6. [DOI] [PubMed] [Google Scholar]
- 8.Snider JW, Gondi V, Brown PD, et al. Prophylactic cranial irradiation: Recent outcomes and innovations. CNS oncology. 2014;3:219–230. doi: 10.2217/cns.14.22. [DOI] [PMC free article] [PubMed] [Google Scholar]
- 9.Douglas JR. Significance of the size distribution of bloodborne metastases. Cancer. 1971;27:379–390. doi: 10.1002/1097-0142(197102)27:2<379::aid-cncr2820270222>3.0.co;2-z. [DOI] [PubMed] [Google Scholar]
- 10.Kendal WS. The size distribution of human hematogenous metastases. Journal of Theoretical Biology. 2001;211:29–38. doi: 10.1006/jtbi.2001.2326. [DOI] [PubMed] [Google Scholar]
- 11.Joiner M, van der Kogel A. Basic clinical radiobiology. Hodder Arnold; 2009. [Google Scholar]
- 12.Norton L. A gompertzian model of human breast cancer growth. Cancer Research. 1988;48:7067–7071. [PubMed] [Google Scholar]
- 13.Steel GG. Growth kinetics of tumours. Clarendon Press; 1977. [Google Scholar]
- 14.Klopp AH, Lacerda L, Gupta A, et al. Mesenchymal stem cells promote mammosphere formation and decrease e-cadherin in normal and malignant breast cells. PLoS ONE. 2010;5 doi: 10.1371/journal.pone.0012180. [DOI] [PMC free article] [PubMed] [Google Scholar]
- 15.Withers HR, Thames HD, Jr, Peters LJ. A new isoeffect curve for change in dose per fraction. Radiotherapy and Oncology. 1983;1:187–191. doi: 10.1016/s0167-8140(83)80021-8. [DOI] [PubMed] [Google Scholar]
- 16.Suwinski R, Lee SP, Withers HR. Dose-response relationship for prophylactic cranial irradiation in small cell lung cancer. International Journal of Radiation Oncology Biology Physics. 1998;40:797–806. doi: 10.1016/s0360-3016(97)00856-0. [DOI] [PubMed] [Google Scholar]
- 17.Gondi V, Pugh SL, Tome WA, et al. Preservation of memory with conformal avoidance of the hippocampal neural stem-cell compartment during whole-brain radiotherapy for brain metastases (rtog 0933): A phase ii multi-institutional trial. Journal of Clinical Oncology. 2014;32:3810–3816. doi: 10.1200/JCO.2014.57.2909. [DOI] [PMC free article] [PubMed] [Google Scholar]
- 18.Brown PD, Pugh S, Laack NN, et al. Memantine for the prevention of cognitive dysfunction in patients receiving whole-brain radiotherapy: A randomized, double-blind, placebo-controlled trial. Neuro-Oncology. 2013;15:1429–1437. doi: 10.1093/neuonc/not114. [DOI] [PMC free article] [PubMed] [Google Scholar]
- 19.Liotta LA, Kleinerman J, Saidel GM. The significance of hematogenous tumor cell clumps in the metastatic process. Cancer Research. 1976;36:889–894. [PubMed] [Google Scholar]
- 20.Duda DG, Duyverman AMMJ, Kohno M, et al. Malignant cells facilitate lung metastasis by bringing their own soil. Proceedings of the National Academy of Sciences of the United States of America. 2010;107:21677–21682. doi: 10.1073/pnas.1016234107. [DOI] [PMC free article] [PubMed] [Google Scholar]
- 21.Aceto N, Bardia A, Miyamoto DT, et al. Circulating tumor cell clusters are oligoclonal precursors of breast cancer metastasis. Cell. 2014;158:1110–1122. doi: 10.1016/j.cell.2014.07.013. [DOI] [PMC free article] [PubMed] [Google Scholar]
Associated Data
This section collects any data citations, data availability statements, or supplementary materials included in this article.


