

Abstract
Ribonucleotide reductases (RNR) catalyze the reduction of nucleotides to deoxynucleotides through a mechanism involving an essential cysteine based thiyl radical. In the E. coli class 1a RNR the thiyl radical (C439•) is a transient species generated by radical transfer (RT) from a stable diferric-tyrosyl radical cofactor located >35 Å away across the α2:β2 subunit interface. RT is facilitated by sequential proton-coupled electron transfer (PCET) steps along a pathway of redox active amino acids (Y122β ↔ [W48β?] ↔ Y356β ↔ Y731α ↔ Y730α ↔ C439α). The mutant R411A(α) disrupts the H-bonding environment and conformation of Y731, ostensibly breaking the RT pathway in α2. However, the R411A protein retains significant enzymatic activity, suggesting Y731 is conformationally dynamic on the timescale of turnover. Installation of the radical trap 3-amino tyrosine (NH2Y) by amber codon suppression at positions Y731 or Y730 and investigation of the NH2Y• trapped state in the active α2:β2 complex by HYSCORE spectroscopy validate that the perturbed conformation of Y731 in R411A-α2 is dynamic, reforming the H-bond between Y731 and Y730 to allow RT to propagate to Y730. Kinetic studies facilitated by photochemical radical generation reveal that Y731 changes conformation on the ns-μs timescale, significantly faster than the enzymatic kcat. Furthermore, the kinetics of RT across the subunit interface were directly assessed for the first time, demonstrating conformationally dependent RT rates that increase from 0.6 to 1.6 × 10⁴ s−1 when comparing wild type to R411A-α2, respectively. These results illustrate the role of conformational flexibility in modulating RT kinetics by targeting the PCET pathway of radical transport.
Graphical Abstract
INTRODUCTION
Many enzymes catalyze chemical reactions that involve the movement of charge. Electron transfer (ET) between donor-acceptor pairs within the protein milieu has been well described by a tunneling model, for which ET can occur >10 Å at rates that are competitive or exceed the requisite kcat.1,2 While this framework describes most ET reactions well with noted exceptions,3,4 it does not address the coupling of an electron to a proton, as is obligatory for radical transfer (RT). In proton-coupled electron transfer (PCET),5 the wavefunctions of both the electronic and nuclear coordinates mix and accordingly, the very different length scales between proton and electron transfer result in a much greater sensitivity of a PCET pathway to distance as compared to an ET pathway. Proteins are soft materials and exhibit significant degrees of freedom, from global changes in quaternary structure and phonon-like collective motion6 to local amino acid sidechain flexibility. This conformational sampling alters charge transfer distances and whereas modest perturbations on ET rates are imposed relative to those predicted from the static structural models,1 the more sensitive PT rates may be dramatically affected and consequently the thermodynamics and kinetics of PCET may be significantly influenced.7–9 Defining the conformational landscape of redox active groups involved in PCET is therefore essential to understanding function, especially in those enzymes that derive their activity from radicals.
Endogenous amino acid residues within proteins and enzymes are the sites of RT. Due to the correlation between local structure (e.g., H-bonding) and PT, the reactivity of redox active amino acids is expected to be tuned by conformational motions owing to changes in PCET distance and potentially the identity of donor/acceptor sites for PT. Few studies, however, have directly addressed the role of either global or local conformational dynamics on the PCET chemistry of redox active amino acids, particularly with regard to the PT component.
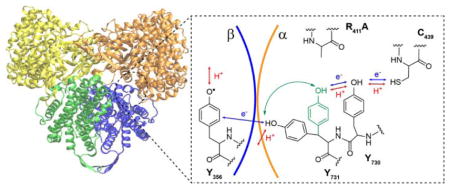
Of the large and growing number of enzymes known to be dependent on redox active amino acids,10–13 ribonucleotide reductase (RNR) is an enzyme that is conformationally dynamic and employs redox active amino acid residues to perform RT and redox catalysis over an exceptionally long distance. RNR catalyzes the conversion of nucleotides (CDP, GDP, UDP, and ADP) to deoxynucleotides, the bottleneck in de novo DNA synthesis in all living organisms.10,14 Nucleotide reduction is regulated at a number of levels including allosteric regulation through effector binding sites which governs both specificity and overall activity. Nucleotide reduction is initiated by H-atom abstraction from a thiyl radical located on a conserved cysteine residue.15 The class 1a RNR of Escherichia coli (E. coli) is proposed to be a heterodimer of homodimers with an α2:β2 structure based on shape complementarity of the composite α2 16 and β2 17 X-ray structures, small angle X-ray scattering (SAXS) and electron microscopy (EM) measurements18 as well as pulsed electron-electron double resonance (PELDOR) spectroscopic studies.19 The active cysteine thiyl radical in α2 (C439• in E. coli numbering scheme) is generated transiently under turnover conditions by a stable diferric-tyrosyl radical cofactor (Y122•) located in the β2 subunit >35 Å away.18,20 Several conserved aromatic amino acid residues are proposed to be involved in RT from Y122β to C439α, as summarized in Figure 1a (Y122β ↔ [W48β]? ↔ Y356β ↔ Y731α ↔ Y730α ↔ C439α).20,21 This radical hopping pathway employs sequential PCET events,7,21–23 and PT and ET are necessarily regulated to maintain RT fidelity, and therefore enzymatic activity.
Figure 1.

Radical transfer (RT) pathway, PCET mechanism and thermodynamic landscape of the E. coli RNR. A | Redox active amino acids involved in RT and presently understood PCET mechanism at each site. Of note are the disordered nature of Y356β, and the R411 sidechain (green) that controls the Y731 conformation. Whereas the tyrosine and cysteine sites of the pathway have been shown to be intimately involved in RT, the participation of W48β remains an open question. B | Proposed thermodynamic landscape as determined by equilibrium measurements. Tyrosine analogues 2,3,6-F3Y (red) and NH2Y (blue) are shown with their relative estimated reduction potentials (pH = 8.2 vs. Y).
The mechanism of PCET that enables RT has been the subject of extensive study.20,22,24,25 Based on the expected distance between the stable Y122• and Y356 in the β subunit,26 as well as the involvement of a water molecule bound to the di-iron cofactor as a proton donor during transient reduction of Y122•,27 an orthogonal PCET mechanism in β has been proposed,21 where PT and ET occur between distinct donor/acceptor pairs.28,29 Conversely, direct hydrogen bonding interactions of Y731, Y730 and C439, revealed by high field electron nuclear double resonance (ENDOR) spectroscopy30,31 has led to the contention that RT within α2 occurs via collinear PCET where protons and electrons are shuttled between adjacent pathway residues.21 At present the mechanism of RT across the α2β2 subunit interface remains unknown. Recent spectroscopic studies indicate no direct H-bond is formed between Y356β and Y731α suggesting orthogonal PCET with alternative proton acceptors.32 Thus, during RT, Y731 may act as a “gating” residue that facilitates a mechanistic switch of PCET, but the origin of this switch and its potential implications remain to be established.
The mechanistic role of Y731 is further complicated by additional studies that suggest the Y731 conformation may be dynamic. In the X-ray structure of the 3-amino tyrosine (NH2Y) substituted Y730NH2Y-α2, significant electron density is observed in an alternative Y731 conformation that differs from the π-π stacked “Y-Y dyad” conformation.33 A similar observation was reported in the structure of the α2 subunit of the class 1b enzyme from Salmonella typhimurium,34 although all structures to date have been solved in the absence of β2. In the E. coli class 1a RNR, the α/β interface is relatively weakly associated and thought to be solvated to some degree32,35 suggesting that some heterogeneity may be possible. In addition, R411 in α2 has been suggested to directly H-bond to Y731 or to order a water molecule(s) that is H-bonded to Y731,31,36 thus stabilizing the π-π stacked conformation of the Y–Y dyad and perturbing the collective dyad reduction potential.37 When A is substituted in place of R411, Y731• does not form an H-bond with Y730 and moves closer to the β subunit across the α:β interface, thereby breaking the cofacial stacking of the Y–Y dyad.36 To reconcile this observation with the current model for RT by PCET, Y731• must then “flip” back to the π-π stacked conformation, reversibly and in a kinetically competent fashion, to accept a proton and electron from Y730 to continue RT.33,36 While the observation of steady state enzymatic activity would suggest as much, direct experimental evidence for such conformational dynamics affecting PCET is lacking. More generally, experimentally addressing both PCET and conformational dynamics is a challenge of significant interest in biophysical studies as static structural models may not represent the dominant PCET active conformations involved in charge transfer.38,39
Probing RT dynamics in RNR are difficult to isolate because (1) the rate determining conformational change required for RT initiation in β40 and timescale of (PC)ET are disparate,41,42 and (2) RT intermediates are only fleetingly populated owing to an uphill thermodynamic landscape (>200 mV, Figure 1b).28,42
We now address the role of Y731 as a critical linchpin in the dynamic conformational gating of the PCET pathway and RT in RNR by employing two complementary methodologies. First, we install the non-native tyrosine analogue 3-amino tyrosine (NH2Y) by amber codon suppression technology at either Y731 or Y730 within the R411A background. This residue acts as a radical trap (E vs. Y < −200 mV,43 Figure 1b), allowing us to monitor H-bonding interactions at the phenoxy radical site directly by hyperfine sublevel correlation (HYSCORE) spectroscopy, thus revealing the conformational changes occurring upon RT. Due to the significant thermodynamic sink imposed by the 3-NH2Y, these mutants are inactive or nearly inactive, but remain useful for examination of pathway radicals. Second, we employ the photoβ2 methodology44,45 in which radicals can be initiated on the RT pathway by photochemical oxidation of pathway Ys. In this methodology, radical generation is gated by a short laser pulse with sufficient time resolution to examine RT kinetics, unmasking RT from slower conformational gating processes. The photoβ2 is furnished by covalently ligating a bromomethylpyridine rhenium tricarbonyl phenanthroline ([Re]) photo-oxidant to β2 via a S355C mutation that is directly adjacent to the RT pathway residue Y356. By following [Re] emission and Y356• decay kinetics via transient optical spectroscopy, we establish a lower bound for the rate of conformational dynamics and directly assess the rate constants for radical injection from Y356β• to Y731α. Our results demonstrate a direct link between conformational dynamics and PCET kinetics in RNR, resulting from the structural sensitivity of PCET to its strong dependence on distance and local protein environment. Dynamics such as those reported herein may not be apparent from equilibrium measurements, but are likely critical in many other enzymes that utilize amino acids that participate in PCET.
Results
NH2Y labelled α2 proteins were produced by amber codon suppression methods.46 Photoβ2s were produced as described previously41,45 and installation of 2,3,6-F3Y at position 356 was accomplished by amber codon suppression as described previously.35 Detailed methods are provided in the Materials and Methods section of the SI. With labelled proteins in hand, the following experiments were performed where the R411A-α2 proteins are compared to the otherwise “native” α2 proteins without the R411A mutation. For the sake of clarity, we refer to the double mutant protein constructs containing the R411A mutation with a prime (i.e. Y731F vs. Y731F′ (Y731F with R411A mutation); Y730NH2Y vs. Y730NH2Y′ (containing the R411A mutation).
Radical Transfer Quantitation
X-band electron paramagnetic resonance (EPR) spectroscopy was performed to quantitate RT from Y122• to the Y731/730NH2Y• radical trap in the presence and absence of the R411A mutation. Mixing of WT-β2 (1.2 Y•/β2) with Y730NH2Y-α2, CDP (substrate) and ATP (allosteric effector) followed by freeze quenching in liquid N2 by hand after 10 seconds resulted in 48% conversion of Y122• signal to Y730NH2Y•, as determined by subtraction of the Y730NH2Y• spectrum from the composite spectrum (52% Y122•) and double integration of each component (Figure S1), similar to previous reports.46,47 These values represent nearly stoichiometric RT (excluding 5–10% total spin loss determined from small scale EPR quantitation similarly as previously described47) as the active α2:β2 complex exhibits “half-site reactivity” (Figure S1 schematic), where only one of the two Y122• of each β2 is translocated onto the RT pathway at a time.19,48,49 The X-band EPR experiment was repeated for Y730NH2Y′-α2, Y731NH2Y-α2 and Y731NH2Y′-α2; significant RT to the NH2Y trap site (>25% spin transfer) and minimal spin loss (Figure S2) was observed for all experiments.
Hydrogen Bond Environment of Radical Trap
HYSCORE spectroscopy (Figures 2 and S3–S6) of Y731/730NH2Y• trap states was employed to examine the perturbation of the H-bond structure of the radical by the R411A mutation. ENDOR spectra for Y731NH2Y•, Y730NH2Y• and Y731NH2Y•′ have been previously recorded31,36 and the corresponding HYSCORE spectra in Figures 2A, 2B and 2C, respectively, are consonant with these ENDOR results. The ENDOR data, in conjunction with DFT modelling, revealed the number of H-bonds at each respective NH2Y site and the associated hyperfine coupling (HFC) constants consistent with the collinear PCET pathway of α2. The HYSCORE method provides a direct experimental measure of the Ax HFC by linear extrapolation without requiring DFT modelling. Additionally, the HYSCORE data provide an enhanced resolution of the electron-nuclear interactions of NH2Y• with its H-bonds by spreading the spectrum out into 2D. The HYSCORE spectrum shown in Figure 2D reveals the NH2Y environment of Y730NH2Y′, which has not been measured by ENDOR; we include the HYSCORE results for Figures 2A–2C for completeness and for comparison to 2D.
Figure 2.

X-band 1H HYSCORE spectra of radical trapped Y73xNH2Y-α2s generated by mixing with WT-β2, CDP and ATP. A | HYSCORE spectrum of Y731NH2Y•-α2. B | HYSCORE spectrum of Y731NH2Y•′-α2. Expanded view of dashed region in panel A. Red arrow indicates H-bond assigned to Y730. Dashed region highlighted for comparison. C | HYSCORE spectrum of Y730NH2Y•-α2. Schematic representation of NH2Y731• based on HYSCORE data. Unresolved H-bonds due to either water or R411 are depicted in the scheme (brown, ref. 19). D | HYSCORE spectrum of Y730NH2Y′•-α2. Dashed regions in panel (i) are expanded in panel ii. Arrows in panel ii indicate H-bonds depicted in the schemes of panel iii. Dashed circle in panels Aii and Bii indicate a lost H-bond between Y731NH2Y• and the phenolic hydroxide of Y730 from Y731NH2Y• to Y731NH2Y′•.
Figures 2Ai and 2Bi (see panel ii for expanded view of dashed region of panel i) show the 1H HYSCORE measurements on Y731NH2Y• and Y731NH2Y′•. The disappearance of the cross-ridge feature (red dashed elliptical region) in Figure 2Bii indicates the loss of an H-bond with Y730 in the R411A variant. The HFC constants determined from an analysis of the HYSCORE spectra in Figure 2Ai via linear regression in squared-frequency units (Figures S3–S6) give AX = 10.4 MHz and AY/Z = −8.3 MHz, which are in excellent agreement with the previously reported 2H ENDOR parameters for the H-bond from the Y730 hydroxyl (10.0 MHz and −8.5 MHz, respectively, after correcting for the gyromagnetic ratio of 1H/2H = 6.51).31 2H ENDOR also demonstrated the loss of this H-bond in the Y731NH2Y′• trapped state, reproduced in Figure 2B (see Fig. 2Aiii and 2Biii for schematic representation). The similarity of the results between HYSCORE and ENDOR experiments reinforce the HYSCORE method as a complementary tool for examining the H-bonding environment of NH2Y radical trapped species.
The HYSCORE spectrum of Y730NH2Y• shown in Figure 2C reveals four distinct H-bonding interactions (Table S1): the 3-amino protons analogous to the Y731NH2Y (black arrow), the hydroxyl group of Y731 (red arrow, HFC: AX = 5.4 MHz and AY/Z = −7.8 MHz), the thiol of C439 (green arrow, HFC: AX = 1.4 MHz and AY/Z = −7.0 MHz), and a weaker hydrogen bond previously assigned to water (blue arrow, HFC: AX = 3.5 MHz and AY/Z = −2.3 MHz). These HFCs again agree well with the values reported by 2H ENDOR (Y731–OH: AX = 4.6 MHz and AY/Z = −7.8 MHz, C439–SH: AX = 3.9 MHz and AY/Z = −6.7 MHz, and H2O: AX = 2.7 MHz and AY/Z = −1.4 MHz). In contrast to the previously published ENDOR data, all four H-bonds are clearly resolved without the need for modelling. The fact that the experimentally determined HFCs match well with the reported ENDOR results further validates those prior studies and the DFT model. Interestingly, the spectrum of Y730NH2Y′• in Figure 2C is essentially identical to that of Figure 2D, with nearly identical HFC parameters (Table S1). These data suggest that radical propagation to Y730 is associated with conformational changes in Y731 in R411A-α2, which re-establish the H-bonding interaction within the Y–Y dyad.
Radical Transfer Measurements
To examine the effect of the R411A mutation on Y122• reduction and NH2Y• formation, we performed stopped flow UV-vis absorption, following mixing of Y730NH2Y(′) with WT-β2. Figure 3 shows the UV-vis traces of the stopped flow experiments where Y730NH2Y and Y730NH2Y′ labelled α2 are mixed with WT-β2 in the presence of CDP and ATP. The optical signature of NH2Y• (λmax = 320 nm) is distinct from native (Y122•) or adventitiously generated Y radical (λmax = 410 nm).36,46 In the stopped flow experiments, mixing of Y730NH2Y-α2 or Y730NH2Y′-α2 resulted in biphasic transfer of the radical species from Y122(β) to Y730NH2Y(α) with rate constants analogous to previous measurements.33,36 Fits of the data for Y730NH2Y• formation in Y730NH2Y-α2 furnished apparent rate constants of 7.4(5) and 0.63(6) s−1, representing 66% and 34% of the amplitude change respectively. The fast phase is similar to the overall steady state activity of 3–8 s−1 for WT-α2 and to prior measurements for this rate constant.33,50 The apparent rate constants for Y730NH2Y′• formation were quite similar to the single mutant at 6.2(7) and 0.30(2) s−1. In contrast to the single mutant Y730NH2Y, the relative amplitudes of the two phases were 46% and 54%, respectively, for Y730NH2Y′. The origin of biphasic RT kinetics is at present unclear, and therefore the difference in the relative amplitude of the two kinetic phases is not immediately obvious. Both the rate and relative amplitude of the Y730NH2Y• formation in the presence or absence of the R411A mutation are recapitulated in the Y122• decay kinetics of proteins (Figure 3, data summarized in the Tables S2).
Figure 3.

Stopped flow UV-vis kinetics of: formation of NH2Y• (λdet = 320 nm) in Y730NH2Y (
 ) and Y730NH2Y′-α2 (
 ) mixed WT-β2; and decay of Y122• (λdet = 410 nm) in Y730NH2Y (
 ) and Y730NH2Y′-α2 (
 ) mixed WT-β2. Formation and decay kinetics are described by a biexponential fit (
 ). Inset shows expanded view of early time fits (shaded gray region). A 10 μM solution (6 mM ATP in assay buffer) of the α2 variants were mixed with a 10 μM solution (2 mM CDP in assay buffer) of WT-β2. Data is the average of at least three experimental runs.
Radical Transfer Measurements Probed by Photoβ2s
Photoβ2 allows for the “instantaneous” generation of radicals on the PCET pathway of RNR.44,45 Photoinitiated generation of Y• allows the RT kinetics to be obtained for the different assumed conformations of Y731. In this photoβ2, the [Re] chromophore is covalently ligated to a modified β2 containing a S → C mutation at position 355 via a methylpyridinyl linker (SI Materials and Methods), directly adjacent to the RT pathway residue Y356. Here, absorption of a photon by the [Re] unit excites a metal-to-ligand charge transfer transition. The excited state can directly act as an oxidant (excited state reduction potential of 1.97 V) of the adjacent Y356. Electron transfer from Y356 to the [Re*] can be monitored by excited state emission of the [Re*] (either by emission intensity or by excited state lifetime) with the judicious choice of a reference. To this end, we employ a Y356F substitution, which is redox inert, and offers a kinetic reference to interpret the subsequent emission quenching kinetics. By this methodology we have demonstrated that the [Re*] of the photoβ2 in complex with α2 is selective for Y356 oxidation relative to Y731 in WT α2, as evidenced by the indistinguishable [Re*] decay kinetics. Given our HYSCORE data and the previously published PELDOR data, Y731 may become susceptible to oxidation by the [Re*] excited state. Thus, the photoβ2 system may be employed for oxidation of the adjacent Y356(β) or direct Y731(α) oxidation with utilization of Y356F-photoβ2, both of which are constituents of the native PCET pathway.
Figure 4 compares the fluorescence spectrum of Y356Fphotoβ2 in the presence of WT (blue dashed line) and Y731F-α2 (blue solid line). The slight decay in the fluorescence intensity from Y731F to WT-α2 suggests Y731 oxidation is inefficient. Conversely, in the presence of R411A-α2 (green dashed line), Y356F-photoβ2 exhibits a dramatic decrease in emission intensity relative to Y731F′-α2:photoβ2 complex (green solid line), indicating significant Y731 oxidation relative to the WT system.
Figure 4.

Emission spectra (λexc = 355 nm) of Y356F-photoβ2 in the presence of WT (blue) or R411A-α2 (green) with an intact (dotted lines) or blocked (Y731F or Y731F′, solid lines) RT pathway.
Emission lifetime measurements (Figure S7 and Table 1) recapitulate the results of steady state emission measurements. Measurement of photoβ2 in the presence of Y731F-α2 provides the reference point for emission decay (defined by rate constant k0) of the [Re] excited state ([Re*]), in the absence of on-pathway RT. [Re*] emission lifetimes in the presence of WT and Y731F-α2 are statistically identical, suggesting no radical injection directly into α2. For the R411A mutants, Y356Fphotoβ2 in the presence of Y731F′ again provides the k0 reference for RT involving proteins with the R411A mutation. The rate constant for RT (kPCET) is obtained from the following expression,
Table 1.
[Re*] emission decay rates and PCET kinetics for Y356Fphotoβ2 in complex with various α2 mutants.
| α2 | τobs/ns | κPCET/105 s−1 |
|---|---|---|
| Y731F | 727 (10) | τ0 |
| WT | 714 (13) | 0.3 (3) |
|
| ||
| Y731F′ | 1,100 (7) | τ0 |
| Y730F′ | 648 (20) | 6.3 (5) |
| C439S′ | 629 (6) | 6.8 (2) |
| R411A | 594 (16) | 7.7 (5) |
| (1) |
where kobs is the decay rate constant of [Re*] in which a portion of the RT pathway is intact. Rapid RT injection (kPCET = 7.7 × 10⁵ s−1) from [Re*] to Y731 is observed in the R411A variant. Furthermore, when pathway blocks Y730F′ and C439S′ were compared to Y731F′ and R411A, a systematic increase in kPCET from Y730F′ to R411A (Figures S8 and S9 and Table 1) is observed. The increase in the quenching rate constant as the pathway is extended suggests that the radical generated on Y731 is in rapid equilibrium along the RT pathway on the timescale of the [Re*] lifetime. That the radical is delocalized along a pathway under rapid conformational dynamics is supported by the observation of clear dCDP production over the background when the Y356F-photoβ2 was illuminated in the presence of CDP, ATP and R411A-α2 (α2 with only R411A single point mutation) but not Y731F′ (Figure S10).
The F-block at Y356 shows that [Re*] bypasses the natural PCET pathway by direct oxidation of Y731 in α2. To investigate the role of R411 in modulating RT across the subunit interface along an intact pathway, emission lifetime measurements were repeated by utilizing 2,3,6-F3Y356-photoβ2 (Figure 1B). 2,3,6-F3Y356-photoβ2 was used as a proxy for Y356-photoβ2 because it offers the distinct advantages of: (1) being more efficiently oxidized photochemically since it remains deprotonated under the experimental conditions (pKa = 7);35 (2) being a stronger oxidant (by 180 mV with respect to Y at pH 8.2,51) resulting in higher efficiency radical injection into α2; and, (3) displaying a significantly shifted phenoxy radical absorption peak, which can be probed selectively within the native tyrosine background (vida infra) while minimally perturbing the protein structure.51–53 [Re]* lifetime measurements were performed for 2,3,6-F3Y356-photoβ2 in the presence of Y731F, WT, Y731F′, Y730F′, C439S′ and R411A-α2 and the results for which are displayed in Figure S11 together with the lifetimes summarized in Table S3. Clear emission quenching is observed when comparing Y731F or R411A:Y731F to WT or R411A, respectively, but the results indicate that the delocalization occurs from the 2,3,6-F3Y• across the α2:β2 protein interface. Taken together with the Y356F-photoβ2 emission lifetime measurements, these data demonstrate that radical equilibration occurs among the Y356β-Y731α-Y730α RT pathway against the R411A background on a timescale which competes with [Re*] radiative decay. Abstracting direct information about the kinetics of RT event across the α2:β2 subunit interface is not possible with this data alone due to the kinetic complexity of the coupled processes, namely radical equilibration, quenching and substrate activation.
Transient Absorption Kinetics of RT
To address the role of the Y731 conformational landscape on RT across the α2:β2 subunit interface, transient absorption (TA) experiments were performed to examine directly the photo-generated 2,3,6-F3Y356• and its subsequent decay kinetics. As noted above, 2,3,6-F3Y• tyrosyl radical spectrum is red shifted ~10 nm from that observed from Y• (Figure S12) allowing the kinetics of 2,3,6-F3Y356 to be monitored independently from on and/or off pathway Y• species. Because charge recombination with the oxidized [ReII] photosensitizer precludes build-up of an observable transient signal, we employed oxidative quenching (flash-quenching) by addition of RuIII(NH3)6 to extend the lifetime of the [ReII] oxidant and prevent back ET.44 Transient absorption (TA) spectra recorded 1 μs after excitation of 2,3,6-F3Y• alone and in the presence of WT, R411A-α2 and Y731F′-α2 are shown in Figure S13. In all cases, a 2,3,6-F3Y• spectrum is observed, corresponding to 4% quantum yield. Comparison of 2,3,6-F3Y• spectra from free 2,3,6-F3Y356 photoβ2 and in complex with the various α2 reveals a shift in the absorption spectrum of the radical, consistent with the emission spectrum of [Re] and anticipated electrostatic perturbations, where solvent exclusion by complexation with α2 as well as elimination of charge in the R411A mutants result in blue shifts of the 2,3,6-F3Y• resonance (Figure S13). Clear interpretation of the TA spectra to discern the kinetics for RT across the α2:β2 interface are precluded by the complexity of the RT process, which stems from the nearly isopotential and reversible RT pathway within α2 (see SI). The use of NH2Y as a radical sink that greatly simplifies the kinetic description of the system, affording direct quantitation of kPCET across the subunit interface (vide infra).
The TA kinetics of the 2,3,6-F3Y• were measured in the presence of Y731F-α2 and the lifetime decay of 14.7(7) μs yielded k0 = 6.8(3) × 104 s−1 (Table 2 and Figure S14), which provides a reference for the decay (defined by rate constant k0) of the radical in the absence of on-pathway RT. In the presence of Y730NH2Y-α2, the 2,3,6-F3Y• decays with a lifetime of 13.5(2) μs yielding kobs = 7.4(1) × 104 s−1. Substitution of these two rate constants into eq (1) yields the rate constant for interfacial RT of kPCET = 6(3) × 103 s−1, which is the first measured rate constant for Y–Y radical exchange within a protein environment and across a protein-protein interface. The 2,3,6-F3Y356• decay was also measured for Y731F′ and Y730NH2Y′ (Figure 5), yielding lifetimes of 17.9(6) and 13.9(4) μs corresponding to rate constants of 5.6(2) × 104 s−1 and 7.2(2) × 104 s−1, respectively. Again, solving for kPCET according to eq (1) yields kPCET = 1.6(3) × 104 s−1, which is modestly faster than the WT system and consistent with the R411A mutation facilitating RT across the interface.
Table 2.
Decay kinetics of 2,3,6-F3Y356• measurements from transient absorption.
| α2 | τobs (μs ) | κPCET (104 s−1) |
|---|---|---|
| Y731F | 14.7(7) | k0 |
| Y730NH2Y | 13.5(2) | 0.6 (3) |
|
| ||
| Y731F′ | 17.9(6) | k0 |
| Y730NH2Y′ | 13.9(4) | 1.6 (3) |
Figure 5.

TA kinetic traces for 2,3,6-F3Y356photoβ2 in complex with Y731F′ (red) and Y730NH2Y′ (blue) with 1 mM CDP, 3 mM ATP and 10 mM Ru(NH3)6Cl2 between 1–90 μs after excitation. Mono-exponential fits to the data are displayed in black.
Discussion
The role of conformational dynamics in PT and ET is largely unaddressed, though often essential to describe accurately protein or enzyme function.9,40,54–56 Conformation is particularly pivotal to PCET as PT is acutely sensitive to small changes in donor-acceptor distance, which can be modulated by conformational dynamics. Indeed, the RT pathway of RNR is finely tuned to control PCET. The single point mutation R411A in α2 has been demonstrated to affect the conformation of a critical RT pathway residue, Y731(α), breaking the π-π stacking of the Y731–Y730 dyad, which is required for efficient collinear PCET.36 R411A-α2 maintains nucleotide reductase activity with a specific activity of 470(20) nmol min−1 mg−1 (1.3 s−1), 17% that of WT enzyme.36 The retained enzymatic activity suggests that the conformation of Y731 is dynamic during RT, providing an impetus to address directly the conformational flexibility of Y731 during RT and how conformational flexibility affects PCET kinetics across the α2:β2 protein interface.
The H-bonding environment of trapped NH2Y• radicals has been shown by high field electron spin resonance spectroscopy to report on the structural consequences of conformational perturbations.30,31,36 ENDOR data, in concert with PELDOR measurements have probed the radical environment at positions Y730 and Y731 in the native enzyme,19,30,31 and the perturbed conformation of Y731 in the R411A mutant (Figure 1a).36 The HYSCORE experiments reported here are complementary to ENDOR. In HYSCORE, hydrogen bonds appear as cross-ridges in a 2D correlation pattern resulting from electron-nuclear spin dipolar interactions. Tyrosyl radicals in both photosystem II and bovine liver catalase have been probed successfully by HYSCORE demonstrating that this technique is well suited to examine NH2Y• trap states in RNR.57
The HYSCORE spectrum of Y731NH2Y• shown in Figure 2A reproduces the ENDOR observation of an H-bond from Y730 with similar HFCs. The absence of the cross-ridge pattern in the Y731NH2Y′• spectrum shown in Figure 2B (indicated by red ellipse) is consistent with a loss of H-bonding between Y731• and Y730, as has also been observed by ENDOR.36 The PELDOR measurements of the Y731NH2Y•(α)-Y122•(β) distance establish that the loss of this H-bonding is due to a conformational change induced by the R411A mutation in which Y731 “flips-out” to the α2:β2 interface, as shown schematically in Figure 2Biii.36 The flipped-out conformation of Y731 is manifested in the steady-state emission spectra of Figure 4 and lifetimes listed in Table 1. In the flipped-out conformation imposed by the absence of the guanidine moiety of R411, Y731 is more susceptible to photochemical oxidation by proximity to the [Re] unit of the photoβ2. Accordingly [Re*] emission is quenched to a greater extent in R411A.
Whereas the ENDOR spectrum of Y730NH2Y• has been reported, and is reproduced by the HYSCORE results in Figure 2C, the hydrogen-bonding environment of Y730NH2Y′• has not been measured. The striking result for Y730NH2Y• and Y730NH2Y′• (Figure 2D) reported here is that their HYSCORE spectra are essentially identical. These results suggest that π-π stacking of the radical in the Y–Y dyad is reformed when the radical advances to position 730 from 731 and that the H-bond between OH phenol groups flips from Y731←Y730 (Figure 2Aiii) to Y731→Y730 (Figure 2Ciii) and is maintained when the R411A mutation is present (Figure 2Diii). This interconversion of conformations for the forward propagation of the radical is consistent with the π-π stacking enabling collinear PCET and is dynamic in nature as R411A exhibits turnover for nucleotide reduction.
Stopped flow kinetics of Y122• reduction and NH2Y• formation upon mixing WT-β2 and Y730NH2Y or Y730NH2Y′-α2 (Figure 3) show no difference in the rate constants of RT to Y730NH2Y. When juxtaposed against the distinct conformational environments of Y731 observed by HYSCORE, the lack of significant temporal differences in RT from Y122•(β) to Y730NH2Y(α) or Y730NH2Y′ (α) in stopped-flow experiments (Figure 3, Table S2) suggests that the Y731 conformational dynamics are masked on the turnover (millisecond) time scale and therefore the more rapid kinetic method offered by photoβ2 was employed to examine the role of conformational motion directly.
Pathway radicals were generated using photoβ2 implemented in two ways; injecting a radical directly into α2 (with a Y356F-photoβ2 described above), or via radical generation at Y356 of the RT pathway in β2 (with 2,3,6-F3Y356-photoβ2). Whereas, photochemical generation Y356•(β) by the photoβ2 has been examined extensively and occurs on the microsecond timescale,58 the direct generation of Y731•(α) to bypass Y356 has been achieved by the introduction of [Re] at position 356.59
Figure S8–S10 reveals direct radical injection within the Y356F-photoβ2:R411A-α2 complex and that it can support enzyme turnover. Consistent with the steady-state quenching experiments, transient emission decay kinetics measurements (Figure S7 and Table 1) show that the direct generation of a pathway radical from Y356F-photoβ2 only occurs significantly when Y731 assumes a flipped-out conformation. Interestingly, the kPCET rates in Table 1 follow a Dutton scaling relationship1 where [Re*]-Y731 distances can be calculated based on the known ΔG and λ of the reaction in both flipped up and flipped out conformations. The distances calculated from this analysis provide an estimate of the conformational displacement of Y731 following flipping of >2.2 Å (SI), a scalar distance relative to the [Re] unit, which is in accordance with distances obtained from PELDOR measurements and from the two distinct Y731 conformations observed in the Y730NH2Y α2 structure.36 This result suggests that the mechanism of PCET for Y731 at the interface is ET/PT. We also observe that kPCET increases in the series Y730F′ < C439S′ < R411A (Table 1, Figure S9) indicating that the hole delocalizes over the RT pathway. If it were delocalized, we would expect nearest-neighbour quenching with no dependence on where the pathway block is located. Hole delocalization among RT pathway residues beyond the flipped out Y731 on the timescale of the [Re*] lifetime necessitates electronic communication, which further supports rapid dynamics between Y731 in a flipped-out and π-π stacked conformation. Rapid tyrosine sidechain motions (ns-μs) have been observed by NMR and supported by computation.60–62 Thus, although the R411A mutation shifts the equilibrium conformation of Y731 towards the “flipped-out” conformation, rapid thermal conformational sampling allows RT to be propagated through α2, stabilized by the H-bonding interaction with Y730•, to the active site of nucleotide reduction.
Because Y356 is spectrally indistinct from Y731 and Y730, radical injection through position Y356 is facilitated with the use of fluorotyrosines.52 The spectroscopically distinct 2,3,6-F3Y356-photoβ2 as a probe and Y730NH2Y as a radical sink in α2 simplifies the kinetics of RT because a steady-state approximation may be imposed at Y731 according to the following RT equilibrium,
In this equilibrium, the disappearance of 2,3,6-F3Y356• is given by,
| (2) |
Due to the very slow rate, k-2 (endergonic, ΔE > 300 mV, see Figure 1b), and k3 (endergonic, ΔE > 300 mV), relative to the expectedly large k2, the steady-state approximation for d[Y731•]/dt (see SI) reduces Eq (2) to
| (3) |
which is effectively a reformulation of Eq (1), used to determine kPCET. Thus, the rate of F3Y356• decay can be described accurately by considering only k1, and k0, whereupon knowing k0 (determined by measuring d[2,3,6-F3Y356•]/dt in the presence of Y731F or Y731F′-α2) one can solve for k1 directly by measuring d[2,3,6-F3Y356•]/dt in the presence of Y730NH2Y or Y730NH2Y′-α2, a measure of interfacial PCET. Y356 oxidation occurs through an orthogonal PCET mechanism likely involving PT to water at the interface. An analogous mechanism is assumed for Y731 oxidation, and the change in conformation of Y731 may result in different PCET behaviour related to donor-acceptor distance in orthogonal PT and ET components. Our results demonstrate that kPCET from 2,3,6-F3Y356β to Y731α is enhanced in the presence of the “flipped out” conformation engendered by the R411A mutation. Therefore, the conformational flipping in R411A α2 again appears rapid, enhancing RT between Y356β and Y731α. We speculate that the modest rate enhancement afforded by the flipped out conformation is likely due to the increased proximity of the donor acceptor pair relative to WT, analogous to the rate increase of Y731 oxidation observed in the [Re*] quenching experiments. While the R411A mutation enhances the interfacial RT rate, this mutation also destabilizes the α2:β2 protein complex. Since RT is not rate limiting, evolution appears to have favoured increasing binding affinity relative to enhancing RT. That the rate is not significantly slower in the flipped-out conformation also implies that Y731• rapidly changes conformation to funnel the radical towards Y730NH2Y and conformational interconversion is not rate limiting.
Conclusions
Probing conformational dynamics and their effects on charge transfer remains a challenge in the field of biological charge transfer. Conformational control of charge transfer is particularly critical to biological PCET owing to the sensitivity of proton transfer to distance. Photoβ2 constructs, together with advanced spectroscopic biophysical techniques such as HYSCORE, offer a powerful tool to correlate PCET with conformational dynamics in RNR, which is an exemplar of enzymatic activity derived from PCET. Herein, we demonstrate the first observation of radical transport across the α2β2 subunit interface in RNR, and that local conformational dynamics of a tyrosine (Y731 α) sidechain during RT in a mutant construct of the class 1a RNR of E. coli significantly affects the PCET kinetics of this interprotein radical transfer. Dynamics analogous to those demonstrated in this report may affect other biological charge transfer reactions where protein based amino acids function in PT and/or ET by modulating donor-acceptor distances or identities.
Supplementary Material
Acknowledgments
The authors gratefully acknowledge the NIH for funding GM 47274 (DGN) and GM 29595 (JS).
ABBREVIATIONS
- ATP
adenosine triphosphate
- CDP
deoxycytosine diphosphate
- dCDP
deoxycytosine diphosphate
- E. coli
Escherichia coli
- EM
electron microscopy
- ENDOR
electron-nuclear double resonance
- ET
electron transfer
- EPR
electron paramagnetic resonance
- FnY
n-fluoronated tyrosine
- HFC
hyperfine constant
- HYSCORE
hyperfine sublevel correlation
- NH2Y
3-aminotyrosine
- PCET
proton-coupled electron transfer
- PELDOR
pulsed electron double resonance
- PT
proton transfer
- [Re]
rhenium 1,10-phenanthroline tricarbonyl, 3-bromoethylpyridine
- RNR
ribonucleotide reductase
- RT
radical transfer
- SAXS
small angle X-ray scattering
- TA
transient absorption
- WT
wild type
Footnotes
Author Contributions
The manuscript was written through contributions of all authors. All authors have given approval to the final version of the manuscript.
Supporting Information. Materials, methods, calculations of TA kinetics and Dutton ET distance, stopped flow fitting results, EPR spectra of 3-aminotyrosine samples used for HYSCORE, HYSCORE spectra and analysis, time resolved emission traces and fitting results, steady state emission spectra, photochemical turnover experiments, 2,3,6-F3Y356• transient absorption spectrum and kinetics.
References
- 1.Page CC, Moser CC, Chen XX, Dutton LP. Nature. 1999;402:47–52. doi: 10.1038/46972. [DOI] [PubMed] [Google Scholar]
- 2.Winkler JR, Gray HB. Chem Rev. 2014;114:3369–3380. doi: 10.1021/cr4004715. [DOI] [PMC free article] [PubMed] [Google Scholar]
- 3.Beratand DN, Liu C, Migliore A, Polizzi NF, Skourtis SS, Zhang P, Zhang Y. Acc Chem Res. 2015;48:474–481. doi: 10.1021/ar500271d. [DOI] [PMC free article] [PubMed] [Google Scholar]
- 4.Warren JJ, Ener ME, Vlček A, Jr, Winkler JR, Gray HB. Coord Chem Rev. 2012;256:2478–2487. doi: 10.1016/j.ccr.2012.03.032. [DOI] [PMC free article] [PubMed] [Google Scholar]
- 5.Cukier RI, Nocera DG. Annu Rev Phys Chem. 1998;49:337–369. doi: 10.1146/annurev.physchem.49.1.337. [DOI] [PubMed] [Google Scholar]
- 6.Barends TRM, Foucar L, Ardevol A, Nass K, Aquila A, Botha S, Doak RB, Falahati K, Hartmann E, Hilpert M, Heinz M, Hoffman MC, Köfinger J, Koglin JE, Kovacsova G, Liang M, Milathianaki D, Lemke HT, Reinstein J, Roome CM, Shoeman RL, Williams GJ, Burhardt I, Hummer G, Boutet S, Schlichting I. Science. 2015;350:445–450. doi: 10.1126/science.aac5492. [DOI] [PubMed] [Google Scholar]
- 7.Reece SY, Nocera DG. Annu Rev Biochem. 2009;78:673–699. doi: 10.1146/annurev.biochem.78.080207.092132. [DOI] [PMC free article] [PubMed] [Google Scholar]
- 8.Hu S, Sharma SC, Scouras AD, Soudackov AV, Marcus Carr CA, Hammes-Schiffer S, Alber T, Klinman JP. J Am Chem Soc. 2014;136:8157–8160. doi: 10.1021/ja502726s. [DOI] [PMC free article] [PubMed] [Google Scholar]
- 9.Offenbacher AR, Hu S, Poss EM, Carr CAM, Scouras AD, Prigozhin DM, Iavarone AT, Palla A, Alber T, Fraser JS, Klinman JP. ACS Cent Sci. 2017;3:570–579. doi: 10.1021/acscentsci.7b00142. [DOI] [PMC free article] [PubMed] [Google Scholar]
- 10.Stubbe J, van der Donk W. Chem Rev. 1998;98:705–762. doi: 10.1021/cr9400875. [DOI] [PubMed] [Google Scholar]
- 11.Frey PA, Hegeman AD, Reed GH. Chem Rev. 2006;106:3302–3316. doi: 10.1021/cr050292s. [DOI] [PubMed] [Google Scholar]
- 12.Cordes M, Giese B. Chem Soc Rev. 2009;38:892–901. doi: 10.1039/b805743p. [DOI] [PubMed] [Google Scholar]
- 13.Selmer T, Pierik AJ, Heider J. Biol Chem. 2005;386:981–988. doi: 10.1515/BC.2005.114. [DOI] [PubMed] [Google Scholar]
- 14.Jordan A, Reichard P. Annu Rev Biochem. 1998;67:71–98. doi: 10.1146/annurev.biochem.67.1.71. [DOI] [PubMed] [Google Scholar]
- 15.Licht S, Gerfen GJ, Stubbe J. Science. 1996;271:477–481. doi: 10.1126/science.271.5248.477. [DOI] [PubMed] [Google Scholar]
- 16.Uhlin U, Eklund H. Nature. 1994;370:533–539. doi: 10.1038/370533a0. [DOI] [PubMed] [Google Scholar]
- 17.Nordlund P, Sjöberg BM, Eklund H. Nature. 1990;345:593–598. doi: 10.1038/345593a0. [DOI] [PubMed] [Google Scholar]
- 18.Minnihan EC, Ando N, Brignole EJ, Olshansky L, Chittuluru J, Asturias FJ, Drennan CL, Nocera DG, Stubbe J. Proc Natl Acad Sci USA. 2013;110:3835–3840. doi: 10.1073/pnas.1220691110. [DOI] [PMC free article] [PubMed] [Google Scholar]
- 19.Bennati M, Robblee JH, Mugnaini V, Stubbe J, Freed J, Borbat P. J Am Chem Soc. 2005;127:15014–15015. doi: 10.1021/ja054991y. [DOI] [PubMed] [Google Scholar]
- 20.Minnihan EC, Nocera DG, Stubbe J. Acc Chem Res. 2015;46:2524–2535. doi: 10.1021/ar4000407. [DOI] [PMC free article] [PubMed] [Google Scholar]
- 21.Stubbe J, Nocera DG, Yee CS, Chang MCY. Chem Rev. 2003;103:2167–2201. doi: 10.1021/cr020421u. [DOI] [PubMed] [Google Scholar]
- 22.Reece SY, Hodgkiss JM, Stubbe J, Nocera DG. Philos Trans R Soc London, Ser B. 2006;361:1351–1364. doi: 10.1098/rstb.2006.1874. [DOI] [PMC free article] [PubMed] [Google Scholar]
- 23.Reece SY, Nocera DG. In: Quantum Tunneling in Enzyme Catalyzed Reactions. Scrutton N, Allemann R, editors. Royal Society of Chemistry Press; London: 2009. [Google Scholar]
- 24.Beratand DN, Liu C, Migliore A, Polizzi NF, Skourtis SS, Zhang P, Zhang Y. Acc Chem Res. 2015;48:474–481. doi: 10.1021/ar500271d. [DOI] [PMC free article] [PubMed] [Google Scholar]
- 25.Hammes-Schiffer S. Acc Chem Res. 2006;39:93–100. doi: 10.1021/ar040199a. [DOI] [PubMed] [Google Scholar]
- 26.Seyedsayamdost MR, Chan CT, Mugnaini V, Stubbe J, Bennati M. J Am Chem Soc. 2007;129:15748–15749. doi: 10.1021/ja076459b. [DOI] [PubMed] [Google Scholar]
- 27.Wörsdörfer B, Conner DA, Yokoyama K, Livada J, Seyedsayamdost M, Jiang W, Silakov A, Stubbe J, Bollinger JM, Jr, Krebs C. J Am Chem Soc. 2013;135:8585–8593. doi: 10.1021/ja401342s. [DOI] [PMC free article] [PubMed] [Google Scholar]
- 28.Ravichandran KR, Taguchi AT, Wei YF, Tommos C, Nocera DG, Stubbe J. J Am Chem Soc. 2016;138:13706–13716. doi: 10.1021/jacs.6b08200. [DOI] [PMC free article] [PubMed] [Google Scholar]
- 29.Ravichandran K, Minnihan EC, Lin Q, Yokoyama K, Taguchi AT, Shao J, Nocera DG, Stubbe J. Biochemistry. 2017;56:856–868. doi: 10.1021/acs.biochem.6b01145. [DOI] [PMC free article] [PubMed] [Google Scholar]
- 30.Argirević T, Riplinger C, Stubbe J, Neese F, Bennati M. J Am Chem Soc. 2012;134:17661–17670. doi: 10.1021/ja3071682. [DOI] [PMC free article] [PubMed] [Google Scholar]
- 31.Nick TU, Lee W, Koβmann S, Neese F, Stubbe J, Bennati M. J Am Chem Soc. 2015;137:289–298. doi: 10.1021/ja510513z. [DOI] [PMC free article] [PubMed] [Google Scholar]
- 32.Nick TU, Ravichandran KR, Stubbe J, Kasanmascheff M, Bennati M. Biochemistry. 2017;56:3647–3656. doi: 10.1021/acs.biochem.7b00462. [DOI] [PubMed] [Google Scholar]
- 33.Minnihan EC, Seyedsayamdost MR, Uhlin U, Stubbe J. J Am Chem Soc. 2011;133:9430–9440. doi: 10.1021/ja201640n. [DOI] [PMC free article] [PubMed] [Google Scholar]
- 34.Uppsten M, Farnegardh M, Jordan A, Eliasson R, Eklund H, Uhlin U. J Mol Biol. 2003;330:87–97. doi: 10.1016/s0022-2836(03)00538-2. [DOI] [PubMed] [Google Scholar]
- 35.Olshansky L, Stubbe J, Nocera DG. J Am Chem Soc. 2016;138:1196–1205. doi: 10.1021/jacs.5b09259. [DOI] [PMC free article] [PubMed] [Google Scholar]
- 36.Kasanmascheff M, Lee W, Nick TU, Stubbe J, Bennati M. Chem Sci. 2016;7:2170–2178. doi: 10.1039/c5sc03460d. [DOI] [PMC free article] [PubMed] [Google Scholar]
- 37.Koo BJ, Huynh M, Halbach RL, Stubbe J, Nocera DG. J Am Chem Soc. 2015;137:11860–11863. doi: 10.1021/jacs.5b05955. [DOI] [PMC free article] [PubMed] [Google Scholar]
- 38.Migliore A, Polizzi NF, Therien MJ, Beratan DN. Chem Rev. 2014;114:3381–3465. doi: 10.1021/cr4006654. [DOI] [PMC free article] [PubMed] [Google Scholar]
- 39.Reese SY, Nocera DG. Annu Rev Biochem. 2009;78:673–699. doi: 10.1146/annurev.biochem.78.080207.092132. [DOI] [PMC free article] [PubMed] [Google Scholar]
- 40.Ge J, Yu GX, Ator MA, Stubbe J. Biochemistry. 2003;42:10071–10083. doi: 10.1021/bi034374r. [DOI] [PubMed] [Google Scholar]
- 41.Olshansky L, Pizano AA, Wei YF, Stubbe J, Nocera DG. J Am Chem Soc. 2014;136:16210–16216. doi: 10.1021/ja507313w. [DOI] [PMC free article] [PubMed] [Google Scholar]
- 42.Yokoyama K, Uhlin U, Stubbe J. J Am Chem Soc. 2010;132:15368–15379. doi: 10.1021/ja1069344. [DOI] [PMC free article] [PubMed] [Google Scholar]
- 43.DeFelippis MR, Murthy CP, Broitman F, Weinraub D, Faraggi M, Klapper MH. J Phys Chem. 1991;95:3416–3419. [Google Scholar]
- 44.Pizano AA, Lutterman DA, Holder PG, Teets TS, Stubbe J, Nocera DG. Proc Natl Acad Sci USA. 2012;109:39–43. doi: 10.1073/pnas.1115778108. [DOI] [PMC free article] [PubMed] [Google Scholar]
- 45.Pizano AA, Olshansky L, Holder PG, Stubbe J, Nocera DG. J Am Chem Soc. 2012;135:13250–13253. doi: 10.1021/ja405498e. [DOI] [PMC free article] [PubMed] [Google Scholar]
- 46.Seyedsayamdost MR, Xie J, Chan CTY, Schultz PG, Stubbe J. J Am Chem Soc. 2007;129:15060–15071. doi: 10.1021/ja076043y. [DOI] [PubMed] [Google Scholar]
- 47.Minnihan EC, Seyedsayamdost MR, Stubbe J. Biochemistry. 2009;48:12125–12132. doi: 10.1021/bi901439w. [DOI] [PMC free article] [PubMed] [Google Scholar]
- 48.Ravichandran KR, Minnihan EC, Wei Y, Nocera DG, Stubbe J. J Am Chem Soc. 2015;137:14387–14395. doi: 10.1021/jacs.5b09189. [DOI] [PMC free article] [PubMed] [Google Scholar]
- 49.Seyedsayamdost MR, Stubbe J. J Am Chem Soc. 2006;128:2522–2523. doi: 10.1021/ja057776q. [DOI] [PubMed] [Google Scholar]
- 50.Salowe S, Bollinger JM, Jr, Ator M, Stubbe J, McCraken J, Peisach J, Samano MC, Robins MJ. Biochemistry. 1993;32:12749–12760. doi: 10.1021/bi00210a026. [DOI] [PubMed] [Google Scholar]
- 51.Thesis: Olshansky L. PhD. Massachusetts Institute of Technology; Cambridge, MA: Sep, 2015.
- 52.Seyedsayamdost MR, Reese SY, Nocera DG, Stubbe J. J Am Chem Soc. 2006;128:1569–1579. doi: 10.1021/ja055926r. [DOI] [PubMed] [Google Scholar]
- 53.Oyala PH, Ravichandran KR, Funk MA, Stucky PA, Stich TA, Drennan CL, Britt RD, Stubbe J. J Am Chem Soc. 2016;138:7951–7964. doi: 10.1021/jacs.6b03605. [DOI] [PMC free article] [PubMed] [Google Scholar]
- 54.Danyal K, Mayweather D, Dean DR, Seefeldt LC, Hoffman BM. J Am Chem Soc. 2010;132:6894–6895. doi: 10.1021/ja101737f. [DOI] [PMC free article] [PubMed] [Google Scholar]
- 55.Klinman JP, Kohen A. Annu Rev Biochem. 2013;82:471–496. doi: 10.1146/annurev-biochem-051710-133623. [DOI] [PMC free article] [PubMed] [Google Scholar]
- 56.Beratand DN, Liu C, Migliore A, Polizzi NF, Skourtis SS, Zhang P, Zhang Y. Acc Chem Res. 2015;48:474–481. doi: 10.1021/ar500271d. [DOI] [PMC free article] [PubMed] [Google Scholar]
- 57.Deligiannakis Y, Ivancich A, Rutherord AW. Spectrochim Acta A. 2002;58:1191–1200. doi: 10.1016/s1386-1425(01)00709-0. [DOI] [PubMed] [Google Scholar]
- 58.Olshansky L, Greene BL, Finkbeiner C, Stubbe J, Nocera DG. Biochemistry. 2016;55:3234–3240. doi: 10.1021/acs.biochem.6b00292. [DOI] [PMC free article] [PubMed] [Google Scholar]
- 59.Song DY, Pizano AA, Holder PG, Stubbe J, Nocera DG. Chem Sci. 2015;6:4519–4524. doi: 10.1039/c5sc01125f. [DOI] [PMC free article] [PubMed] [Google Scholar]
- 60.Rice DM, Wittebort RJ, Griffin RG, Meirovitch E, Stimson ER, Meinwald YC, Freed JH, Sheraga HA. J Am Chem Soc. 1981;103:7707–7710. [Google Scholar]
- 61.Henzler-Wildman K, Kern D. Nature. 2007;450:964–972. doi: 10.1038/nature06522. [DOI] [PubMed] [Google Scholar]
- 62.McCammon JA, Wolynes PG, Karplus M. Biochemistry. 1979;18:927–942. doi: 10.1021/bi00573a001. [DOI] [PubMed] [Google Scholar]
Associated Data
This section collects any data citations, data availability statements, or supplementary materials included in this article.