Abstract
Purpose
To determine the relationship between hepatic proton density fat fraction (PDFF) and R2* in vivo.
Materials and Methods
In this HIPAA-compliant, IRB-approved, cross-sectional study, we conducted a secondary analysis of 3T MR exams performed as part of prospective research studies in children in whom conditions associated with iron overload were excluded clinically. Each exam included low-flip-angle, multi-echo magnitude (-M) and complex (-C) based chemical-shift-encoded MRI techniques with spectral modeling of fat to generate hepatic PDFF and R2* parametric maps. For each technique and each patient, regions of interest were placed on the maps in each of the nine Couinaud segments, and composite whole-liver PDFF and R2* values were calculated. Pearson’s correlation coefficients between PDFF and R2* were computed for each MRI technique. Correlations were compared using Steiger’s test.
Results
184 children (123 boys, 61 girls) were included in this analysis. PDFF estimated by MRI-M and MRI-C ranged from 1.1 to 35.4% (9.44 ± 8.76) and 2.1 to 38.1% (10.1 ± 8.7), respectively. R2* estimated by MRI-M and MRI-C ranged from 32.6 to 78.7 s−1 (48.4 ± 9.8) and 27.2 to 71.5 s−1 (42.2 ± 8.6), respectively. There were strong and significant correlations between hepatic PDFF and R2* values estimated by MRI-M (r=0.874; p<0.0001) and MRI-C (r=0.853; p< 0.0001). The correlation coefficients (0.874 vs. 0.853) were not significantly different (p=0.15).
Conclusion
Hepatic PDFF and R2* are strongly correlated with each other in vivo. This relationship was observed using two different MRI techniques.
Keywords: PDFF (proton density fat fraction), R2*, Iron overload, Hepatic steatosis, MRI, Children
INTRODUCTION
Proton density fat fraction (PDFF) and R2* measurements are increasingly investigated as non-invasive quantitative imaging biomarkers of hepatic steatosis (1–6) and hepatic iron content (7,8) respectively. To estimate PDFF and R2*, advanced multi-echo chemical-shift-encoded MRI techniques using either magnitude-based data (MRI-M) or complex-based data (MRI-C) have been developed (9–11). To address potential confounders, these techniques simultaneously estimate PDFF and R2* by acquiring multiple echoes to correct for R2* (1/T2*) signal decay, with a low flip angle to minimize T1 weighting, and applying spectral modeling to account for the multi-peak nature of fat (12–16). These techniques have been proposed for simultaneous assessment of fat and iron (16–19).
Both MRI-M and MRI-C fit PDFF and R2* simultaneously but independently, as the signal model implicitly assumes that PDFF and R2* reflect distinct and unrelated physiological processes. Kuhn et al. (14) showed that when multi-peak spectral modeling is applied, liver R2* measurements made by MRI-C are independent of the steatosis grade in adults with mixed chronic liver disease. However, a recent study by Bashir et al. reported a direct correlation between PDFF and R2* measured using MRI-C in human livers in vivo (9). Since the only two published studies in the literature provide discordant results and since both studies included only adults and measured R2* using MRI-C only, there is a need to further investigate the relationship between PDFF and R2*.
The purpose of this study is to determine the relationship between PDFF and R2* estimated by MRI-M and MRI-C in prospective cohort studies of pediatric nonalcoholic fatty liver disease (NAFLD) (20,21). We selected children because they rarely have excess hepatic iron (22,23) and are an ideal population to determine the relationship between PDFF and R2* unconfounded by iron content. A secondary purpose of the study was to evaluate the agreement between MRI-M and MRI-C for estimating R2* values in human subjects, and to validate the high agreement between these techniques reported in prior studies for estimating PDFF (24,25).
MATERIALS AND METHODS
Research design and subjects
This was a single-site, cross-sectional, secondary analysis of data collected in pediatric participants enrolled in prospective cohort studies at our institution, who underwent a research liver MRI exam including both MRI-M and MRI-C at our imaging center between August 2008 and December 2015. We included children who were at risk for NAFLD due to an elevated body mass index; defined as having a BMI percentile ≥ 85th percentile for age and sex (26). We also included children with a history of NAFLD. The diagnosis of NAFLD was not made as part of this study, but was based upon a combination of clinical history, laboratory studies, and if available liver histology as previously described (27). Two children (a 17 year old boy and a 10 year old girl) with prior blood transfusions were excluded, as the transfusions could cause iron overload. No child had any liver disease(s) other than NAFLD. The final study population comprised 184 children with characteristics summarized in Table 1.
Table 1.
Cohort Characteristics
| Sex | n | Age in years Mean ± SD (range) |
BMI in kg/m2 Mean ± SD (range) |
MRI-M PDFF in % Mean ± SD (range) |
MRI-M R2* in s−1 Mean ± SD (range) |
MRI-C PDFF in % Mean ± SD (range) |
MRI-C R2* in s−1 Mean ± SD (range) |
|---|---|---|---|---|---|---|---|
| Boys | 123 | 13.5 ± 2.5 (8–18) | 28.0 ± 6.0 (15.2–51.6) | 10.0 ± 9.2 (1.1–35.43) | 49.2 ± 10.2 (32.60–78.65) | 10.6 ± 9.3 (2.13–38.10) | 43.0 ± 8.7 (27.2–69.63) |
| Girls | 61 | 13.6 ± 2.9 (8–19) | 29.0 ± 7.0 (16.9–49.7) | 8.2 ± 8.1 (1.5–35.35) | 46.7 ± 9.0 (33.2–75.25) | 8.8 ± 7.5 (2.17–36.2) | 40.8 ± 8.1 (29.4–71.5) |
SD, standard deviation; BMI, body mass index.
The study was approved by an Institutional Review Board and was compliant with the Health Insurance Portability and Accountability Act. Children under 18 years signed informed assent, with written informed consent provided by their parent(s)/guardian(s); 18- to 19-year olds signed informed consent. Demographic and anthropometric information was collected for enrolled children.
MR Imaging
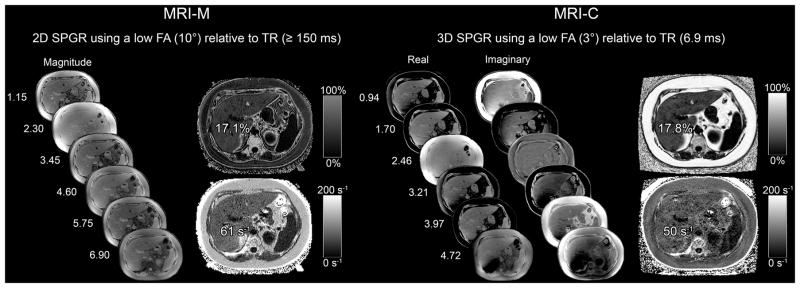
Children were asked to fast for 4 hours before the MRI exam and were scanned at 3T (Signa EXCITE HDxt scanner, GE Medical Systems, Waukesha WI) in a supine position with an eight-channel torso phased-array coil centered over the liver. A dielectric pad was placed between the coil and the abdomen. Each MR exam included chemical-shift-encoded MRI-M and MRI-C techniques as illustrated in Figure 1 and described below. Acquisition parameters are summarized in Table 2. Both techniques assumed exponential R2* signal decay and applied the same multi-peak fat spectral model derived from human liver triglyceride composition (28).
Figure 1.
6-echo 2D-SPGR MRI-M (right) and 6-echo 3D SPGR MRI-C (left) acquisitions in a 17yo male adolescent. Hepatic PDFF and R2* were estimated using real and imaginary data in MRI-C and magnitude data in MRI-M. Co-localized PDFF and R2* values estimated with both MRI-M and MRI-C are overlain; dynamic scale for parametric PDFF map is 0–50% for MRI-M and 0–100% for MRI-C; dynamic scale for parametric R2* map is 0–200 s−1 for both MRI-M and MRI-C.
Table 2.
Parameters for MRI Techniques
| Parameter | Values for MRI-M | Values for MRI-C |
|---|---|---|
| Pulse sequence | 2D SPGR | 3D SPGR |
| Slice thickness (mm) | 8 | 8 |
| Flip angle (degrees) | 10 | 3 |
| Interslice gap (mm) | 0 | Not applicable |
| TE (msec) | 1.1, 2.3, 3.5, 4.6, 5.8, 6.9 | 0.9, 1.7, 2.5, 3.2, 4.0, 4.7 |
| TR (msec) | ≥150 | 6.9 |
| Base image matrix | 224 × 128 | 192 × 160 |
| FOV (cm) | 44 × 44 | 44 × 44 |
| NEX | 1 | 1 |
| R | 1.25 | 2 × 2 |
| Bandwidth (± kHz) | ± 142 | ± 125 |
| Acquisition time (sec) | 2 × 20 a | 20 |
MRI-M and MRI-C, magnitude-based and complex-based magnetic resonance imaging; PGR, spoiled gradient recalled echo; TE, time to echo; TR, repetition time; FOV, field of view; NEX, number of excitations; R, acceleration factor.
Two 20-second breatholds required to cover whole liver.
MRI-M Acquisition and Reconstruction
A two-dimensional multi-echo spoiled gradient-recalled echo (SPGR) sequence was acquired (4) with full-liver coverage in one or two 20- to 40-second breath-holds. To minimize T1 weighting, a low flip angle (10°) was used (29) with ≥150 ms repetition time (TR) (30,31). Six echoes were obtained per TR at serial, nominally out-of-phase and in-phase echo times (TEs). Parallel imaging was applied with an acceleration factor of 1.25 (Parallel imaging type-ASSET) for exams performed after 2011. A fitting algorithm was applied to the source images pixel by pixel by the scanner computer to create parametric PDFF and R2* maps, as explained by Bydder et al and Tang et al (31,32). Due to the fat-water signal dominance ambiguity intrinsic to magnitude fitting, water was assumed to be the dominant signal and the PDFF dynamic range was 0–50%. No correction was made for phase errors, as these are considered negligible with magnitude fitting.
MRI-C Acquisition and Reconstruction
A three-dimensional multi-echo SPGR sequence was acquired with full liver coverage in a single 20-second breath-hold with two-dimensional parallel imaging and an effective net acceleration factor of 2.2 using Auto-calibrating Reconstruction for Cartesian imaging. To minimize T1 weighting, a low flip angle (3°) was used with 6.9 ms TR (33,34). Six echoes were obtained per TR at TEs, as these are appropriate for fat-water separation using complex fitting. Images were reconstructed by the scanner computer using an investigational version of a complex-data based water-fat separation technique known as Iterative Decomposition of water and fat with Echo Asymmetry and Least-squares estimation (IDEAL) (35). As described in Yu et al (16), this algorithm combines the strengths of both complex and magnitude reconstruction techniques in a hybrid approach (16) that corrects for the phase errors (36) that may confound pure complex fitting. The algorithm generates water and fat images, as well as PDFF and R2* maps. Since this technique is capable of distinguishing signals from fat and water, the PDFF dynamic range is 0–100%.
MRI analysis
MRI-M and MRI-C estimation of PDFF and R2*
Source images and the PDFF and R2* parametric maps were transferred offline for analysis (Osirix Foundation, Geneva, Switzerland) by image analysts (each with more than 6 months of training) blinded to clinical data. One circular region of interest (ROI) with a 1-cm radius was manually placed in each of the nine Couinaud liver segments on the fifth-echo image of the MRI-M source images, avoiding major vessels, bile ducts, liver edges and artifacts. The fifth-echo image was used to guide ROI placement because it consistently provided adequate anatomic delineation for this purpose. The nine ROIs from these images were then copied onto the MRI-C water images, with adjustment if needed to avoid major vessels, bile ducts, liver edges and artifacts. The nine ROIs were then copied to the corresponding locations in the PDFF and R2* maps for both techniques (see Figure 1) without additional adjustment. For each subject, composite PDFF and R2* values for each technique were calculated by averaging the individual mean values from the nine ROIs.
STATISTICAL ANALYSIS
All statistical analyses were performed by a staff biostatistician under the supervision of a faculty statistician, both with over 20 years of experience, using R statistical computing software (R version 3.1.2 (2014-10-31) R: A language and environment for statistical computing. R Foundation for Statistical Computing, Vienna, Austria). Cohort characteristics were summarized descriptively (see Table 2). Pearson’s correlation between PDFF and R2* was calculated for MRI-M and MRI-C and compared using Steiger’s test for dependent correlations. Agreement between MRI-M and MRI-C for estimating PDFF and R2* was assessed by Bland-Altman analysis. Bias (the mean difference between MRI-M and MRI-C) and its p-value, standard deviation (SD) of the MRI-M and MRI-C differences, and limits of agreement (LOA) were computed as part of the analysis. All statistical hypothesis testing was performed using a significance level of 0.05.
RESULTS
Cohort characteristics
One hundred and eighty four children (123 boys, 61 girls) met inclusion criteria for the study. PDFF estimated by MRI-M and MRI-C ranged from 1.1 to 35.4% (9.44 ± 8.76) and 2.1 to 38.1% (10.1 ± 8.7), respectively. R2* estimated by MRI-M and MRI-C ranged from 32.6 to 78.7 s−1 (48.4 ± 9.8) and 27.2 to 71.5 s−1 (42.2 ± 8.6), respectively.
Correlation between PDFF and R2*
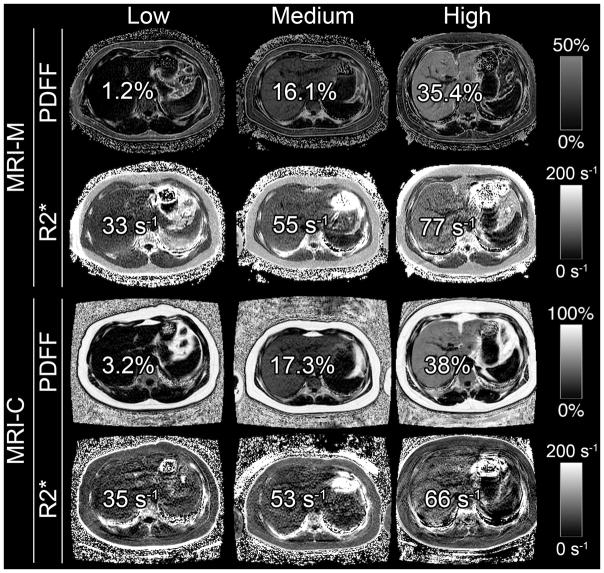
Figure 2 illustrates parametric maps in three representative pediatric participants spanning a spectrum of PDFF and R2* values (low, medium and high). As illustrated in Figure 2 and shown graphically in Figure 3, PDFF correlated with R2* for both techniques (r = 0.874, p < 0.0001 for MRI-M; r = 0.853, p < 0.0001 for MRI-C). The correlation coefficients (0.874 vs. 0.853) were not significantly different (p=0.15).
Figure 2.
Hepatic PDFF and R2* maps of three representative pediatric research participants with low, medium, and high PDFF and R2* values (values overlain) on MRI-M and MRI-C. PDFF and R2* were estimated in co-localized regions of interest. These images illustrate the relationship between hepatic PDFF and R2*. Dynamic scale for parametric PDFF map is 0–50% for MRI-M and 0–100% for MRI-C; dynamic scale for parametric R2* map is 0–200 s−1 for both MRI-M and MRI-C.
Figure 3.
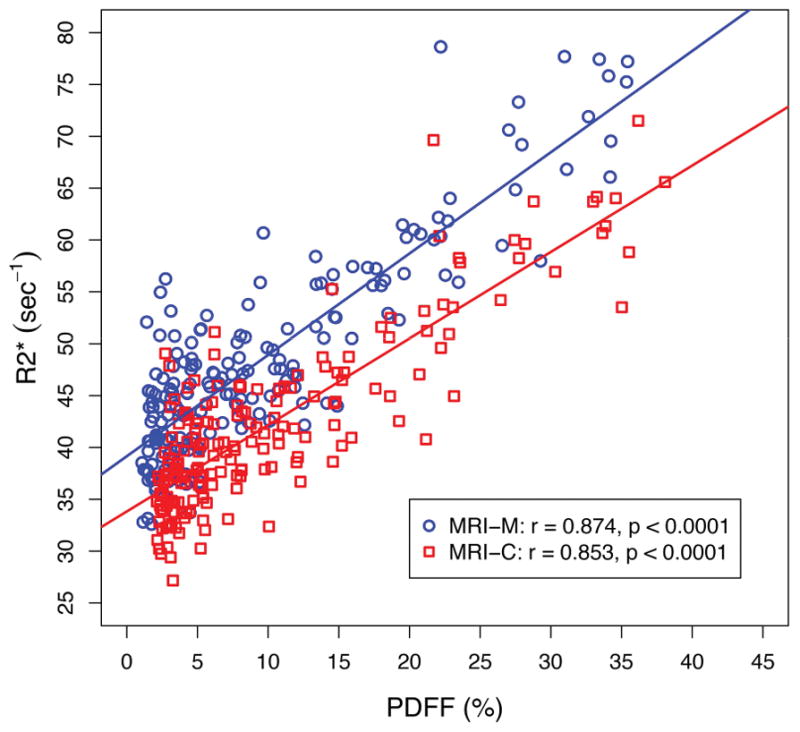
Linear regression between hepatic proton density fat fraction (PDFF) and R2* estimated by magnitude-based MRI (MRI-M) and complex-based MRI (MRI-C). Regression parameters are overlain.
Agreement between MRI-M and MRI-C
Figure 4 shows Bland-Altman plots of inter-technique agreement for estimating PDFF (Figure 4a) and R2* (Figure 4b). MRI-M estimated PDFF was significantly (p < 0.0001) lower than MRI-C estimated PDFF with a mean bias of −0.6 percentage points (SD = 0.7% and LOA = (−2.1%, 0.8%)). MRI-M estimated R2* was significantly (p < 0.0001) higher than MRI-C estimated R2* with a mean bias of 6.2 s−1 (SD = 4.5 s−1 and LOA = (−2.6 s−1, 15.0 s−1)).
Figure 4.
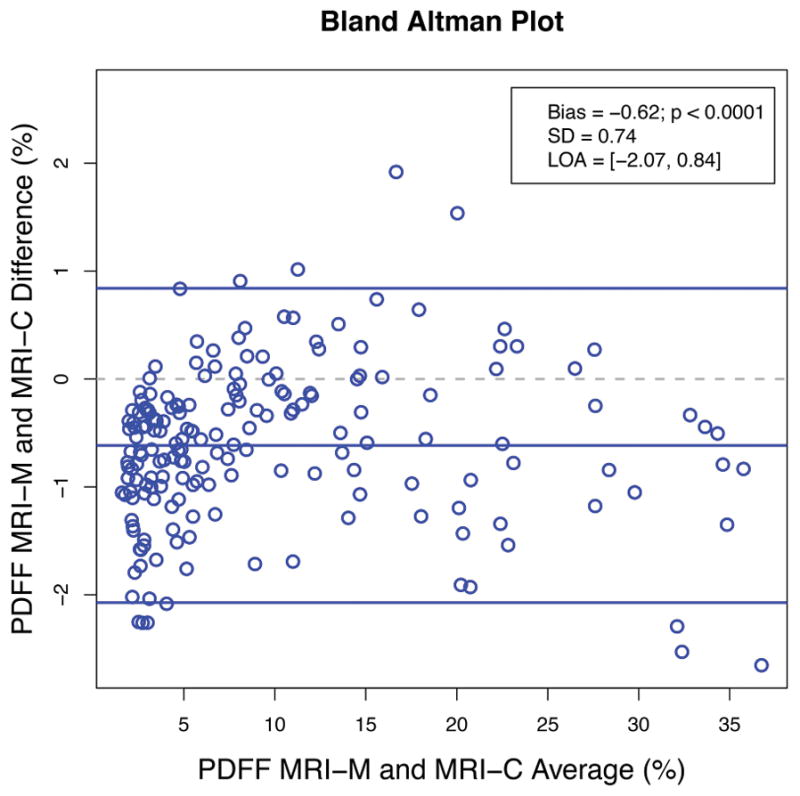
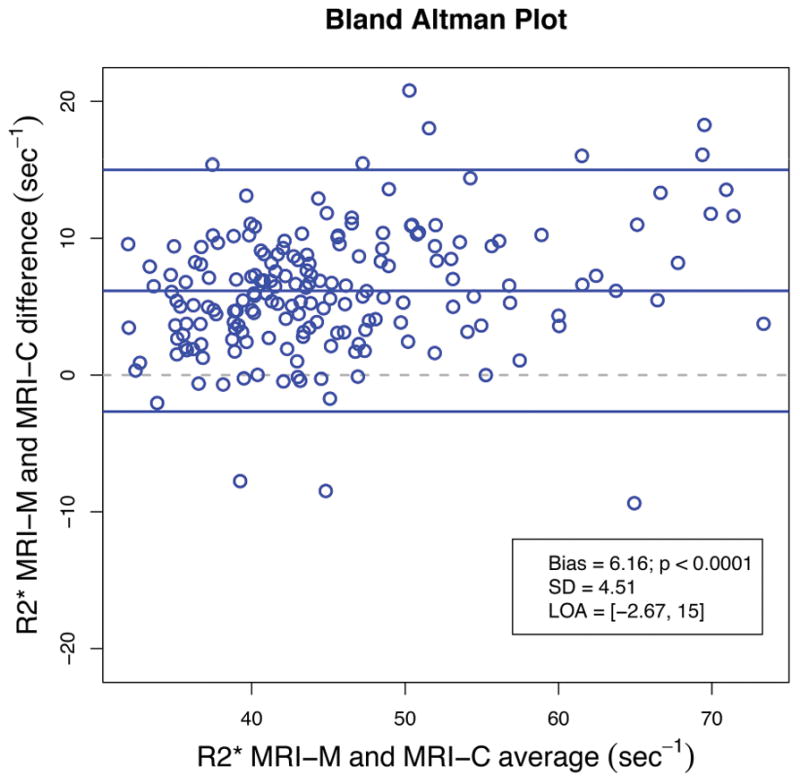
Figure 4a: Bland-Altman plot illustrating the difference between hepatic PDFF estimated by MRI-M and MRI-C as a function of average PDFF. Bias (the middle blue line which is the mean of MRI-M and MRI-C differences) and its p-value, standard deviation (SD) of the MRI-M and MRI-C differences, and limits of agreement (LOA) are overlain. This plot demonstrates close agreement between the two MRI techniques across a wide range of PDFF.
Figure 4b: Bland-Altman plot illustrating the difference between hepatic R2* estimated by MRI-M and MRI-C as a function of average R2*. Bias (the middle blue line which is the mean of MRI-M and MRI-C differences) and its p-value, standard deviation (SD) of the MRI-M and MRI-C differences, and limits of agreement (LOA) are overlain. This plot demonstrates close agreement between the two MRI techniques across a wide range of R2*.
DISCUSSION
We demonstrated a direct correlation between PDFF and R2*, as measured by both MRI-M and MRI-C, in children spanning a wide range of hepatic PDFF and who were unlikely to have excess hepatic iron accumulation. The PDFF-R2* relationship was observed using two different PDFF-R2* quantification approaches (MRI-M and MRI-C), indicating it is not a technique-dependent spurious finding. We also demonstrated close inter-technique agreement in PDFF and R2*, although MRI-M compared to MRI-C slightly underestimated the PDFF and overestimated the R2*.
The direct correlation between PDFF and R2* in children is consistent with a recent study in adults by Bashir et al (9) which reported moderate correlation using three different analytical algorithms for MRI-C data at 3T Our results and those of Bashir et al (9) differ from those of Kuhn et al (14), who reported a nonsignificant correlation between R2* estimated by confounder-corrected MRI-C and histologic steatosis grade. Since histologic steatosis grade is a 4-point ordinal score with broad brackets of fat content (<5%, 5–33%, 34–66%, >67%) while R2* is a continuous measurement, the reliance on histologic steatosis grade as the measure of liver fat in the Kuhn et al study may have reduced statistical power for detecting a significant correlation. Also, Kuhn et al included adult patients with mixed liver diseases including liver tumors and other conditions in which iron overload may be present, which would substantially alter R2* and dominate any smaller but real relationship between fat content and R2*.
The mechanism underlying the relationship between PDFF and R2* is not known. One plausible explanation is that fat droplets induce local susceptibility effects that accelerate the R2* decay of neighboring water molecules. It is known that fat and water have different magnetic dipole moments and therefore fat droplets (37) may act as small bar magnets and introduce focal magnetic field heterogeneities that accelerate R2* decay. The alternative explanation that fat has shorter R2* than water is unlikely to be true; recent studies by Horng et al and Hamilton et al (18,38) have shown that the R2* of fat and water are essentially identical in human liver. Iron accumulation is unlikely to explain the relationship between PDFF and R2*, as it is rarely found histologically in children with NAFLD, especially those in which conditions associated with iron overload were excluded clinically. Moreover, the observed ranges of R2* at 3T are not suggestive of meaningful iron overload (7,39). Our study cannot exclude the possibility that the relationship is mediated by histological factors other than iron, as histology was not available. Further study is needed to examine the postulated role of fat-droplet-induced susceptibility as well as explore other possible mechanisms.
The reason for slight overestimation in R2* by MRI-M relative to MRI-C is unclear. Hernando et al (17) showed in simulations that, due to noise-floor effects, magnitude-based reconstructions underestimate R2* compared to complex-based reconstructions, particularly at high R2* values. Since our patients tended to have low R2* values, noise-floor effects should be negligible. Further research is needed to confirm and explain the discrepancy in R2* estimation by MRI-M and MRI-C in the low R2* range. The slight underestimation of PDFF by MRI-M is consistent with previous studies (24,25).
Although the PDFF signal model implicitly assumes that PDFF and R2* reflect distinct and unrelated physiological processes, our study suggests that the two measurements may not be completely distinct and may be interdependent. Regardless of the mechanism underlying the relationship, our study suggests that PDFF be considered in the interpretation of mild elevations in R2*. We speculate, for example, that in the setting of low PDFF, mild R2* elevation indicates iron overload; in the setting of high PDFF, however, mild R2* elevation is nonspecific and could reflect iron overload or the effects of fat accumulation on R2* or both. Further research is needed to understand whether and how to modify the interpretation of hepatic R2* based on contemporaneous hepatic PDFF.
The close agreement in PDFF and R2* estimated by the two techniques suggests that either technique is likely to be suitable for clinical care and for clinical trials. Both techniques were used in this study because the close agreement for R2* estimation had not been verified previously and so it was previously unknown whether the PDFF-R2* relationship was technique dependent. Despite the close agreement in PDFF and R2* estimations, there were small but statistically significant differences. Thus, caution is suggested in applying these techniques interchangeably for estimation of PDFF and R2* clinically.
The lack of histology was a meaningful limitation of our study, as it precluded an analysis of possible histologic determinants that may explain the PDFF-R2* relationship. Future studies should include histology to explore possible underlying mechanisms. This was a single-site study performed on a single scanner at one field strength, and further validation is required.
In conclusion, our study suggests that in children with a wide range of hepatic PDFF and who were unlikely to have iron overload, there is a direct correlation between PDFF and R2*, and this relationship is observed in estimations using two independent MRI techniques. Our findings suggest that the PDFF value should be considered when interpreting the R2* value in human liver. Further research in children and adults is needed to independently verify our results and to understand the underlying mechanism.
Acknowledgments
Grant support for this study:
Federal grants: R56-DK090350, R01-DK088831
Other grants of Dr. Claude B. Sirlin not related to this study:
Federal grants: U01 DK061734, R01 DK106419, R01 DK088925, T32 EB005970
Industry grants: Siemens, GE, Guerbet
ABBREVIATION KEY
- PDFF
proton density fat fraction
- NAFLD
Non-alcoholic fatty liver disease
- MRI-M
Magnetic Resonance Imaging-magnitude based
- MRI-C
Magnetic Resonance Imaging-complex based
Footnotes
Disclosures:
Dr. Claude B. Sirlin has the following disclosures not related to this study:
Industry service agreements and consultation agreements: Alexion, AstraZeneca, Bioclinica, BMS, Fibrogen, Galmed, Genzyme, Gilead, Fibrogen, Icon, Intercept, Isis, Janssen, NuSirt, Perspectum, Pfizer, Profil, Sanofi, Shire, Synageva, Tobira, Takeda, VirtualScopics
Other authors have no disclosures
References
- 1.Reeder SB, Hu HH, Sirlin CB. Proton density fat-fraction: a standardized MR-based biomarker of tissue fat concentration. J Magn Reson Imaging. 2012;36(5):1011–1014. doi: 10.1002/jmri.23741. [DOI] [PMC free article] [PubMed] [Google Scholar]
- 2.Reeder SB, Sirlin CB. Quantification of liver fat with magnetic resonance imaging. Magn Reson Imaging Clin N Am. 2010;18(3):337–357. ix. doi: 10.1016/j.mric.2010.08.013. [DOI] [PMC free article] [PubMed] [Google Scholar]
- 3.Hines CD, Frydrychowicz A, Hamilton G, et al. T(1) independent, T(2) (*) corrected chemical shift based fat-water separation with multi-peak fat spectral modeling is an accurate and precise measure of hepatic steatosis. J Magn Reson Imaging. 2011;33(4):873–881. doi: 10.1002/jmri.22514. [DOI] [PMC free article] [PubMed] [Google Scholar]
- 4.Zand KA, Shah A, Heba E, et al. Accuracy of multiecho magnitude-based MRI (M-MRI) for estimation of hepatic proton density fat fraction (PDFF) in children. J Magn Reson Imaging. 2015 doi: 10.1002/jmri.24888. [DOI] [PMC free article] [PubMed] [Google Scholar]
- 5.Kuhn JP, Hernando D, Mensel B, et al. Quantitative chemical shift-encoded MRI is an accurate method to quantify hepatic steatosis. J Magn Reson Imaging. 2014;39(6):1494–1501. doi: 10.1002/jmri.24289. [DOI] [PMC free article] [PubMed] [Google Scholar]
- 6.Schwimmer JB, Middleton MS, Behling C, et al. Magnetic resonance imaging and liver histology as biomarkers of hepatic steatosis in children with nonalcoholic fatty liver disease. Hepatology. 2015;61(6):1887–1895. doi: 10.1002/hep.27666. [DOI] [PMC free article] [PubMed] [Google Scholar]
- 7.Wood JC, Enriquez C, Ghugre N, et al. MRI R2 and R2* mapping accurately estimates hepatic iron concentration in transfusion-dependent thalassemia and sickle cell disease patients. Blood. 2005;106(4):1460–1465. doi: 10.1182/blood-2004-10-3982. [DOI] [PMC free article] [PubMed] [Google Scholar]
- 8.Hernando D, Levin YS, Sirlin CB, Reeder SB. Quantification of liver iron with MRI: State of the art and remaining challenges. J Magn Reson Imaging. 2014 doi: 10.1002/jmri.24584. [DOI] [PMC free article] [PubMed] [Google Scholar]
- 9.Bashir MR, Zhong X, Nickel MD, et al. Quantification of hepatic steatosis with a multistep adaptive fitting MRI approach: prospective validation against MR spectroscopy. AJR Am J Roentgenol. 2015;204(2):297–306. doi: 10.2214/AJR.14.12457. [DOI] [PubMed] [Google Scholar]
- 10.Zhong X, Nickel MD, Kannengiesser SA, Dale BM, Kiefer B, Bashir MR. Liver fat quantification using a multi-step adaptive fitting approach with multi-echo GRE imaging. Magn Reson Med. 2014;72(5):1353–1365. doi: 10.1002/mrm.25054. [DOI] [PubMed] [Google Scholar]
- 11.Yu H, Shimakawa A, Hines CD, et al. Combination of complex-based and magnitude-based multiecho water-fat separation for accurate quantification of fat-fraction. Magn Reson Med. 2011;66(1):199–206. doi: 10.1002/mrm.22840. [DOI] [PMC free article] [PubMed] [Google Scholar]
- 12.Reeder SB, Brittain JH, Grist TM, Yen YF. Least-squares chemical shift separation for (13)C metabolic imaging. J Magn Reson Imaging. 2007;26(4):1145–1152. doi: 10.1002/jmri.21089. [DOI] [PubMed] [Google Scholar]
- 13.Reeder SB, Robson PM, Yu H, et al. Quantification of hepatic steatosis with MRI: the effects of accurate fat spectral modeling. J Magn Reson Imaging. 2009;29(6):1332–1339. doi: 10.1002/jmri.21751. [DOI] [PMC free article] [PubMed] [Google Scholar]
- 14.Kuhn JP, Hernando D, Munoz del Rio A, et al. Effect of multipeak spectral modeling of fat for liver iron and fat quantification: correlation of biopsy with MR imaging results. Radiology. 2012;265(1):133–142. doi: 10.1148/radiol.12112520. [DOI] [PMC free article] [PubMed] [Google Scholar]
- 15.Yu H, McKenzie CA, Shimakawa A, et al. Multiecho reconstruction for simultaneous water-fat decomposition and T2* estimation. J Magn Reson Imaging. 2007;26(4):1153–1161. doi: 10.1002/jmri.21090. [DOI] [PubMed] [Google Scholar]
- 16.Yu H, Shimakawa A, McKenzie CA, Brodsky E, Brittain JH, Reeder SB. Multiecho water-fat separation and simultaneous R2* estimation with multifrequency fat spectrum modeling. Magn Reson Med. 2008;60(5):1122–1134. doi: 10.1002/mrm.21737. [DOI] [PMC free article] [PubMed] [Google Scholar]
- 17.Hernando D, Kramer JH, Reeder SB. Multipeak fat-corrected complex R2* relaxometry: theory, optimization, and clinical validation. Magn Reson Med. 2013;70(5):1319–1331. doi: 10.1002/mrm.24593. [DOI] [PMC free article] [PubMed] [Google Scholar]
- 18.Horng DE, Hernando D, Hines CD, Reeder SB. Comparison of R2* correction methods for accurate fat quantification in fatty liver. J Magn Reson Imaging. 2013;37(2):414–422. doi: 10.1002/jmri.23835. [DOI] [PMC free article] [PubMed] [Google Scholar]
- 19.Hines CD, Agni R, Roen C, et al. Validation of MRI biomarkers of hepatic steatosis in the presence of iron overload in the ob/ob mouse. J Magn Reson Imaging. 2012;35(4):844–851. doi: 10.1002/jmri.22890. [DOI] [PMC free article] [PubMed] [Google Scholar]
- 20.Schwimmer JB, Deutsch R, Kahen T, Lavine JE, Stanley C, Behling C. Prevalence of fatty liver in children and adolescents. Pediatrics. 2006;118(4):1388–1393. doi: 10.1542/peds.2006-1212. [DOI] [PubMed] [Google Scholar]
- 21.Awai HI, Newton KP, Sirlin CB, Behling C, Schwimmer JB. Evidence and recommendations for imaging liver fat in children, based on systematic review. Clin Gastroenterol Hepatol. 2014;12(5):765–773. doi: 10.1016/j.cgh.2013.09.050. [DOI] [PMC free article] [PubMed] [Google Scholar]
- 22.Schwimmer JB, Behling C, Newbury R, et al. Histopathology of pediatric nonalcoholic fatty liver disease. Hepatology. 2005;42(3):641–649. doi: 10.1002/hep.20842. [DOI] [PubMed] [Google Scholar]
- 23.Feldman A, Aigner E, Weghuber D, Paulmichl K. The Potential Role of Iron and Copper in Pediatric Obesity and Nonalcoholic Fatty Liver Disease. Biomed Res Int. 2015;2015:287401. doi: 10.1155/2015/287401. [DOI] [PMC free article] [PubMed] [Google Scholar]
- 24.Haufe W, Wolfson T, Hamilton G, et al. Accuracy of PDFF estimation by magnitude-based and complex-based MRI in children with known or suspected non-alcoholic fatty liver disease. annual meeting of the European Society for Gastrointestinal and Abdominal Radiology (ESGAR); Paris France. 2015. [Google Scholar]
- 25.Tyagi A, Yeganeh O, Levin Y, et al. Intra- and inter-examination repeatability of magnetic resonance spectroscopy, magnitude-based MRI, and complex-based MRI for estimation of hepatic proton density fat fraction in overweight and obese children and adults. Abdom Imaging. 2015;40(8):3070–3077. doi: 10.1007/s00261-015-0542-5. [DOI] [PMC free article] [PubMed] [Google Scholar]
- 26.Vos MB, Abrams SH, Barlow SE, et al. NASPGHAN Clinical Practice Guideline for the Diagnosis and Treatment of Nonalcoholic Fatty Liver Disease in Children: Recommendations from the Expert Committee on NAFLD (ECON) and the North American Society of Pediatric Gastroenterology, Hepatology and Nutrition (NASPGHAN) Journal of pediatric gastroenterology and nutrition. 2017;64(2):319–334. doi: 10.1097/MPG.0000000000001482. [DOI] [PMC free article] [PubMed] [Google Scholar]
- 27.Schwimmer JB, Newton KP, Awai HI, et al. Paediatric gastroenterology evaluation of overweight and obese children referred from primary care for suspected non-alcoholic fatty liver disease. Alimentary pharmacology & therapeutics. 2013;38(10):1267–1277. doi: 10.1111/apt.12518. [DOI] [PMC free article] [PubMed] [Google Scholar]
- 28.Hamilton G, Yokoo T, Bydder M, et al. In vivo characterization of the liver fat (1)H MR spectrum. NMR Biomed. 2011;24(7):784–790. doi: 10.1002/nbm.1622. [DOI] [PMC free article] [PubMed] [Google Scholar]
- 29.Yokoo T, Bydder M, Hamilton G, et al. Nonalcoholic fatty liver disease: diagnostic and fat-grading accuracy of low-flip-angle multiecho gradient-recalled-echo MR imaging at 1.5 T. Radiology. 2009;251(1):67–76. doi: 10.1148/radiol.2511080666. [DOI] [PMC free article] [PubMed] [Google Scholar]
- 30.Liu CY, McKenzie CA, Yu H, Brittain JH, Reeder SB. Fat quantification with IDEAL gradient echo imaging: correction of bias from T(1) and noise. Magn Reson Med. 2007;58(2):354–364. doi: 10.1002/mrm.21301. [DOI] [PubMed] [Google Scholar]
- 31.Bydder M, Yokoo T, Hamilton G, et al. Relaxation effects in the quantification of fat using gradient echo imaging. Magn Reson Imaging. 2008;26(3):347–359. doi: 10.1016/j.mri.2007.08.012. [DOI] [PMC free article] [PubMed] [Google Scholar]
- 32.Tang A, Tan J, Sun M, et al. Nonalcoholic fatty liver disease: MR imaging of liver proton density fat fraction to assess hepatic steatosis. Radiology. 2013;267(2):422–431. doi: 10.1148/radiol.12120896. [DOI] [PMC free article] [PubMed] [Google Scholar]
- 33.Kuhn JP, Jahn C, Hernando D, et al. T1 bias in chemical shift-encoded liver fat-fraction: role of the flip angle. J Magn Reson Imaging. 2014;40(4):875–883. doi: 10.1002/jmri.24457. [DOI] [PMC free article] [PubMed] [Google Scholar]
- 34.Johnson BL, Schroeder ME, Wolfson T, et al. Effect of flip angle on the accuracy and repeatability of hepatic proton density fat fraction estimation by complex data-based, T1-independent, T2*-corrected, spectrum-modeled MRI. J Magn Reson Imaging. 2014;39(2):440–447. doi: 10.1002/jmri.24153. [DOI] [PMC free article] [PubMed] [Google Scholar]
- 35.Reeder SB, McKenzie CA, Pineda AR, et al. Water-fat separation with IDEAL gradient-echo imaging. J Magn Reson Imaging. 2007;25(3):644–652. doi: 10.1002/jmri.20831. [DOI] [PubMed] [Google Scholar]
- 36.Hernando D, Hines CD, Yu H, Reeder SB. Addressing phase errors in fat-water imaging using a mixed magnitude/complex fitting method. Magn Reson Med. 2012;67(3):638–644. doi: 10.1002/mrm.23044. [DOI] [PMC free article] [PubMed] [Google Scholar]
- 37.Hopkins JA, Wehrli FW. Magnetic susceptibility measurement of insoluble solids by NMR: magnetic susceptibility of bone. Magn Reson Med. 1997;37(4):494–500. doi: 10.1002/mrm.1910370404. [DOI] [PubMed] [Google Scholar]
- 38.Hamilton GSA, Mamidipalli A, Middleton MS, Loomba R, Sirlin CB. Comparison of R2* of liver water and fat using 1H MRS. International Society for Magnetic Resonance in Medicine (ISMRM) Annual meeting; Singapore. 2016. [Google Scholar]
- 39.Bassett ML, Halliday JW, Powell LW. Value of hepatic iron measurements in early hemochromatosis and determination of the critical iron level associated with fibrosis. Hepatology. 1986;6(1):24–29. doi: 10.1002/hep.1840060106. [DOI] [PubMed] [Google Scholar]


