Abstract
Introduction
In principle, MR methods that exploit magnetization transfer (MT) may be used to quantify changes in the molecular composition of tissues after injury. The ability to track such changes in injured spinal cord may allow more precise assessment of the state of neural tissues.
Methods
Z-spectra were obtained from the cervical spinal cord before and after a unilateral dorsal column lesion in monkeys at 9.4T. The amplitudes of chemical exchange saturation transfer (CEST) and nuclear Overhauser enhancement (NOE) effects from multiple proton pools, along with non-specific semisolid MT effects from immobile macromolecules, were quantified using a 5-peak Lorenzian fitting of each Z-spectrum.
Results
Abnormal tissues/cysts that formed around lesion sites exhibited relatively low correlations between their Z-spectra and that of normal gray matter (GM). Compared to normal GM, cysts showed strong CEST but weak semisolid MT and NOE effects after injury. The abnormal tissues around lesion sites were heterogeneous and showed different regional Z-spectra. Different regional correlations between proton pools were observed. Longitudinally, injured spinal cord tissue exhibited remarkable recovery in all subjects.
Conclusions
Characterization of multiple proton pools from Z-spectra permitted non-invasive, regional, quantitative assessments of changes in tissue composition of injured spinal cord over time.
Keywords: MRI, chemical exchange saturation transfer (CEST), nuclear Overhauser enhancement (NOE), magnetization transfer (MT), Lorentzian band fitting, multiple proton pools, spinal cord injury, 9.4T
INTRODUCTION
Traumatic spinal cord injury (SCI) may damage white matter (WM) tracts and central grey matter (GM), leading to motor, sensory, and autonomic functional impairments. The initial insult to the cord leads to a complex cascade of events that may further damage spinal cord function via secondary injury processes. Over time, the formation of a cyst and scar tissue around the initial injury may prevent the reconnection of regenerated WM fibers. A comprehensive characterization of this process is critical not only for understanding the mechanism underlying the spontaneous recovery of damaged cords, but also for promoting new therapeutic approaches to prevent secondary damage, enhance the regeneration of disconnected WM, and improve the recovery of spinal functions.
Quantitative measurements of the intrinsic characteristics of the spinal cord have been challenging. This is partly due to technical constraints, such as the small size of the cord, local magnetic field inhomogeneity, relatively low signal-to-noise ratio (SNR), data acquisition time limitations, and motion artifacts including the presence of cerebral spinal fluid (CSF) pulsation associated with cardiac and respiratory cycles [1, 2]. Along with advances in MRI hardware and availability of novel image acquisition sequences, quantitative MRI methods such as diffusion tensor imaging (DTI) and magnetization transfer (MT) have been used to study pathologies of the spinal cord including injury [3, 4]. This allows for the monitoring of the progression and recovery from SCI in animals [1, 5], and possibly in human SCI patients [1, 2]. Since metal hardware is often used for stabilizing injured spinal vertebrae and causes severe MRI signal dropout and image distortion, comprehensive and longitudinal characterization of the recovery process in SCI patients is very challenging. Alternatively, non-human primates provide a valuable pre-clinical model for studying SCI. In recent years, we have successfully applied several quantitative MRI methods, including blood oxygenation level dependent (BOLD) functional MRI (fMRI), DTI, MT, and chemical exchange saturation transfer (CEST) imaging [6–9], to study the natural recovery process from SCI introduced by well-controlled unilateral sections of cervical spinal cord in monkeys. We previously reported that the spinal tissue surrounding the injury site can develop cyst formations. CEST imaging revealed dynamic and differential molecular composition alterations within the cyst over a period of weeks to months [6]. Quantitative MT (qMT) imaging identified demyelination of the WM tracts located rostral and dorsal to the injury site [7]. Furthermore, functional connectivity (FC) between spinal horns in spinal segments below the lesion was disturbed, and the inter-horn FC strength was significantly reduced [9]. Most importantly, recoveries of injured spinal cord tissue and the GM functional integrity appeared to be associated with the severity of the SCI, as quantified using tracer tracking histology [6, 10], and behavioral recovery of hand use [11, 12]. One remarkable finding derived from these series of quantitative MRI studies was that the recovery processes were complex and dynamic, and varied across subjects.
Extending our previous study that focused on CEST effects at 3 RF offsets downfield of water in the Z-spectra of the rim and core compartments of cysts, as identified by their MT ratio [6], here we examined whole Z-spectra to segment distinct abnormal regions around lesion sites based on pixel-by-pixel correlations between the Z-spectra, and simultaneously fit each spectrum to a 5-pool model [13–15] to derive measurements of tissue molecular constituents. The analysis takes account of direct saturation on free water (DS), NOE (nuclear Overhauser enhancement) and semisolid MT effects in addition to CEST [16, 17]. This whole Z-spectra modeling approach quantifies nonspecific MT effects from immobile macromolecules (semisolid MT) [17, 18], as well as NOE-mediated saturation transfer effects from other macromolecules including membrane lipids and mobile proteins [15, 19, 20], and CEST effects from mobile proteins/peptides and metabolites [14, 21–27]. These measures are well suited for characterizing SCI as it involves altered cellular metabolism, inflammation, and apoptosis. Our findings demonstrate that the multiple proton pools that contribute to each Z-spectrum provide mutual and objective molecular information to understand injury-associated changes in spinal cord. The present study also aims to characterize and monitor the spinal tissue pathology in each individual subject longitudinally, in order to understand the impact of tissue damage and compositional change on behavioral recovery such as impaired hand use after cervical SCI.
METHODS
Animal preparation
Twelve adult male squirrel monkeys (Saimiri sciureus, 6–8 years old) were studied. Five of them, identified as SM-B, SM-G, SM-P, SM-S and SM-T, underwent a unilateral dorsal column transectional lesion at a high cervical level of the spinal cord, where afferents from the digits enter the spinal cord. These monkeys were scanned before and at different time points after SCI (e.g., 2, 3, 6, 7, 8, 10, 12, 14, 16 or 24 weeks). The specific scan time points and repetitions varied across animals, depending on the behavior and recovery of each subject. During MRI data acquisition, each monkey was maintained under stable anesthesia (isoflurane 0.8–1.0%) and mechanically ventilated (40 respiration cycles/min), with head and body stabilized in an MR-compatible frame. Vital signs, including heart rate, core body temperature, end tidal CO2, and SpO2, were monitored and maintained at a stable level throughout the entire imaging session. All procedures were approved by the IACUC (Institutional Animal Care and Use Committee) of Vanderbilt University.
In vivo MRI imaging
All MR images were acquired on a 9.4T Agilent MRI scanner using a quadrature transmit-receive birdcage brain volume coil (85-mm inner diameter) or a customized saddle-shaped transmit-receive coil (50-mm inner diameter and 30-mm long) positioned around the cervical spine region. The image field of view for cervical spinal cord was centered at the level where the lesion was targeted. A fast spin-echo sequence (TR=3000 ms, effective TE = 30 ms, RARE-factor 4, resolution = 0.333×0.333×1 mm3) was used to achieve T2-weighted images of the brain (Fig. 1a). High-resolution magnetization transfer contrast (MTC)-weighted structural images (in-plane resolution of 0.313 × 0.313 mm2) were acquired using a gradient echo acquisition (TR/TE=220/3.24 ms, matrix size=128×128), which incorporated a Gaussian saturation pulse at RF offset of 5000 Hz and flip angle 820°. A single coronal slice was then selected for further examination (Fig. 1a)[6].
Fig. 1. Data acquisition and quantification of Z-spectrum for squirrel monkey.
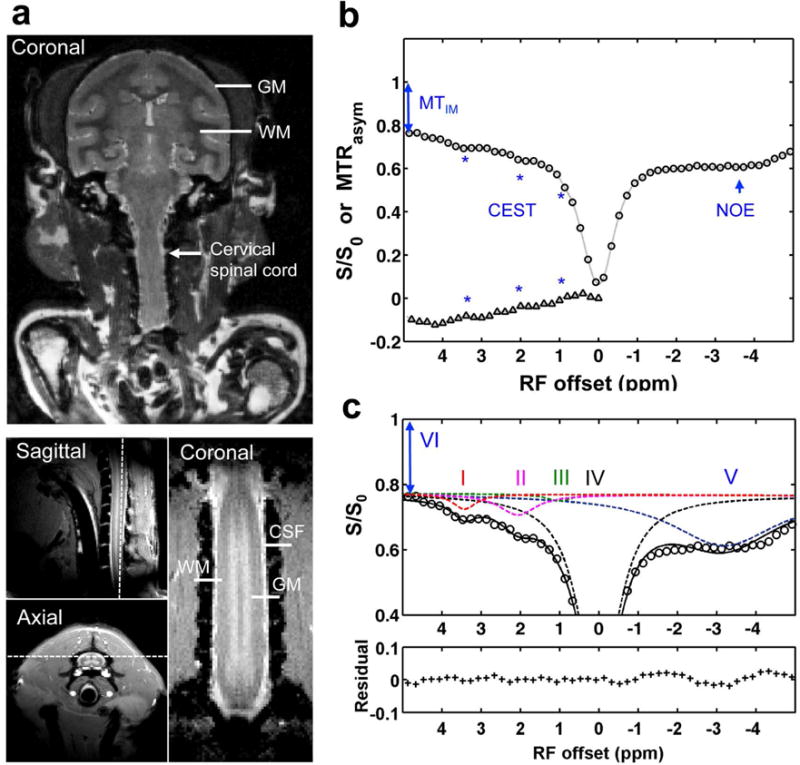
(a) Characteristic anatomical images of brain (T2-weighted) and spinal cord (MTC) used for planning CEST imaging. The white arrow indicates the cervical spinal cord. Dashed white lines indicate the selected single coronal slice for acquiring CEST data. GM: gray matter; WM: white matter; CSF: cerebrospinal fluid. (b) Conventional MTRasym analysis, showing Z spectrum (circle) and MTRasym curve (triangle) after Bo correction. The asterisks indicate the CEST effects. The 2-head arrow indicates semisolid MT effect at 5 ppm RF offset (VI), and the 1-head arrow indicates nuclear Overhauser enhancement (NOE). (c) Multi-pool Lorentzian band fitting, with peaks assigned at RF offset frequencies (Δi) of 3.5 (I), 2.2 (II), 1.2 (III), 0 (IV), and −3.3 (V) ppm, for amide, amine, hydroxyl, free water, and aliphatic proton pools, respectively. The amplitude and width of the peaks were allowed to vary in achieving the best fit. The bottom half of the figure shows the residuals between the sum of the fitted peaks and the original data.
CEST and NOE measurements were performed using a 5s continuous wave (CW) saturation of amplitude 1.0 μT followed by a spin-echo echo-planar-imaging acquisition (2 segments, TR = 7.5 s, TE = 17.6 ms, matrix of 64×64, resolution = 0.5×0.5×1 mm3). The 1.0 μT saturation power is appropriate for studying magnetization transfer effects using a multiple peak fitting approach [13]. Previous studies [20, 28] have shown that 1.0 μT is optimum for detecting both CEST and NOE effects at 9.4T. Saturation power of 1.0 μT or lower amplitude has been widely applied to study slow and intermediate chemical exchanging and NOE affected proton pools at high field [13–15, 20, 28], and has been successfully used for CEST imaging of amine and glucose (which belong in the fast exchanging regime at high field) using a similar peak fitting approach [13, 14]. A 5s irradiation was performed to allow the spin system to reach steady state before acquisition. Z-spectra were acquired with RF offsets from −2000 to 2000 Hz (−5 to 5 ppm at 9.4T) with an interval of 80 Hz (0.2 ppm at 9.4T). Reference scans were obtained at the beginning and the end of each acquisition using an RF offset at 100 kHz. To correct for main field (Bo) inhomogeneity effects, a Water Saturation Shift Reference (WASSR) spectrum [29] was collected using the same sequence but with a 1s CW saturation pulse at 0.1 μT, and the saturation offset range was ± 200 Hz (in 20 Hz steps) with respect to water. TR was set to match the respiration rate (1.5 s per cycle) to minimize motion artifacts. The acquisition time for CEST data was less than one hour.
MRI data analysis
All data were analyzed using MATLAB (Mathworks, Waltham, MA). Images were coregistered using a rigid registration algorithm based on mutual information [30]. A linear baseline correction was applied based on the reference scans.
The CEST spectra amplitudes (S) were Bo-corrected and normalized to the reference scan (So):
| (1) |
The semisolid MT effect from immobile macromolecules (MTIM) was evaluated at RF offset 5 ppm (pool VI in Fig. 1c):
| (2) |
The averaged Z-spectrum and conventional asymmetric magnetization transfer ratio MTRasym curves of normal spinal GM and WM were calculated. CEST effects were clearly seen at RF offsets around 3.5, 2.2 and 1.2 ppm (Fig. 1b), which originate from exchangeable amide, amine and hydroxyl protons respectively. Non-CEST features were also apparent in the Z-spectrum, including semisolid MT effects (indicated by 2-head arrow in Figs. 1b,c), as well as intramolecular and intermolecular NOE effects of aliphatic protons on macromolecules (indicated by 1-head arrow in Fig. 1c). A peak-fitting algorithm was then used to quantify the Z-spectra and the contributions of each overlapping peak within the RF offset range from −5 to 5 ppm [13]. The contribution of the semisolid MT effect to the Z-spectrum acquired at low saturation power (≤1.0 μT) was simply treated as a constant offset [13–15] due to its broad, slowly varying features over this range. The algorithm first inverted the Z-spectrum between −5 to 5 ppm and removed the remaining baseline caused by the semisolid MT effect such that the points at −5 to 5 ppm correspond to 0 amplitude [13, 14]. A non-linear optimization routine was then applied to decompose the baseline-corrected signal into its overlapping components. The lowest root mean square (RMS) of residuals between the data and model in the selected segment produced the model fits. Spectra were fit as the sum of 5 Lorentzian peaks (Fig. 1b):
| (3) |
where the baseline-corrected signal is a function of RF offset (Δ), peak full width at half maximum (W) and peak amplitude (A). The peak resonance frequencies (Δoi) were around 3.5, 2.2, 1.2, 0, and −3.3 ppm offset for the amide (I), amine (II), hydroxyl (III), free water (IV), and aliphatic (V) proton pools, respectively (Fig. 1b). Supporting Table S1 shows the resultant data for the 5 pools. The peak amplitudes derived from fitting were used to evaluate the changes in molecular composition of the spinal cord.
Z-spectra acquired from different regions at different times were analyzed for further comparison. The Pearson correlation coefficients (r) between the Z-spectrum at each pixel and the averaged Z-spectrum of normal GM were calculated. Abnormal regions were identified as those pixels with Z-spectra showing relatively low correlation with the average Z-spectrum of normal GM. The abnormal regions were further separated into ROIs of distinct Z-spectra. To avoid partial volume effects, only 4–24 pixels with the lowest local r values were selected for each ROI. Only the middle 1.5 cm-long section of the spinal cord was chosen for ROI analysis. Rostral and caudal ends of the spinal cord were not included in the analysis due to B1 and B0 variations close to the two ends of the coil [7]. Student’s t-tests were used for statistical testing, and p < 0.05 was considered as significant.
Spinal cord injury and behavioral assessment
In brief, unilateral dorsal column lesion (DCL) of the cervical spinal cord at C5 level was performed under surgical-level isoflurane (1.5–2%) anesthesia. The details of the surgical procedures for the unilateral DCL can be found in previous publications [31, 32]. The procedures for behavioral assessment can be found in supporting information.
RESULTS
Z-spectra of normal spinal cord and brain tissue
GM and WM were clearly separated on MTC structural images that allowed precise identification of WM and GM volumes in the cervical spinal cord (Fig. 1a). The Z-spectra derived from the normal spinal cord GM displayed similar features to those of normal brain GM (Fig. 2a). Fitting results showed that amplitudes of hydroxyls (pool III) were much weaker than those of amines (pool II) and amides (pool I). Amine peaks (pool II) showed the highest amplitudes and widest peaks (compare pools I–III in Fig. 2a). The semisolid MT effects (pool VI) were also comparable. No significant differences were observed for NOE effects (pool V) between brain and spinal cord GM.
Fig. 2. Comparison of features in Z-spectra of normal brain and cervical spinal cord of squirrel monkey.
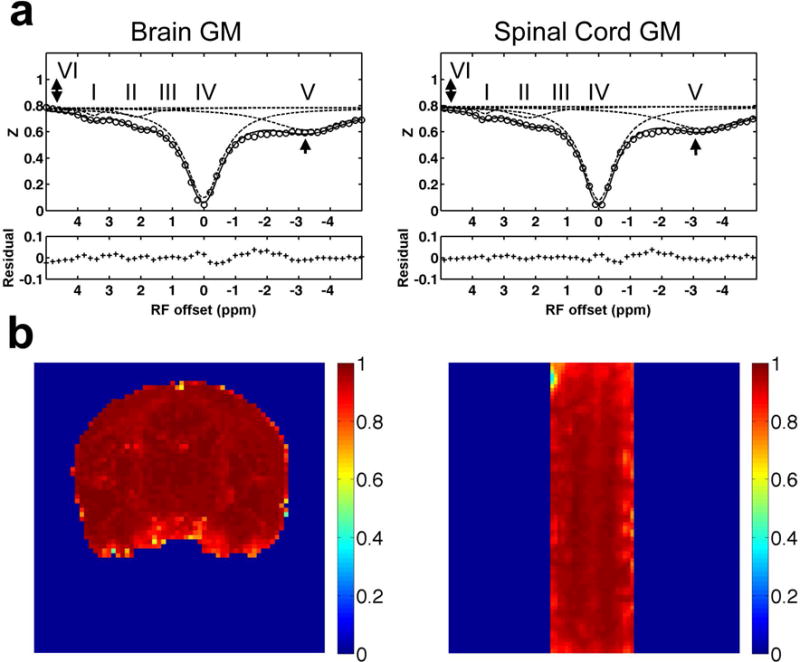
(a) Comparison of the averaged Z-spectra of GM in brain and spinal cord. The 2-head arrows indicate semisolid MT effect, and the 1-head arrow indicates nuclear Overhauser enhancement (NOE). The labels of multiple proton pools are the same as those in Figure 1. (b) Pixel-by-pixel correlation r maps showing the Pearson correlation coefficient of the Z-spectrum at each pixel with the averaged Z-spectrum of GM of the brain (left) or spinal cord (right).
Figure 2b shows the results of the voxel-by-voxel correlation analysis of the Z-spectra over the entire imaging volume. Relative to the averaged spectrum of GM, voxels in GM showed correlation coefficients r close to one, whereas those in WM exhibited lower correlations consistent with their different molecular compositions (Supporting Fig. S1).
Regional characteristics of multiple proton pools of injured spinal cord from model fitting
Regional Z-spectra provided profiles of selected ROIs surrounding the lesion site, and 5-pool fitting results were compared (Fig. 3, Supporting Fig. S2, and Supporting Table S2). The abnormal tissue regions were identified by their relatively low correlations with normal GM based on Z-spectra (Fig. 3a). The correlations between Z-spectra are affected by changes in CEST, DS, NOE, and/or semisolid MT effects which make them more sensitive for identifying tissue variations than a simple MT ratio [6]. We selected seven regions surrounding the lesion site in one representative SCI subject (SM-P) 10 weeks after lesion (Fig. 3a). Normal control tissue region (CL) exhibited high r value (0.978 ± 0.022) whereas the abnormal regions showed lower values (r < 0.9). Some of these regions with relatively low r values (Fig. 3a), however, were not visible in the MTC images (Supporting Fig. S3) and MTR maps [6]. Normal and abnormal tissues all showed semisolid MT and NOE effects (Fig. 3b,d,e,f), although the semisolid MT effect was smaller in the abnormal tissue AT1 region than other ROIs (Fig. 3e). Cysts were distinguished based on their unusually low semisolid MT and NOE effects (Fig. 3c and Supporting Fig. S2). The locations and tissue properties of ROIs Scar and Cyst1 were later confirmed by histology [6].
Fig. 3. Characterization of regional Z-spectra.

(a) Correlation r map showing pixel-by-pixel Pearson correlation coefficient between Z-spectrum at each pixel and the averaged Z-spectrum of normal GM. Abnormal regions were defined based on their relatively low correlation coefficients (r < 0.9). Seven ROIs were selected for comparison. CL: normal tissues on the contralateral side with normal semisolid MT, NOE and CEST effects. AT1-2: abnormal tissues around the lesion sites with evident MT effects but unusual NOE and CEST effects. Scar: scar tissues identified in the final histologic section. Cyst1-3: cyst regions with very low semisolid MT and NOE effects, but unusually high CEST and DS effects. Averaged regional Z-spectra of CL (b), Cyst1 (c), Scar (d), AT1 (e) and AT2 (f) are compared. Subject SM-P at week 10 after spinal cord injury shown.
Model fitting revealed distinct proton pool changes in each ROI (Fig. 3, Supporting Fig. S2, and Supporting Table S2); several features are present. First, for all selected ROIs, pool II showed a broader peak than pools I and III. Second, the Z-spectra of all cyst ROIs were very asymmetric (Fig. 3c and Supporting Fig. S2), and showed higher CEST effects (A > 0.2 for pools I–III), higher free water levels (A > 0.9 and W < 0.9 ppm for pool IV) compared to normal GM tissues (Fig. 3b), but with much lower aliphatic level (A < 0.05, pool V) and semisolid MT effects (A < 0.05). Third, abnormal tissue regions AT1-2 and Scar showed quite different compositions compared to cysts. The scar tissue showed uniquely decreased amplitudes for pools I and II but increased amplitude of pool V (Fig. 3d), which were different from those observed in ATs and cysts. We also noticed that pool IV of scar tissue (Fig. 3d) had a broader peak width than that of normal tissue (Fig. 3b), which could be due to a local Bo inhomogeneity broadening from hemorrhage (Supporting Fig. S4). Fourth, two abnormal tissue ROIs (AT1-2) located rostral and caudal to the lesion site (Scar) showed different profiles. AT1 exhibited increased amplitudes for pools I–IV and decreased amplitude for pool V (Fig. 3e), whereas AT2 showed a quite similar pattern (Fig. 3f) of changes in proton pools to those of cysts, but to a lesser extent. Lastly, we observed strong CEST and weak NOE effects below and above the lesion site, in both abnormal tissue AT2 and cyst ROIs in this subject (Fig. 3d,c). Peak amplitude maps of the multiple proton pools derived from pixel-by-pixel multi-peak fittings (Fig. 4) revealed region-specific changes for each proton pool (Supporting Table S2), as described above.
Fig. 4. Amplitude maps of multiple pools of the injured spinal cord.
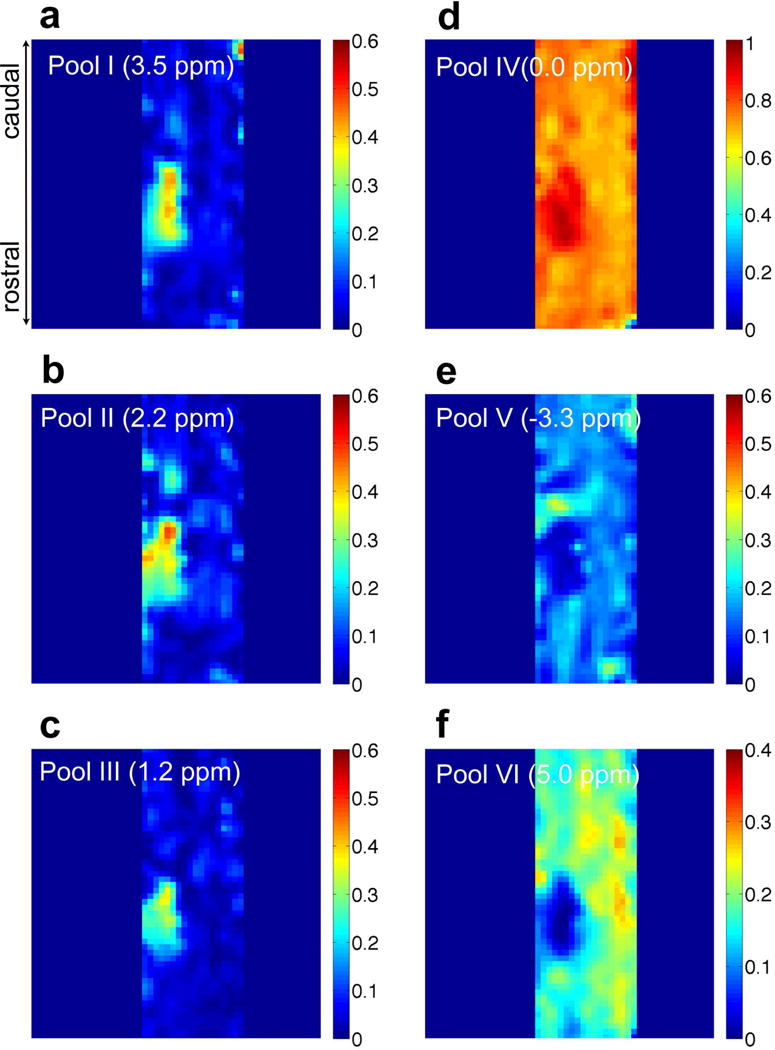
(a–e) Amplitude maps of the decomposed peaks at RF offsets of 3.5 (pool I), 2.2 (pool II), 1.2 (pool III), 0 (pool IV), −3.3 ppm (pool V), corresponding to amide, amine, hydroxyl, free water and aliphatic proton pools, respectively. (f) MTIM (5 ppm RF offset) map from immobile macromolecule (pool VI). Subject SM-P at week 10 after injury shown.
Correlations between the amplitudes of multiple proton pools in normal versus abnormal spinal cord tissue
The relationships between amplitudes of different proton pools in normal versus SCI conditions were obtained from pair-wise inter-pool correlation analyses. The 2D matrix plot of correlations in representative subject SM-P is shown in Figure 5. In normal tissues, correlations between pools were weak (Fig. 5a). A moderate positive correlation was observed between pools I and II (r = 0.450, p < 0.001). The free water pool IV correlated negatively with the aliphatic pool V (r = −0.439, p < 0.001) and semisolid MT pool VI (r = −0.597, p < 0.001).
Fig. 5. Correlation between different pool amplitudes of selected regions in the injured spinal cord.
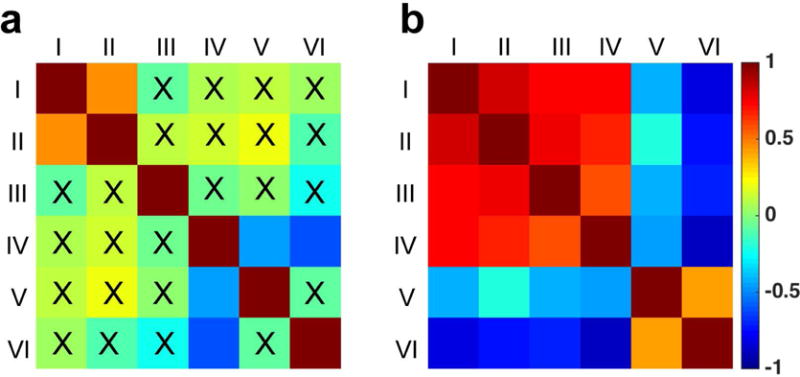
(a) Control region including only normal tissues on the non-lesion side. (b) All regions including normal tissues, abnormal tissues, and cysts. All the pools are the same as defined in Figure 1. The peak amplitudes of different proton pools for all the voxels in the selected ROI were included in the correlation analysis. 0.15 < r < 0.25: small correlation; 0.25 < r < 0.5: moderate correlation; 0.5 < r < 0.75: strong correlation; r > 0.75: very strong correlation. X indicated correlation NOT significant (p ≥ 0.05). Subject SM-P at week 10 after injury shown.
In contrast, Figure 5b shows the inter-pool correlation patterns altered drastically in abnormal tissue regions at/around lesion site. In general, the inter-pool correlations became significantly stronger than those of normal tissue. The amplitudes of pools I–IV were all positively correlated with each other (r > 0.741, p < 0.001) whereas they were negatively correlated with those of pools V and VI (Fig. 5b). Pool V showed small to moderate negative correlations with pools I–III (−0.422 < r < −0.208, p < 0.001). Pool VI showed moderate positive correlations with pool V (r = 0.417, p < 0.001) and strong negative correlations with pools I–IV (r < −0.691, p < 0.001). Pool IV showed strong positive correlations with pools I–III (r > 0.562, p < 0.001), but moderate negative correlation with pool V (r = −0.460, p < 0.001). The strongest positive correlation was observed between pools I and II (r = 0.841, p < 0.001), while the strongest negative correlation was observed between pools IV and pool VI (r = −0.880, p < 0.001).
Longitudinal changes of pool amplitudes in the cysts
Changes in the molecular composition of cysts were further characterized over time following SCI, and representative results from subject SM-P are shown in Figure 6 and Supporting Table S3. The size of the cyst peaked at 11.572 mm3 around week 10 but shrank to 3.320 mm3 at week 24 after the injury (Fig. 6a). Compared to the amplitudes of the constituents of normal GM, pools I–III were high and pools V and VI were low in cyst at its peak size (week 10 after injury, Fig. 6b). At week 12, pools II and III decreased first, while pool I stayed high and pools V and VI slightly increased. By week 24, pools I and II were slightly lower whereas pool III was higher than those of normal GM tissue. Pools V and VI increased slightly and pool IV decreased during the recovery, but they were still significantly different from those of normal GM tissue. Even six months after SCI for this subject, the cyst did not fully disappear, although it shrank in size, and its molecular composition was different from that of normal tissues. Longitudinally, the subject showed significant reduction of CEST effects in abnormal tissues and cysts at/around the lesion site during the recovery (Fig. 7). Over a period of 24 weeks, abnormal tissue (AT1-2) and cyst regions (Cyst1-3) at/around the lesion site exhibited significantly reduced CEST effects, along with the shrinking in size.
Fig. 6. Longitudinal quantification of multiple pools of the Z-spectra of the cyst.
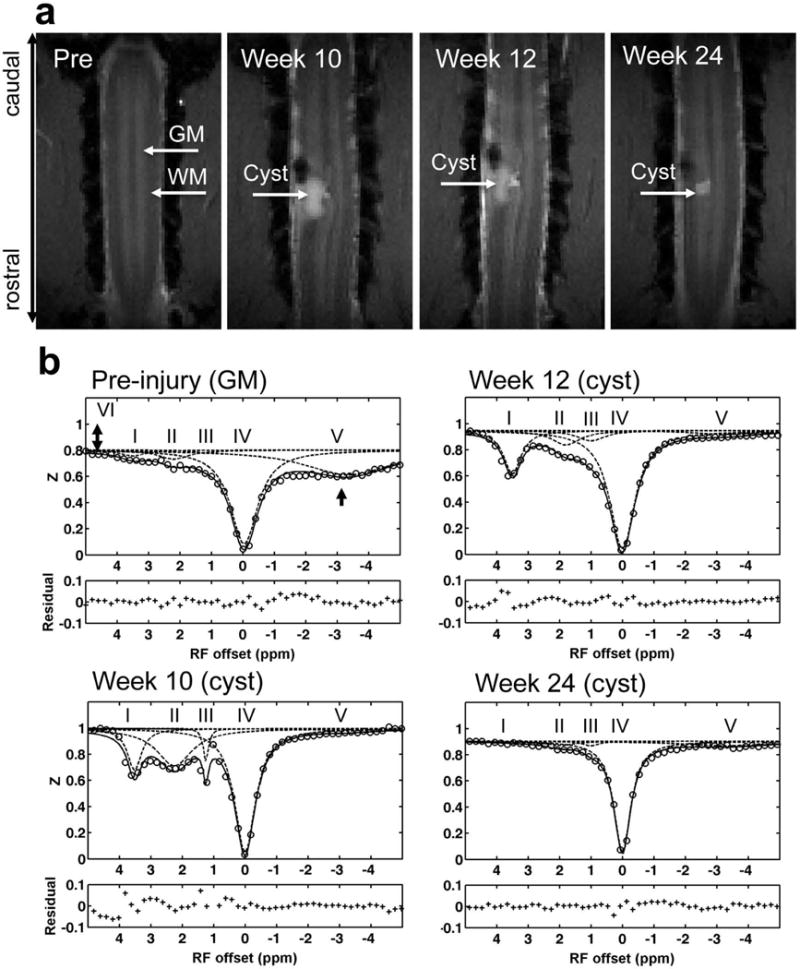
(a) Anatomical MTC images acquired at pre- and different time points post-lesion. The scar tissue appears as a black hole and the cyst shows as a high intensity patch on each image. (b) Decompositions of Z-spectra with fittings at different time points of post-injury week 10, week 12 and week 24. Subject SM-P after injury shown.
Fig. 7. Longitudinal mapping of CEST effects (pools I–III).
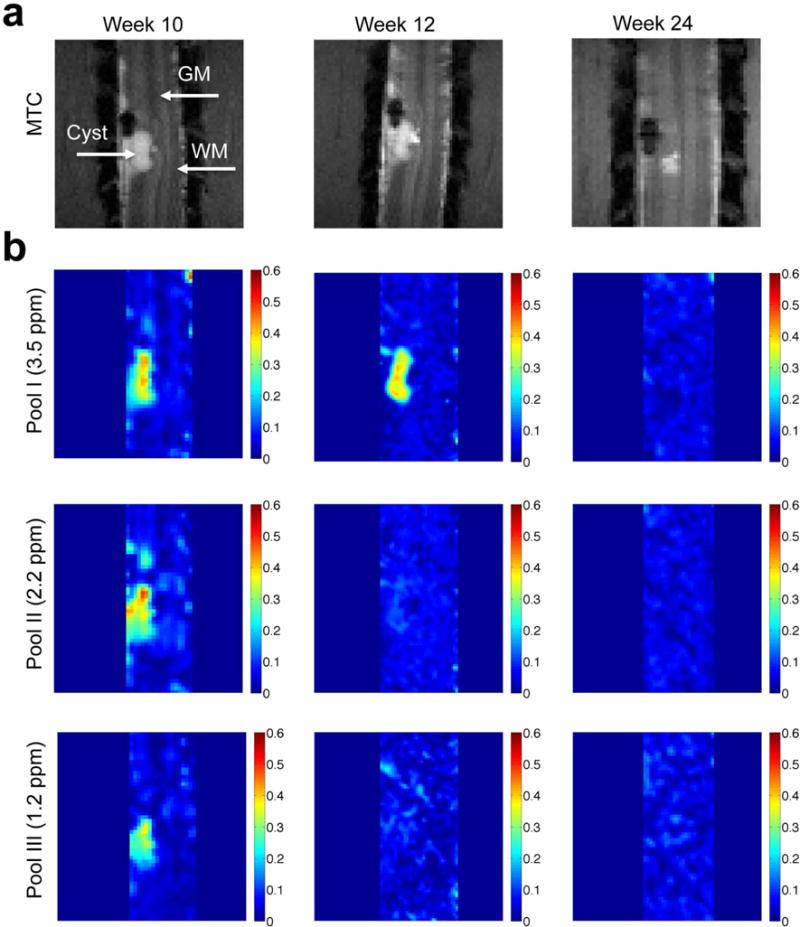
(a) Anatomical MTC images show the lesion and cyst formation. (b) The amplitude maps at different RF offsets at different time points of post-injury week 10, week 12 and week 24. Subject SM-P after injury shown.
Group quantification of the time courses of different pool amplitudes within cyst across subjects with SCI
We found that even with careful placement of each spinal cord section in our subjects, remarkable cross-subject differences in the pathological process and recovery were observed over time. For example, only one SCI subject (SM-P) showed the formation of a large scar, whereas two subjects (SM-P and SM-G) exhibited CEST changes in abnormal tissue caudal to the lesion (AT2) after injury (Figs. 3&7) [6]. Thus, we quantified only the time courses of pool amplitude changes of the cyst at the group level. Across subjects, the overall trends are very similar to those illustrated in Figure 6. We observed similar changes in pools I–VI in the cyst regions at a group level (Fig. 8). Figure 8 shows that the amplitudes of pools I–IV reached a similar peak at largest cyst size (PP) and then returned close to the normal level at the end point (EP). In contrast, amplitudes of pools V and VI changed in completely different ways, with very low amplitude at the cyst peak time (PP) returning to some extent by the end of the study (EP). Across all six pools, the amplitudes did not return to normal levels except for pool III at the end of the study. While all pools I–VI showed changes towards the baseline level during recovery, they did not fully recover over the duration of our studies (Fig. 8). We also did not observe full structural recovery from the lesions for all the subjects at EP, even though their behaviors returned to pre-lesion levels.
Fig. 8. Group longitudinal quantifications of pool amplitudes of the cysts during recovery.
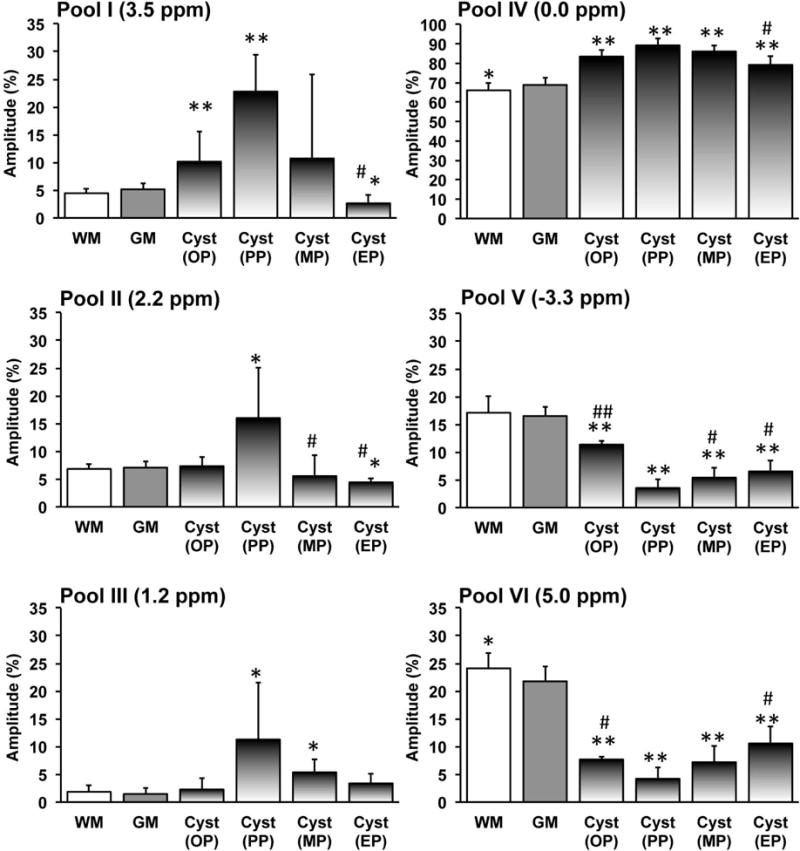
Percent peak amplitudes (mean and standard deviation across subjects) for pools I–V and percent MTIM value for pool VI of GM and WM (12 normal subjects) and the cysts (5 SCI subjects). Cyst development has been divided into four periods. The stage when cyst occurred was defined as onset (OP), the stage when the CEST effect of cyst was maximum during the progress was defined as peak (PP), the stage when the CEST effect of cyst was minimum was defined as end since it is the end time point in the longitudinal study (EP), and the stage between PP and EP is defined as middle point during recovery (MP). * p < 0.05 and ** p < 0.001 vs. relative value of normal GM. # p < 0.05 and ## p < 0.001 vs. relative value at peak point (PP).
The relationships between individual pool amplitudes and cyst sizes at different time points are summarized (Fig. 9 and Supporting Fig. S5). The amplitudes of pools I–IV peaked (Supporting Fig. S5), while those of pools V–VI reduced to zero, when the cysts were their largest. These trends are more prominent on the 2D correlation plot (Fig. 9a). During recovery, pools I–IV positively correlated with each other, and pools V–VI did the same. However, pools I–IV showed negative correlations with pools V–VI, indicating their reverse longitudinal trends during recovery. Cyst sizes showed strong positive correlations to amplitudes of pools I–IV, but strong negative correlation to those of pools V and VI (Fig. 9a). We observed significant correlations between structural changes and molecular compositions within the cysts (Fig. 9b) during recovery.
Fig. 9. Correlations between pool amplitudes and cyst sizes.
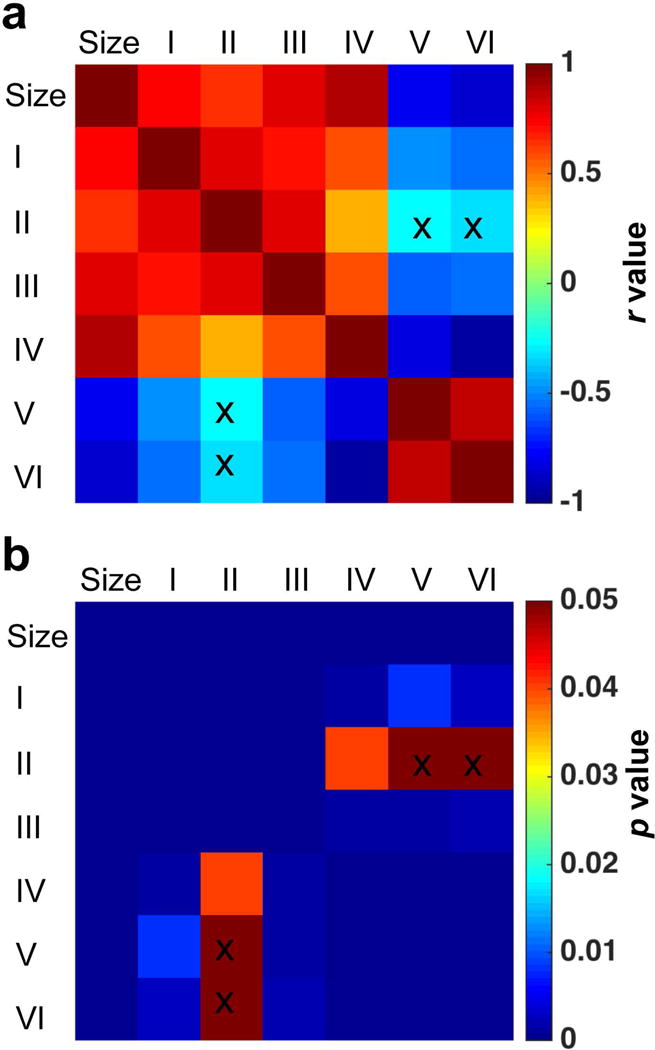
(a–b) The correlation r and p values. Pool amplitudes and sizes of cysts at OP, PP, MP and EP stages (Supporting Fig. S5) after injury, were included in the correlation analysis. The cross markers indicated the correlations NOT significant (p ≥ 0.05).
Correlations between amplitudes of different pools and the behavioral measures
The severity of behavioral deficits qualitatively related to the size and magnitudes of MRI detected molecular composition changes in the cysts (Fig. 10). Figure 10a shows the changes of cyst size during recovery for four monkeys. The sizes of cysts varied across subjects, with mean and standard deviation of 6.848 ± 3.486 mm3 observed at the peak time point. The individual changes of pool I amplitudes are shown in Figure 10b. Subjects SM-P and SM-G, who developed large cysts/abnormal tissues, exhibited severe behavioral deficiencies. Other subjects showed moderate hand use impairment; the cysts formed in these subjects were small, and the related changes of CEST effects during the progression were also relatively small compared to those in subjects SM-P and SM-G (Fig. 10a–b).
Fig. 10. Relations between longitudinal changes of cyst size and pool I amplitude and behavioral recovery.
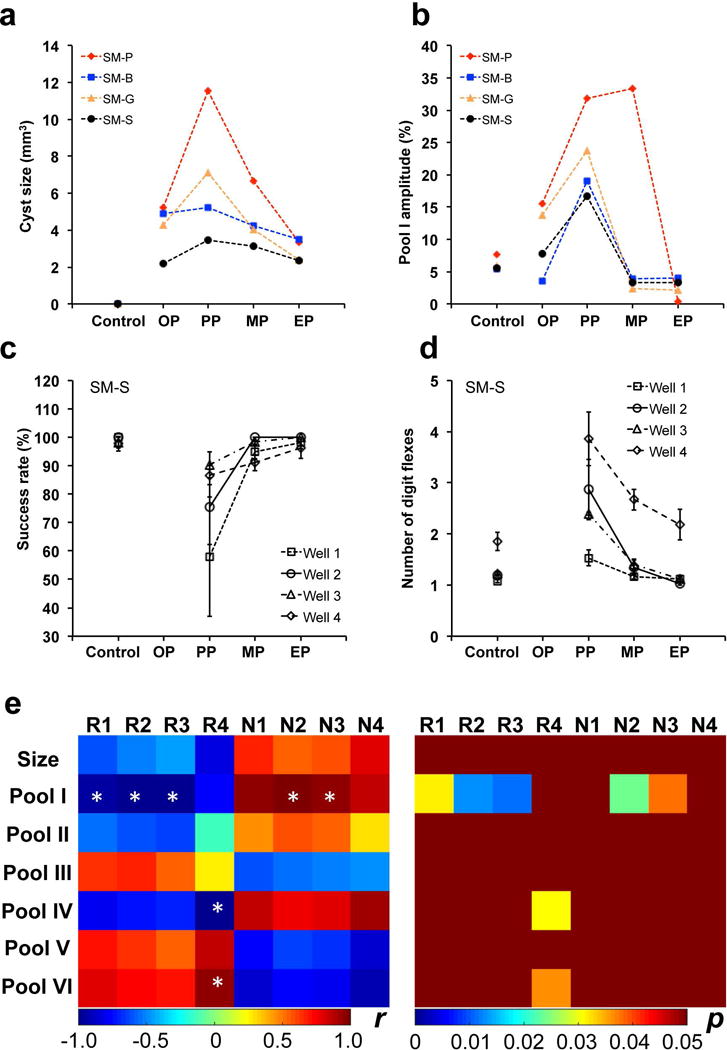
(a–b) Individual longitudinal changes of cyst size and amplitude of pool I (3.5 ppm RF offset) from MRI. The stages OP, PP, MP, and EP are defined in Figure 8. Note the large individual difference in cyst progression after injury across subjects. (c–d) Success rates and number of digit flexes showing the longitudinal behavior deficits for SM-S during recovery. (e) Correlations between cyst sizes, cyst pool amplitudes, and behavioral measures during recovery. R1–R4: Success rates for well 1–4, respectively; N1–N4: Number of digit flexes for well 1–4, respectively. * p < 0.05.
Lastly, we examined the relationships between the sizes of cysts, amplitudes of different pools, and the behavioral measures of hand use impairment (i.e., success rate and number of flexes on food retrieval). Figure 10e shows these quantitative correlations observed in one subject (SM-S). Two behavior measures of success rate (R) and number of flexes (N) showed drastic behavioral impairments immediately after DCL (Fig. 10c,d). Importantly, we observed a general association between the largest cyst sizes (Fig. 10a), highest levels of pool I (Fig. 10b), and the highest degrees of hand use impairments (Fig. 10c,d) during recovery. The subject was unable to perform tasks, and so these measures at the starting time point (OP) were not available. The most severe deficits, indicated by significant drops of successful rates and increases of number of flexes needed to retrieve a food pellet from four wells, occurred when the cyst was largest (compare black lines in a & b with those in c &d for SM-S). Pair-wise correlations showed these patterns clearly (Fig. 10e). The size of cyst and the amplitudes of pool I, II and IV correlated negatively with the success rate, but positively with the number of flexes. The amplitudes of pools III, V and VI exhibited opposite correlation patterns (Fig. 10e). Statistically, however, significant correlations were detected only between pool I and both behavioral measures. Pools IV and VI also exhibited significant correlation with success rates at well 4 specifically. Further quantitative correlations need to be investigated across injured subjects.
DISCUSSION
In this study, we quantitatively analyzed Z-spectra to describe the regional changes around lesion sites during the progression and recovery after SCI. The amplitudes of multiple proton pools were sensitive to SCI, and provided characteristic regional and temporal molecular profiles associated with different abnormal features. The results from the current study provide more comprehensive and quantitative information about the injured spinal cord than what was obtained from CEST imaging using our previous approach [6].
Amplitudes of multiple proton pools and their physiological sources
We demonstrated for the first time that a simple model fitting of Z-spectra permitted sensitive detection of subtle changes in different regions of injured spinal tissue. Based on known CEST properties of tissues, it is likely that the peak from pool I at 3.5 ppm offset corresponds to chemical exchange between backbone amide groups (mobile proteins and peptides) and bulk water, while pool II at ~2 ppm RF offset relates to the amine groups from protein and peptide side chains or free amino acids [33, 34]. Glucose/glycogen/glycosaminoglycan hydroxyl protons likely are the physiological origin of pool III at 1.2 ppm [14, 23, 35]. Pool IV is highly associated with tissue water composition (e.g., edema and cysts), although only a limited number of studies have reported variations in this pool [14]. The physiological origin of the peak from pool V is more complicated, but one generally accepted contribution is cross relaxation from dipolar coupling between mobile macromolecules and bulk water [35].
Our regional spectral quantifications provide MRI evidence for the presence of complex pathological processes in tissues, which could include inflammation, demyelination [7], release of neurotransmitter byproducts, and formation of cysts in different regions of spinal tissue surrounding the lesion sites [36]. For example, demyelination occurred primarily in spinal cord tissues both rostral and caudal to the lesion sites, and may be reflected in the immobile macromolecular pool VI in Figure 4f. This observation is consistent with our previous measurements of qMT that were later confirmed with tissue myelin stain [7]. Cysts were formed only on the lesion side and were located next to WM showing dorsal column demyelination. The transient increases of amide, amine and hydroxyl pools I–III, along with decreases of mobile macromolecular pool V and immobile macromolecular pool VI amplitudes in cysts, may be associated with the release of byproducts from the degradation of neurotransmitters and demyelination processes. The abnormal tissues caudal to the lesion (AT2) also showed transient increases in amide, amine, and hydroxyl pools I–III but on a smaller scale, possibly due to inflammation. Abnormal tissues (AT1) close to CSF showed unusually higher pool III and lower immobile macromolecular pool VI levels than other abnormal tissues (Fig. 3), which might indicate another contribution from non-protein sources (e.g., glucose in CSF from partial volume effects).
Tissue necrosis and surrounding scar tissues showed hypointense signals (Supporting Fig. S4) on T2-weighted spin echo images, as well as different molecular composition profiles (Figs. 3&4). The reduction of amine and amide amplitudes (pools I and II values) in scar tissue could be due to cell death (Figs. 3&4). A similar finding was reported in necrotic muscle tissue [13]. The scar tissue properties were later confirmed by post-mortem tissue histological staining [7]. Differences in T1 may also affect the magnitudes of CEST effects. Across all abnormal tissue regions, cysts showed the longest T1 [7]. The amplitude of the Z-spectrum at different RF offset is a function of the resonance frequency, relaxation rates, exchange rate and concentration.
Interpretation of inter-pool correlations
Compared to normal spinal tissue, we observed quite different inter-pool correlation patterns after injury to the spinal cord, indicating that some of the constituents covary. In normal spinal tissues (GM and WM) (Fig. 5a), the negative correlation observed between free water pool IV and semisolid MT or aliphatic proton pool VI is not surprising, as water dilutes the effects of macromolecules. The strong correlations between amide and amine pools likely indicate that both amides and amines originate from the same source, such as mobile proteins and peptides, in normal spinal cord tissues. After injury, spinal tissue exhibited degradation of macromolecules and the release of small peptides and amino acids, as evidenced by the significant negative correlation between the solid MT and CEST effects. Degradation of the protein backbone likely contributes to the strongest correlation between amine and amide peaks.
Advantages and challenges of multi-pool high-field CEST imaging
In the present study, we demonstrated the advantages of a multi-pool model for quantifying the molecular composition changes in spinal tissue after traumatic injury. The use of high field (9.4 T) is crucial. The high SNR (around 50, 70, 110 and 200 for scar, WM, GM and cyst, respectively) enhances the sensitivity for detecting differences in molecular composition and permit higher resolution images for regional quantitative assessments. Improving tissue segmentation accuracy is important because spinal cord imaging is known to be sensitive to partial volume effects from neighboring tissues and CSF pulsation. Additionally, separation of the multiple effects is more reliable since the differences in resonant frequencies of exchanging species increase with the field strength.
Clinical relevance of imaging and tracking tissue molecular composition changes in injured spinal cord tissue
The altered CEST, NOE, semisolid MT, and DS effects reflect changes in the local chemical environment and compositions of tissue associated with SCI that are linked to altered cellular metabolism pathways, inflammation, and apoptosis. Our observations of regional tissue property changes presented in this study are consistent with our histological evaluations in these animals, in which signature features of cyst formation, tissue and cell properties of the scar, and the presence of reactivated glia and microglia are all observed [6]. The histological features were also in line with observations in rats at up to 6 weeks after contusion injuries of the spinal cord [37–40]. The histological features of the spinal cord tissue at the lesion sites are quite similar to previous descriptions of the cyst in other models of SCI [41, 42]. The ability to noninvasively assess cyst and scar tissue formations is extremely important for both preclinical and clinical studies because the cyst and scar around the lesion are the two main obstacles for axon regeneration and functional recovery. Several ongoing studies and clinical trials are focused on replacing the cyst or scar tissue with stem cells or peripheral nerves to promote or assist axons´ reaching their targets. In this respect, changes of multiple proton pools may be valuable for monitoring the spontaneous recovery of spinal cord from injury and for evaluating the effects and outcomes of therapeutic interventions. The temporal association between the recovery of spinal structural and cellular features and the improvement of impaired hand use behavior might indicate a rebuilding and recovery of a spinal functional pathways that are important for hand uses.
CONCLUSIONS
Quantitative measurements using MRI of multiple proton pools can be effective for detecting and monitoring SCIs in NHPs. We have demonstrated that imaging multiple proton pool transfer effects offers a novel way for regional detection and longitudinal quantification of the macromolecular composition of different parts of the injured spinal cord tissues surrounding the injury, and for providing relevant comprehensive structural and molecular information that may have contributed to the spontaneous behavioral recovery from spinal injury in each subject.
Supplementary Material
SUP. Table S1. Effects of predominant proton pools from Z-spectrum of normal tissues in spinal cord.
SUP. Table S2. Resolved multiple pools from Lorentzian fitting of regional spectrum.
SUP. Table S3. Longitudinal variations of multiple pools for cysts.
SUP. FIG. S1. Representative CEST SE-EPI image, ΔB0 map, and comparison of representative spectra of GM and WM in normal spinal cord of squirrel monkey.
SUP. FIG. S2. Characterization of regional Z-spectra for additional cyst regions.
SUP. FIG. S3. Parametric maps from conventional analysis of Z-spectra.
SUP. FIG. S4. CEST SE-EPI image and ΔBo map after SCI.
SUP. FIG. S5. Changes of pool amplitude and cyst size.
Acknowledgments
We thank Mrs. Chaohui Tang and Mr. Fuxue Xin of the Vanderbilt University Institute of Imaging Science for their assistance in animal preparation and care in MRI data collection. This study is supported by NIH grants NS069909 (LMC), NS078680 (JCG), NS093669 (JCG), and NS092961 (JCG and LMC).
Footnotes
SUPPORTING INFORMATION
Additional supporting information may be found in the online version of this article.
References
- 1.Wheeler-Kingshott CA, et al. The current state-of-the-art of spinal cord imaging: applications. Neuro Image. 2014;84:1082–93. doi: 10.1016/j.neuroimage.2013.07.014. [DOI] [PMC free article] [PubMed] [Google Scholar]
- 2.Stroman PW, et al. The current state-of-the-art of spinal cord imaging: methods. NeuroImage. 2014;84:1070–81. doi: 10.1016/j.neuroimage.2013.04.124. [DOI] [PMC free article] [PubMed] [Google Scholar]
- 3.Cohen AB, et al. The relationships among MRI-defined spinal cord involvement, brain involvement, and disability in multiple sclerosis. J Neuroimaging. 2012;22(2):122–8. doi: 10.1111/j.1552-6569.2011.00589.x. [DOI] [PMC free article] [PubMed] [Google Scholar]
- 4.Harel NY, Strittmatter SM. Functional MRI and other non-invasive imaging technologies: providing visual biomarkers for spinal cord structure and function after injury. Exp Neurol. 2008;211(2):324–8. doi: 10.1016/j.expneurol.2008.02.017. [DOI] [PMC free article] [PubMed] [Google Scholar]
- 5.Ford JC, et al. A Method for in-Vivo High-Resolution Mri of Rat Spinal-Cord Injury. Magn Reson Med. 1994;31(2):218–223. doi: 10.1002/mrm.1910310216. [DOI] [PubMed] [Google Scholar]
- 6.Wang F, et al. Multiparametric MRI reveals dynamic changes in molecular signatures of injured spinal cord in monkeys. Magn Reson Med. 2015;74:1125–1137. doi: 10.1002/mrm.25488. [DOI] [PMC free article] [PubMed] [Google Scholar]
- 7.Wang F, et al. Longitudinal assessment of spinal cord injuries in nonhuman primates with quantitative magnetization transfer. Magn Reson Med. 2016;75(4):1685–96. doi: 10.1002/mrm.25725. [DOI] [PMC free article] [PubMed] [Google Scholar]
- 8.Yang PF, Wang F, Chen LM. Differential fMRI Activation Patterns to Noxious Heat and Tactile Stimuli in the Primate Spinal Cord. J Neurosci. 2015;35(29):10493–502. doi: 10.1523/JNEUROSCI.0583-15.2015. [DOI] [PMC free article] [PubMed] [Google Scholar]
- 9.Chen LM, et al. Injury alters intrinsic functional connectivity within the primate spinal cord. Proc Natl Acad Sci U S A. 2015;112(19):5991–6. doi: 10.1073/pnas.1424106112. [DOI] [PMC free article] [PubMed] [Google Scholar]
- 10.Qi HX, et al. Spatiotemporal trajectories of reactivation of somatosensory cortex by direct and secondary pathways after dorsal column lesions in squirrel monkeys. Neuroimage. 2016;142:421–443. doi: 10.1016/j.neuroimage.2016.08.015. [DOI] [PMC free article] [PubMed] [Google Scholar]
- 11.Qi HX, et al. Impairment and recovery of hand use after unilateral section of the dorsal columns of the spinal cord in squirrel monkeys. Behavioural Brain Research. 2013;252:363–376. doi: 10.1016/j.bbr.2013.05.058. [DOI] [PMC free article] [PubMed] [Google Scholar]
- 12.Reed JL, et al. Plasticity and Recovery After Dorsal Column Spinal Cord Injury in Nonhuman Primates. Journal of Experimental Neuroscience. 2016;10:11–21. doi: 10.4137/JEN.S40197. [DOI] [PMC free article] [PubMed] [Google Scholar]
- 13.Desmond KL, Moosvi F, Stanisz GJ. Mapping of amide, amine, and aliphatic peaks in the CEST spectra of murine xenografts at 7 T. Magn Reson Med. 2014;71(5):1841–53. doi: 10.1002/mrm.24822. [DOI] [PubMed] [Google Scholar]
- 14.Wang F, et al. Mapping murine diabetic kidney disease using chemical exchange saturation transfer MRI. Magn Reson Med. 2015;76(5):1531–1541. doi: 10.1002/mrm.26045. [DOI] [PMC free article] [PubMed] [Google Scholar]
- 15.Zhang XY, et al. A new NOE-mediated MT signal at around-1.6 ppm for detecting ischemic stroke in rat brain. Magn Reson Imaging. 2016;34(8):1100–1106. doi: 10.1016/j.mri.2016.05.002. [DOI] [PMC free article] [PubMed] [Google Scholar]
- 16.Wolff SD, Balaban RS. Nmr Imaging of Labile Proton-Exchange. J Magn Reson. 1990;86(1):164–169. [Google Scholar]
- 17.Wolff SD, Balaban RS. Magnetization transfer contrast (MTC) and tissue water proton relaxation in vivo. Magn Reson Med. 1989;10(1):135–44. doi: 10.1002/mrm.1910100113. [DOI] [PubMed] [Google Scholar]
- 18.Wolff SD, Eng J, Balaban RS. Magnetization transfer contrast: method for improving contrast in gradient-recalled-echo images. Radiology. 1991;179(1):133–7. doi: 10.1148/radiology.179.1.2006263. [DOI] [PubMed] [Google Scholar]
- 19.van Zijl PC, et al. Mechanism of magnetization transfer during on-resonance water saturation. A new approach to detect mobile proteins, peptides, and lipids. Magn Reson Med. 2003;49(3):440–9. doi: 10.1002/mrm.10398. [DOI] [PubMed] [Google Scholar]
- 20.Zhang XY, et al. MR imaging of a novel NOE-mediated magnetization transfer with water in rat brain at 9.4 T. Magn Reson Med. 2016 doi: 10.1002/mrm.26396. [DOI] [PMC free article] [PubMed] [Google Scholar]
- 21.Jones CK, et al. Amide proton transfer imaging of human brain tumors at 3T. Magn Reson Med. 2006;56(3):585–92. doi: 10.1002/mrm.20989. [DOI] [PubMed] [Google Scholar]
- 22.Zhou J, et al. Practical data acquisition method for human brain tumor amide proton transfer (APT) imaging. Magn Reson Med. 2008;60(4):842–9. doi: 10.1002/mrm.21712. [DOI] [PMC free article] [PubMed] [Google Scholar]
- 23.van Zijl PC, et al. MRI detection of glycogen in vivo by using chemical exchange saturation transfer imaging (glycoCEST) Proc Natl Acad Sci U S A. 2007;104(11):4359–64. doi: 10.1073/pnas.0700281104. [DOI] [PMC free article] [PubMed] [Google Scholar]
- 24.Ren JM, et al. Evidence from transgenic mice that glucose transport is rate-limiting for glycogen deposition and glycolysis in skeletal muscle. J Biol Chem. 1993;268(22):16113–5. [PubMed] [Google Scholar]
- 25.Sun PZ, Sorensen AG. Imaging pH using the chemical exchange saturation transfer (CEST) MRI: Correction of concomitant RF irradiation effects to quantify CEST MRI for chemical exchange rate and pH. Magn Reson Med. 2008;60(2):390–7. doi: 10.1002/mrm.21653. [DOI] [PubMed] [Google Scholar]
- 26.Sun PZ, et al. Investigation of optimizing and translating pH-sensitive pulsed-chemical exchange saturation transfer (CEST) imaging to a 3T clinical scanner. Magn Reson Med. 2008;60(4):834–41. doi: 10.1002/mrm.21714. [DOI] [PMC free article] [PubMed] [Google Scholar]
- 27.Liu GS, et al. NOrmalized MAgnetization Ratio (NOMAR) filtering for creation of tissue selective contrast maps. Magn Reson Med. 2013;69(2):516–523. doi: 10.1002/mrm.24271. [DOI] [PMC free article] [PubMed] [Google Scholar]
- 28.Jin T, et al. MR imaging of the amide-proton transfer effect and the pH-insensitive nuclear overhauser effect at 9.4 T. Magnetic resonance in medicine : official journal of the Society of Magnetic Resonance in Medicine / Society of Magnetic Resonance in Medicine. 2013;69(3):760–70. doi: 10.1002/mrm.24315. [DOI] [PMC free article] [PubMed] [Google Scholar]
- 29.Kim M, et al. Water saturation shift referencing (WASSR) for chemical exchange saturation transfer (CEST) experiments. Magn Reson Med. 2009;61(6):1441–50. doi: 10.1002/mrm.21873. [DOI] [PMC free article] [PubMed] [Google Scholar]
- 30.Pluim JP, Maintz JB, Viergever MA. Mutual-information-based registration of medical images: a survey. IEEE Trans Med Imaging. 2003;22(8):986–1004. doi: 10.1109/TMI.2003.815867. [DOI] [PubMed] [Google Scholar]
- 31.Qi HX, Chen LM, Kaas JH. Reorganization of somatosensory cortical areas 3b and 1 after unilateral section of dorsal columns of the spinal cord in squirrel monkeys. J Neurosci. 2011;31(38):13662–75. doi: 10.1523/JNEUROSCI.2366-11.2011. [DOI] [PMC free article] [PubMed] [Google Scholar]
- 32.Chen LM, Qi HX, Kaas JH. Dynamic reorganization of digit representations in somatosensory cortex of nonhuman primates after spinal cord injury. J Neurosci. 2012;32(42):14649–63. doi: 10.1523/JNEUROSCI.1841-12.2012. [DOI] [PMC free article] [PubMed] [Google Scholar]
- 33.Togao O, et al. Characterization of lung cancer by amide proton transfer (APT) imaging: an in-vivo study in an orthotopic mouse model. PLoS One. 2013;8(10):e77019. doi: 10.1371/journal.pone.0077019. [DOI] [PMC free article] [PubMed] [Google Scholar]
- 34.Jin T, et al. Magnetic resonance imaging of the Amine-Proton EXchange (APEX) dependent contrast. Neuroimage. 2012;59(2):1218–27. doi: 10.1016/j.neuroimage.2011.08.014. [DOI] [PMC free article] [PubMed] [Google Scholar]
- 35.van Zijl PCM, Yadav NN. Chemical Exchange Saturation Transfer (CEST): What is in a Name and What Isn’t? Magn Reson Med. 2011;65(4):927–948. doi: 10.1002/mrm.22761. [DOI] [PMC free article] [PubMed] [Google Scholar]
- 36.Bilgen M, et al. Longitudinal magnetic resonance imaging of spinal cord injury in mouse: changes in signal patterns associated with the inflammatory response. Magn Reson Imaging. 2007;25(5):657–64. doi: 10.1016/j.mri.2006.10.009. [DOI] [PubMed] [Google Scholar]
- 37.Thuret S, Moon LD, Gage FH. Therapeutic interventions after spinal cord injury. Nat Rev Neurosci. 2006;7(8):628–43. doi: 10.1038/nrn1955. [DOI] [PubMed] [Google Scholar]
- 38.Silver J, Miller JH. Regeneration beyond the glial scar. Nat Rev Neurosci. 2004;5(2):146–56. doi: 10.1038/nrn1326. [DOI] [PubMed] [Google Scholar]
- 39.Yezierski RP. Pain following spinal cord injury: pathophysiology and central mechanisms. Prog Brain Res. 2000;129:429–49. doi: 10.1016/S0079-6123(00)29033-X. [DOI] [PubMed] [Google Scholar]
- 40.Beattie MS, et al. Endogenous repair after spinal cord contusion injuries in the rat. Exp Neurol. 1997;148(2):453–63. doi: 10.1006/exnr.1997.6695. [DOI] [PubMed] [Google Scholar]
- 41.Jones TB, McDaniel EE, Popovich PG. Inflammatory-mediated injury and repair in the traumatically injured spinal cord. Curr Pharm Des. 2005;11(10):1223–36. doi: 10.2174/1381612053507468. [DOI] [PubMed] [Google Scholar]
- 42.Yang L, et al. Excitotoxic model of post-traumatic syringomyelia in the rat. Spine. 2001;26(17):1842–9. doi: 10.1097/00007632-200109010-00004. [DOI] [PubMed] [Google Scholar]
Associated Data
This section collects any data citations, data availability statements, or supplementary materials included in this article.
Supplementary Materials
SUP. Table S1. Effects of predominant proton pools from Z-spectrum of normal tissues in spinal cord.
SUP. Table S2. Resolved multiple pools from Lorentzian fitting of regional spectrum.
SUP. Table S3. Longitudinal variations of multiple pools for cysts.
SUP. FIG. S1. Representative CEST SE-EPI image, ΔB0 map, and comparison of representative spectra of GM and WM in normal spinal cord of squirrel monkey.
SUP. FIG. S2. Characterization of regional Z-spectra for additional cyst regions.
SUP. FIG. S3. Parametric maps from conventional analysis of Z-spectra.
SUP. FIG. S4. CEST SE-EPI image and ΔBo map after SCI.
SUP. FIG. S5. Changes of pool amplitude and cyst size.


