Abstract
Purpose
Our aim was to apply flow distribution analysis in the entire aorta across a wide age range from pediatric to adult subjects.
Material and methods
98 healthy subjects (age 9–78 years, 41 women) underwent 4D flow MRI at 1.5T and 3T for the assessment of 3D blood flow in the thoracic aorta. Subjects were categorized into age groups: group 1 (n=9, 5 women):9–15 years; group 2 (n=13, 8 women):16–20 years; group 3 (n=27, 14 women):21–39 years; group 4 (n=40, 11 women):40–59 years; group 5 (n=9, 3 women): >60 years. Data analysis included the 3D segmentation of the aorta, aortic valve peak velocity, mid-ascending aortic diameter, and calculation of flow velocity distribution descriptors (mean, median, standard deviation, incidence of velocities >1 m/s, skewness, and kurtosis of aortic velocity magnitude). Ascending aortic diameter was normalized by body surface area.
Results
Age was significantly associated with normalized aortic diameter (R= 0.73, P<0.001), skewness (R= 0.76, P<0.001) and kurtosis (R= 0.74, P<0.001), all adjusted by heart rate. Aortic peak velocity and velocity distribution descriptors, adjusted by heart rate, were significantly different between age groups (P<0.001, ANCOVA). Skewness and kurtosis significantly increased (P<0.001) during adulthood (>40 years) as compared with childhood (<21 years). Men and women revealed significant differences (P≤0.05) for peak velocity, incidence, mean, median, standard deviation and skewness, all adjusted by heart rate.
Conclusions
Aortic hemodynamics significantly change with age and gender, indicating the importance of age and gender matched control cohorts for the assessment of the impact of cardiovascular disease on aortic blood flow.
Keywords: Aorta, aging, heart valve disease, 4D flow MRI
INTRODUCTION
Blood flow is essential to understand the pathophysiology and development of cardiovascular diseases caused by altered aortic hemodynamics in adults and children(1–7). Time-resolved 3D phase-contrast MRI with three-directional velocity encoding (4D flow MRI) has been successfully applied for the analysis of altered hemodynamics in cardiovascular disease(8–10). 4D flow MRI data analysis is time consuming and the inherent volumetric 3D coverage is often not fully utilized by analysis based on 2D planes(11–13). Recently, statistical distribution analysis of blood flow velocity magnitude has been developed to overcome these limitations by providing an efficient workflow that exploits the full volumetric coverage and detects changes in vascular hemodynamics(14–16).
However, it is important to understand age and gender related differences to reliably identify altered aortic blood flow associated with disease. Previous studies assessed the impact of aging and gender on thoracic aortic morphology(17–20). It has been shown that age influences aortic size and biomechanical tissue properties (compliance and elasticity)(21) in healthy subjects by affecting the pulse wave velocity along the aorta(20,22,23). These studies showed that pulse wave velocity increases with age and is higher in women(24,25). Recent studies reported a positive association between aortic peak systolic velocity with age without significant differences between men and women(26,27). In addition, left ventricular flow patterns related to age and gender showed significant differences(28). Nevertheless, the age- and gender- dependence of blood flow velocity within the thoracic aorta are not well characterized in healthy subjects. A systematic statistical distribution analysis of blood flow velocity across a wide range of ages, from childhood to adulthood may provide a better understanding of cardiovascular diseases.
The aim of this study was to systematically apply statistical distribution analysis of 4D flow MRI derived velocity magnitude (speed) throughout the entire volume of the thoracic aorta across gender and a broad range of ages, spanning from pediatric to adult.
MATERIALS AND METHODS
Study population
For this study, 98 healthy subjects (age = 38±17 years, age range = 9–78, women = 41) were enrolled. All subjects underwent 4D flow MRI between 2012 and 2015 based on an IRB-approved protocol in aortic valve diseases allowing the recruitment of healthy volunteers. Informed consent was obtained from all participants. Data from all healthy subjects were retrospectively collected and analyzed. From the collected data, 20 subjects had repeated studies within 1 month (n=9), 1–3 months (n=5), and 3–6 months (n=6). Repeated studies were used to assess the repeatability of velocity distribution descriptors. Exclusion criteria, based in subject interview before the enrollment, included: any evidence of cardiac disease, hypertension, ECG abnormality, any evidence of atherosclerotic disease. Further examinations to confirm health condition were not conducted. Each subject was categorized into one of five age groups: group 1 (n=9, 5 women): 9–15 years; group 2 (n=13, 8 women): 16–20 years; group 3 (n=27, 14 women): 21–39 years; group 4 (n=40, 11 women): 40–59 years; group 5 (n=9, 3 women): >60 years.
Magnetic resonance imaging
Image acquisition was performed at 1.5T (n = 60) and 3T (n = 38) using Magnetom Espree, Avanto, Aera, and Skyra systems (Siemens Medical Systems, Erlangen, Germany). 4D flow MRI was acquired in a sagittal oblique 3D volume covering the thoracic aorta with prospective ECG-gating and a respiratory navigator(29). Pulse sequence parameters for all subjects were as follows: spatial resolution = 1.6–2.5×1.6–2.5×2.2–3.4 mm3, field of view = 340–400×200–308 mm2, slab thickness = 66–120 mm, temporal resolution = 38–43 ms (13–25 time frames), TE/TR = 2.3–2.8/4.8–5.4 ms, flip angle α = 7–15°, and Venc = 1.5 m/s.
Data analysis
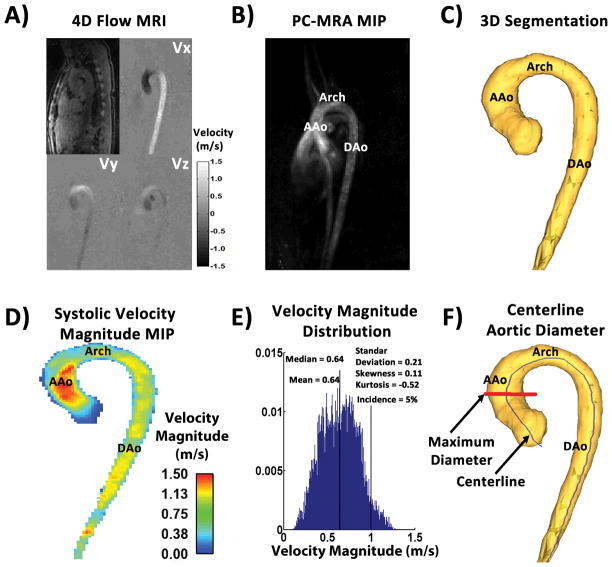
4D flow MRI data (Fig. 1A) were corrected for eddy currents, Maxwell terms, and velocity aliasing using a custom built software programmed in Matlab (Mathworks, Natick, Ma, USA)(30). A 3D phase contrast MR angiogram (PC-MRA) (Fig. 1B) was computed for each subject using the pre-processed 4D flow MRI data as previously described(29). The 3D PC-MRA was segmented (Mimics, Materialise, Leuven, Belgium) to obtain a 3D volume of the thoracic aorta (Fig. 1C) which was used to compute a masked 4D velocity field (3 spatial dimensions + time). A velocity magnitude (i.e., ) maximum intensity projection (MIP) was generated in an oblique sagittal plane, averaged over three cardiac time frames centered on peak systole (Fig. 1D). Peak systole was defined as the time frame in the cardiac cycle where the velocity magnitude average over the entire volume of the thoracic aorta was maximal. Aortic peak velocity was measured from the velocity magnitude MIP downstream from the aortic valve at the vena contracta region (where the transvalvular velocity reaches its maximum during peak systole). Statistical distribution analysis was performed for each subject by calculating velocity magnitude histograms from all voxels and cardiac time frames and normalized by the total number of voxels within the volume(14,16) (Fig. 1E). The aim was to create a subject specific velocity magnitude histogram that can be compared across subjects and cohorts (i.e. age and gender groups). Velocity magnitude histogram descriptors including mean, median, standard deviation, skewness, kurtosis, and the relative number occurrences of aortic voxels >1m/s (incidence, in %) were calculated for each subject. Skewness provided a measure of velocity distribution asymmetry: a negative skew can be translated as the mass of the distribution concentrated on the right side of the distribution (i.e. higher velocities); a positive skew represents then the concentration of mass on the left side of the distribution (i.e. lower velocities). Kurtosis provided a measure of velocity distribution shape, higher kurtosis (>2) is the result of extreme velocity deviations (i.e. large velocity outliers). Velocity magnitude distribution descriptors, aortic peak velocity and aortic diameter, were summarized using spider plots with the purpose to visually compare averaged and standard deviation values between groups. The maximum mid-ascending aortic diameter was identified and extracted using multiple equidistant sampling planes along a volume centerline (Fig. 1F)(11,26). Centerline nodes were used to create analysis planes perpendicular to the vessel for the calculation of diameter, assuming a circular area. Angulation was verified by the dot product between the centreline node vector and the analysis plane vector. Aortic diameter was normalized by body surface area, i.e. (31). A sensitivity analysis was conducted to identify which fractions of the velocity magnitude distribution (number of time frames and top percent of velocity magnitude) were more sensitive to differences between all groups(14,16). This analysis consisted of a statistical assessment covering the full range of velocities within the segmented volume over all time frames for all parameters included in the spider plots. For our study, sensitivity analysis led to include velocity magnitude from all voxels (i.e. 100% of top velocity magnitude) within the first 8 time frames to compare between groups.
FIGURE 1. Workflow for velocity magnitude distribution analysis.
Panel A shows an example of 4D flow MRI dataset after pre-processing. Panel B shows the maximum intensity projection in the sagittal plane of the 3D PC-MRA calculated from the panel A dataset. Panel C illustrates the aorta segmentation of the 3D PC-MRA. Panel D shows the systolic velocity magnitude MIP in the sagittal plane of masked velocities. Panel E shows the corresponding velocity magnitude histogram within the aortic segmentation. Panel F shows an example of maximum mid-ascending aortic diameter (in red) calculation derived from the centerline (in blue). MIP: Maximum intensity projection. PC-MRA: phase-contrast MR angiogram. AAo: Ascending aorta. DAo: Descending aorta.
Statistical analysis
All continuous data were presented as mean ± standard deviation. A Shapiro-Wilk test was used to evaluate distribution normality for measured parameters. To compare age, height, weight, gender, aortic diameter, and velocity magnitude distribution descriptors between defined age groups, a one-way analysis of variance (Gaussian distribution) or Kruskal-Wallis (non-Gaussian distribution) was performed (P-value<0.05 was considered significant). If these tests determined a significant difference between groups, multiple comparisons were performed using Tukey’s post-hoc test (Gaussian distribution) or Mann-Whitney test (non-Gaussian distribution) to prevent alpha error accumulation. For comparison between gender groups, an independent-sample t-test (Gaussian distribution) was performed (P-value<0.05 was considered significant). Comparisons between groups adjusted to heart rate were performed using stratified Mann-Whitney test or analysis of covariance (ANCOVA) by including heart rate as confounding factor in the test as a covariate. Bonferroni correction was used to adjust for multiple comparisons and the differences were considered significant if P<0.01. The associations between velocity magnitude distribution descriptors and age were assessed by linear regressions analysis. A square root regression fit was also applied between normalized aortic diameter and age based on the assumption that vascular and valve diameters are linearly related to the square root of BSA(32). A multivariate linear regression was performed to assess the association between age or normalized aortic diameter with aortic valve peak velocity, and velocity distribution descriptors adjusted by heart rate. Regression model was generalized to include heart rate as confounding factor. A repeatability test for 20 subjects was evaluated using Bland-Altman analysis for all velocity distribution descriptors. Percentage of absolute error was defined by . Statistical analysis was performed with SPSS 17 (SPSS, Chicago, IL).
RESULTS
Patient characteristics
The demographics of the study groups are summarized in Table 1. Age groups showed significant differences (P<0.001) for age, height, weight, BSA, and normalized aortic diameter. Subjects in group 4 (40–59 years) were taller and had larger body weight compared to the other groups. Group 3 (20–39 years) had larger portion of women (55%). Normalized aortic diameter was smaller in group 1 (9–15 years) as compared with group 4 (>60 years) (9.6±1.2 mm vs. 18.5±1.4 mm, P<0.001). When comparing gender groups, men were older subjects showed higher values for age (P=0.029), height, weight, and BSA (all three with P<0.001).
Table 1.
Subject demographics
| Age Groups | Gender | Overall | ||||||||
|---|---|---|---|---|---|---|---|---|---|---|
|
|
||||||||||
| Parameter | 9–15 years (n=9) | 16–20 years (n=13) | 21–39 years (n=27) | 40–59 years (n=40) | > 60 years (n=9) | P-value | Men (n=57) | Women (n=41) | P-value | n=98 |
| Age (years) | 13±2 | 18±1 | 31±5 | 48±5 | 69±6 | <0.001 | 41±16 | 34±17 | 0.029 | 38±17 |
| Height (m) | 1.56±0.12 | 1.65±0.09 | 1.71±0.11 | 1.75±0.07 | 1.71±0.06 | <0.001 | 1.75±0.08 | 1.64±0.10 | <0.001 | 1.71±0.11 |
| Weight (kg) | 53±13 | 63±15 | 81±20 | 87±18 | 83±13 | <0.001 | 87±19 | 67±16 | <0.001 | 79±20 |
| Body Surface Area (m2) | 1.51±0.24 | 1.69±0.22 | 1.94±0.27 | 2.05±0.22 | 1.99±0.18 | <0.001 | 2.05±0.25 | 1.73±0.24 | <0.001 | 1.92±0.29 |
| Heart Rate (bpm) | 79±8 | 73±12 | 71±10 | 75±12 | 76±17 | 0.543 | 75±12 | 75±11 | 0.859 | 75±12 |
| Women (n) | 5 | 8 | 14 | 11 | 3 | 0.111 | - | - | - | 41 |
| Normalized Aortic Diameter (mm/m2) | 9.6±1.2 | 10.1±1.9 | 15.9±2.4 | 17.1±2.3 | 18.5±1.4 | <0.001 | 15.5±3.4 | 14.9±4.1 | 0.38 | 15.2±3.6 |
Velocity magnitude distribution analysis - influence of heart rate
From velocity distribution descriptors mean (R=−0.228, P=0.028), median (R=−0.231, P=0.026) and skewness (R=0.261, P=0.012) showed significant correlation with heart rate. Velocity magnitude distribution descriptors were adjusted to heart rate for assessing mutual dependence.
Velocity magnitude distribution analysis - influence of age
Velocity magnitude histograms
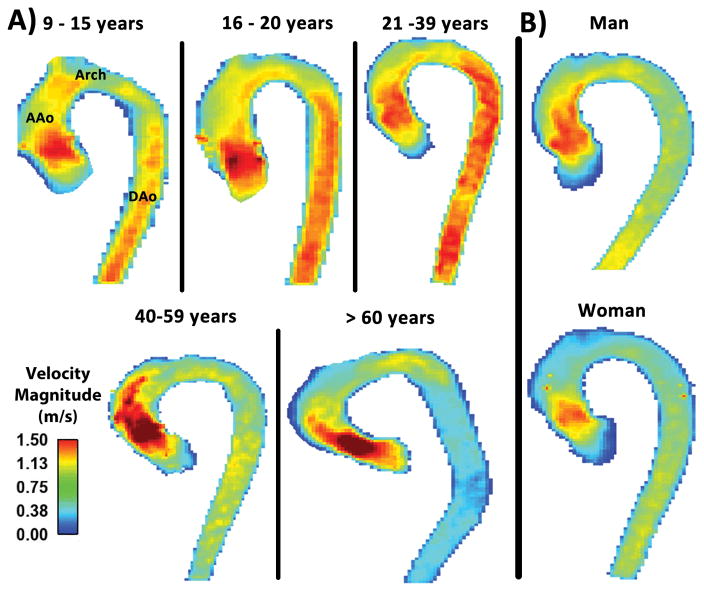
The velocity magnitude distribution analysis was successfully performed in all subjects. Examples of individual velocity magnitude MIPs illustrate the aortic velocity patterns for each age group (Fig. 2A). Averaged velocity magnitude distribution histograms for each age group are shown in Figure 3. Incidence of velocity magnitude > 1 m/s, mean, median and standard deviation decreased from 19% in group 2 (16–20 years) to 4% in group 5 (>60 years), from 0.75 m/s in group 2 (16–20 years) to 0.52 m/s in group 5 (>60 years), from 0.76 m/s in group 2 (16–20 years) to 0.49 m/s in group 5 (>60 years), and from 0.26 m/s in group 1 (9–15 years) to 0.22 m/s in group 5 (>60 years), respectively (Table 2). Histogram skew was displaced to the positive direction (right) across age groups, from −0.15 in group 1 (9–15 years) to 1.45 in group 5 (>60 years). Similarly, histogram kurtosis evolved from platykurtic (flat) to leptokurtic (thin) across age groups, from −0.67 in group 1 (9–15 years) to 3.35 in group 5 (>60 years).
FIGURE 2. Systolic velocity magnitude maximum intensity projection examples.
Panel A shows individual examples of systolic velocity magnitude MIPs in the sagittal plane for all age groups. Panel B shows individual examples of systole velocity magnitude MIPs for gender groups (man 35-year-old and woman 34-year-old). MIPs: Maximum intensity projections. AAo: Ascending aorta. DAo: Descending aorta.
FIGURE 3. Averaged velocity magnitude distribution histograms for all five age groups.

Averaged velocity magnitude distribution histograms are presented by age progression from the top to the bottom. Distribution descriptors are display for each group.
Table 2.
Velocity magnitude distribution summary by age and gender group
| Age Groups | Gender | ||||||||
|---|---|---|---|---|---|---|---|---|---|
|
|
|||||||||
| Parameters | 9–15 years (n=9) | 16–20 years (n=13) | 21–39 years (n=27) | 40–59 years (n=40) | > 60 years (n=9) | P-value | Men (n=57) | Women (n=41) | P-value |
| Aortic Valve Peak Velocity (m/s) | 1.32±0.11 | 1.27±0.16 | 1.07±0.18 | 1.28±0.23 | 1.42±0.33 | <0.001 | 1.28±0.25 | 1.18±0.21 | 0.050 |
| Incidence (rel. # of aortic voxels >1m/s, %) | 18±10 | 19±12 | 12±12 | 6±5 | 4±2 | <0.001 | 10±11 | 11±9 | 0.721 |
| Mean (m/s) | 0.74±0.08 | 0.75±0.10 | 0.68±0.13 | 0.61±0.12 | 0.52±0.09 | <0.001 | 0.64±0.15 | 0.67±0.11 | 0.209 |
| Median (m/s) | 0.75±0.09 | 0.76±0.11 | 0.68±0.14 | 0.59±0.13 | 0.49±0.09 | <0.001 | 0.63±0.16 | 0.67±0.11 | 0.154 |
| Standard Deviation (m/s) | 0.26±0.03 | 0.24±0.04 | 0.22±0.05 | 0.19±0.03 | 0.22±0.06 | <0.001 | 0.21±0.05 | 0.22±0.04 | 0.606 |
| Skewness | −0.15±0.17 | −0.12±0.19 | 0.08±0.31 | 0.77±0.58 | 1.45±0.51 | <0.001 | 0.59±0.73 | 0.24±0.50 | 0.010 |
| Kurtosis | −0.67±0.17 | −0.65±0.15 | −0.41±0.56 | 1.36±1.43 | 3.35±2.03 | <0.001 | 0.99±1.81 | 0.07±1.34 | 0.007 |
Correlation with age and normalized aortic diameter
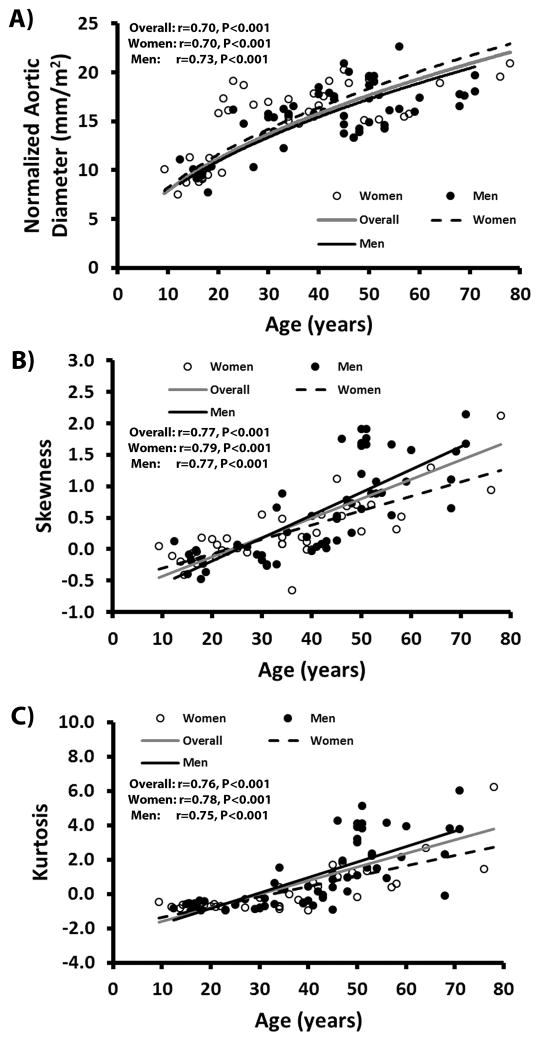
Linear regressions between all velocity magnitude distribution descriptors adjusted by heart rate and age are summarized in Table 3. Figure 4 shows the most significant regression plots with age without heart rate adjustment. Notice that a square root fit between normalized aortic diameter and age (R=0.70, P<0.001, Fig. 4A) provided better physiological trends as a function of age. For velocity magnitude distribution descriptors, the two most prominent associations with age were given by skewness (R=0.77, P<0.001, Fig. 4B) and kurtosis (R=0.76, P<0.001, Fig. 4C). Both skewness and kurtosis remained the most prominent associations after adjusting by heart rate, Table 3. Table 4 summarizes the linear regressions between all velocity magnitude distribution descriptors adjusted by heart rate and normalized aortic diameter. Most significant associations were obtained from skewness (R=0.63, P<0.001), median (R=0.56, P<0.001) and kurtosis (R=0.54, P<0.001).
Table 3.
Linear regressions between velocity magnitude distribution descriptors, adjusted by heart rate, and age
| Overall | Women | Men | ||||
|---|---|---|---|---|---|---|
|
| ||||||
| Parameters | R, SEE | P-value | R, SEE | P-value | R, SEE | P-value |
| Aortic Valve Peak Velocity (m/s) | 0.23, 16.26 | 0.088 | 0.24, 16.69 | 0.380 | 0.41, 14.54 | 0.006 |
|
|
||||||
| Normalized Aortic Diameter (mm/m2) | 0.73, 11.41 | <0.001 | 0.72, 11.93 | <0.001 | 0.73, 10.88 | <0.001 |
|
| ||||||
| Incidence (rel. # of aortic voxels >1m/s, %) | 0.51, 14.38 | <0.001 | 0.53, 14.55 | 0.004 | 0.51, 13.71 | <0.001 |
|
|
||||||
| Mean (m/s) | 0.50, 14.45 | <0.001 | 0.58, 13.97 | 0.001 | 0.46, 14.18 | 0.002 |
|
|
||||||
| Median (m/s) | 0.54, 14.03 | <0.001 | 0.60, 13.77 | 0.001 | 0.51, 13.71 | <0.001 |
|
|
||||||
| Standard Deviation (m/s) | 0.39, 15.40 | 0.001 | 0.65, 13.12 | <0.001 | 0.27, 15.36 | 0.125 |
|
|
||||||
| Skewness | 0.76, 10.86 | <0.001 | 0.74, 11.51 | <0.001 | 0.78, 9.91 | <0.001 |
|
|
||||||
| Kurtosis | 0.74, 11.22 | <0.001 | 0.77, 10.95 | <0.001 | 0.75, 10.56 | <0.001 |
SEE: Standard Error of the Estimate.
FIGURE 4. Scatter plot correlations with age.
Panel A shows the square root fits between normalized mid-ascending aortic diameter and age. Panel B shows the linear correlations between histogram skewness and age. Panel C shows the linear correlations between histogram kurtosis and age. The grey line represents the fit overall subjects. The black line represents the fit for men subjects. The black dashed line represents the fit for women subjects.
Table 4.
Linear regressions between velocity magnitude distribution descriptors, adjusted by heart rate, and normalized aortic diameter
| Overall | Women | Men | ||||
|---|---|---|---|---|---|---|
|
| ||||||
| Parameters | R, SEE | P-value | R, SEE | P-value | R, SEE | P-value |
| Aortic Valve Peak Velocity (m/s) | 0.02, 3.61 | 0.995 | 0.28, 3.82 | 0.258 | 0.15, 3.37 | 0.564 |
|
| ||||||
| Incidence (rel. # of aortic voxels >1m/s, %) | 0.48, 3.16 | <0.001 | 0.39, 3.65 | 0.057 | 0.54, 2.87 | <0.001 |
|
|
||||||
| Mean (m/s) | 0.51, 3.10 | <0.001 | 0.49, 3.45 | 0.010 | 0.53, 2.91 | <0.001 |
|
|
||||||
| Median (m/s) | 0.56, 3.01 | <0.001 | 0.54, 3.34 | 0.003 | 0.56, 2.82 | <0.001 |
|
|
||||||
| Standard Deviation (m/s) | 0.34, 3.39 | 0.004 | 0.36, 3.72 | 0.109 | 0.34, 3.21 | 0.035 |
|
|
||||||
| Skewness | 0.63, 2.82 | <0.001 | 0.62, 3.12 | <0.001 | 0.65, 2.59 | <0.001 |
|
|
||||||
| Kurtosis | 0.54, 3.03 | <0.001 | 0.47, 3.51 | 0.017 | 0.60, 2.73 | <0.001 |
SEE: Standard Error of the Estimate.
Velocity magnitude distribution and spider plots
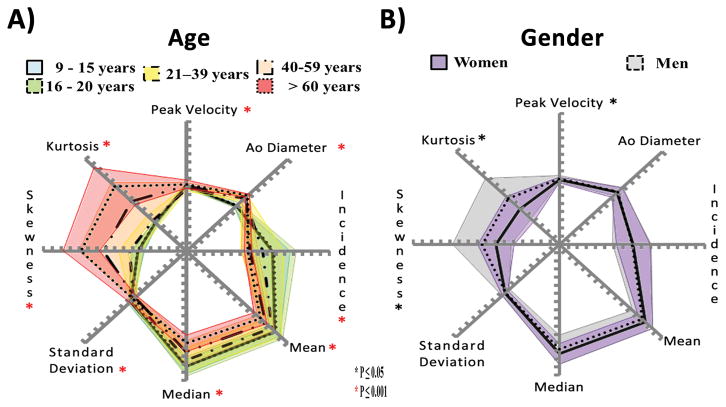
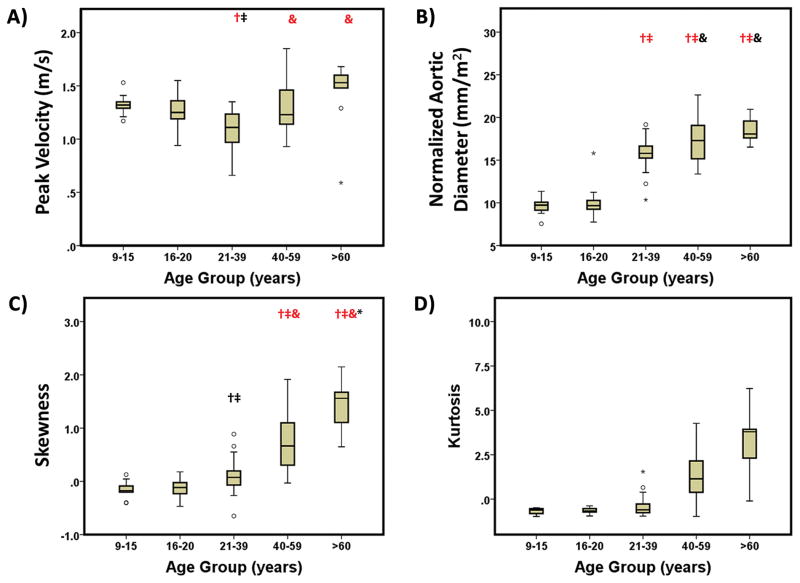
Spider plots provided a visual summary of comparing age groups (Fig. 5A). Significant differences between age groups were observed for all parameters (P<0.001 using ANOVA). Inter-group comparisons showed significant differences (P<0.05 and P<0.001) between age groups for peak velocity, normalized aortic diameter, and skewness (Fig. 6A–C). Aortic peak velocity measures observed in group 3 (21–39 years) (1.07±0.18, Fig. 6A) were 19% and 25% lower than group 1 (9–15 years) and group 5 (>60 years), respectively. Normalized aortic diameter significantly increased over age (P<0.001, Fig. 6B, Table 1) from group 1 (9–15 years) and 2 (16–20 years) to groups 3–5 (>21 years). Skewness and kurtosis had similar changes in older groups 4 (40–59 years) and 5 (>60 years). After adjusting by heart rate similar significant differences between age groups were observed for all parameters (P<0.001 using ANCOVA, Table 5).
FIGURE 5. Spider plots for age and gender.
Panel A shows velocity magnitude distribution analysis comparison for all age groups. Panel B shows velocity magnitude distribution analysis comparison for gender groups.
FIGURE 6. Comparison of age groups for aortic peak velocity magnitude, normalized aortic diameter, skewness and kurtosis.
Outliers, circles, were defined by 1.5 × interquartile range. Extreme values, stars, were defined by 3 × interquartile range. : Black (P<0.05) and red (P<0.001) as compared with group 1 (9–15 years). : Black (P<0.05) and red (P<0.001) as compared with group 2 (16–20 years). &: Black (P<0.05) and red (P<0.001) as compared with group 3 (21–39). *: Black (P<0.05) and red (P<0.001) as compared with group 4 (40–59 years).
Table 5.
Velocity magnitude distribution descriptors, adjusted by heart rate, summary by age and gender group
| Age Groups | Gender | ||||||||
|---|---|---|---|---|---|---|---|---|---|
|
|
|||||||||
| Parameters adjusted by heart rate | 9–15 years (n=9) | 16–20 years (n=13) | 21–39 years (n=27) | 40–59 years (n=40) | > 60 years (n=9) | P-value | Men (n=57) | Women (n=41) | P-value |
| Aortic Valve Peak Velocity (m/s) | 1.32±0.07 | 1.28±0.06 | 1.07±0.04 | 1.28±0.03 | 1.44±0.08 | <0.001 | 1.28±0.03 | 1.18±0.04 | 0.043 |
| Incidence (rel. # of aortic voxels >1m/s, %) | 18±3 | 19±2 | 12±2 | 6±1 | 5±3 | <0.001 | 10±1 | 11±2 | 0.003 |
| Mean (m/s) | 0.74±0.04 | 0.74±0.03 | 0.67±0.02 | 0.61±0.02 | 0.54±0.04 | <0.001 | 0.64±0.02 | 0.67±0.02 | 0.018 |
| Median (m/s) | 0.76±0.04 | 0.75±0.03 | 0.66±0.02 | 0.59±0.02 | 0.51±0.04 | <0.001 | 0.63±0.02 | 0.67±0.02 | 0.025 |
| Standard Deviation (m/s) | 0.26±0.01 | 0.24±0.01 | 0.22±0.01 | 0.19±0.01 | 0.23±0.01 | <0.001 | 0.21±0.01 | 0.22±0.01 | 0.004 |
| Skewness | −0.20±0.14 | −0.10±0.12 | 0.12±0.08 | 0.77±0.07 | 1.35±0.15 | <0.001 | 0.59±0.08 | 0.20±0.10 | 0.087 |
| Kurtosis | −0.74±0.37 | −0.62±0.31 | −0.34±0.23 | 1.37±0.17 | 2.96±0.39 | <0.001 | 0.98±0.20 | −0.05±0.55 | 0.101 |
Adjusted results by heart rate presented using mean ± standard error.
Velocity magnitude distribution analysis - influence of gender
Velocity magnitude histograms
Individual examples of the velocity magnitude MIPs, from a 35-year-old man and a 34-year-old woman, illustrated gender differences in aortic velocity patterns (Fig. 2B). Averaged velocity magnitude histograms, Fig. 7, showed that men had greater skewness (0.59±0.73 vs. 0.24±0.50, P=0.010), and kurtosis (0.99±1.81 vs. 0.07±1.34, P=0.007) compared to women.
FIGURE 7. Averaged velocity magnitude distribution histograms for gender groups.
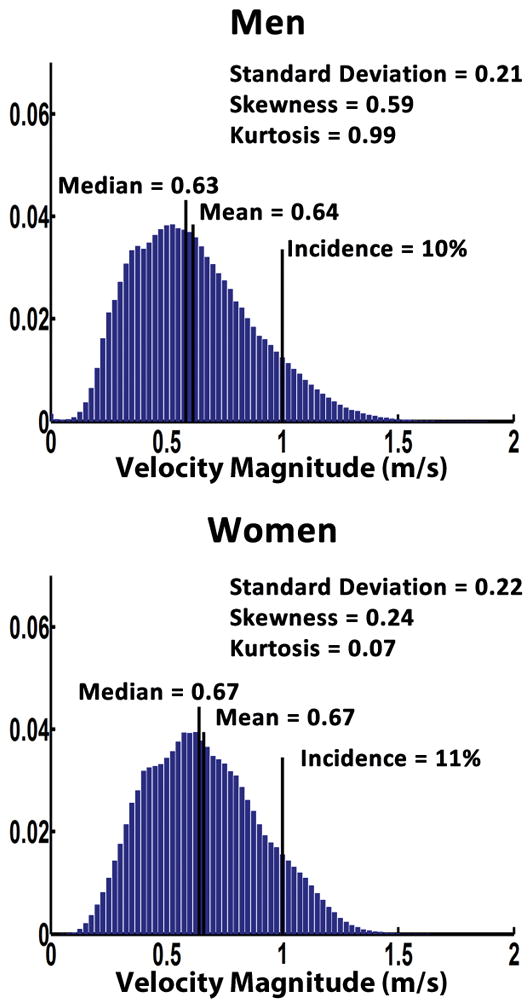
Averaged velocity magnitude distribution histograms are presented by gender, men group in the top panel and women group in the bottom panel. Distribution parameters are display for each group.
Correlation with age and normalized aortic diameter
Normalized aortic diameter showed strong linear association with age for men (R=0.72, P<0.001) and for women (R=0.71, P<0.001). A square root fit between normalized aortic diameter and age resulted in a similar association for men (R=0.73, P<0.001, Fig. 4A) and women (R=0.70, P<0.001) subjects. Regressions for skewness and kurtosis were higher for women than men subjects (R=0.79, P<0.001 vs. R=0.77, P<0.001, Fig. 4B; and R=0.78, P<0.001 vs. R=0.75, P<0.001, Fig. 4C). Most significant associations between all velocity magnitude distribution descriptors and normalized aortic diameter were obtained from skewness (r=0.59, P<0.001), median (r=−0.54, P<0.001) and mean (r=−0.49, P<0.001) in women and from skewness (r=0.64, P<0.001), kurtosis (r=0.60, P<0.001), median (r=−0.55, P<0.001), and mean (r=−0.52, P<0.001) in men. Most significant associations between all velocity distribution descriptors adjusted by heart rate and age or normalized aortic diameter were summarized in Table 3 and 4, respectively.
Velocity magnitude distribution and spider plots
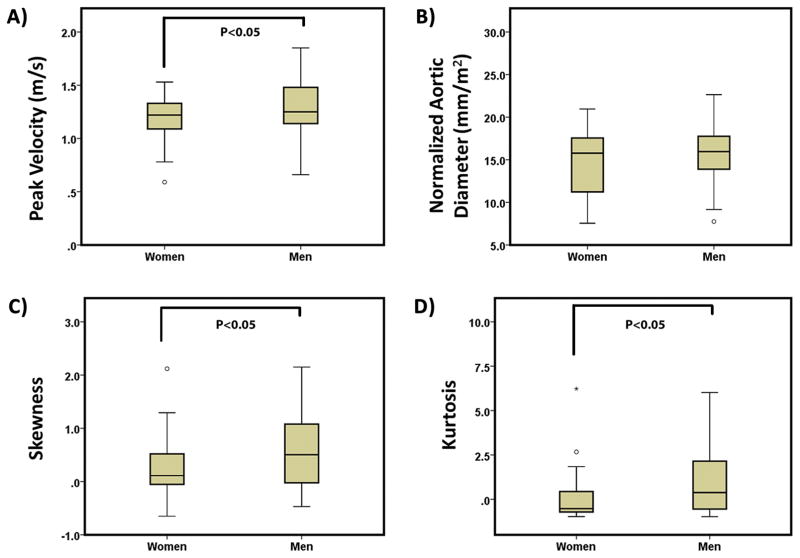
Spider plots, Fig. 5B, showed significant differences between gender groups for aortic peak velocity, skewness, and kurtosis (P≤0.05). Gender group comparisons using boxplots (Fig. 8) showed a better depiction of gender groups’ differences for aortic peak velocity, skewness, and kurtosis. Aortic peak velocity, skewness and kurtosis were 8%, 61% and 94% higher in men compared to women, respectively. When adjusting by heart rate, Table 5, aortic peak velocity, incidence, mean, median, and standard deviation showed significant differences.
FIGURE 8. Comparison of gender groups for aortic peak velocity, normalized mid-ascending aortic diameter, skewness and kurtosis.
Outliers, circles, were defined by 1.5 × interquartile range. Extreme values, stars, were defined by 3 × interquartile range.
Velocity magnitude distribution – study repeatability
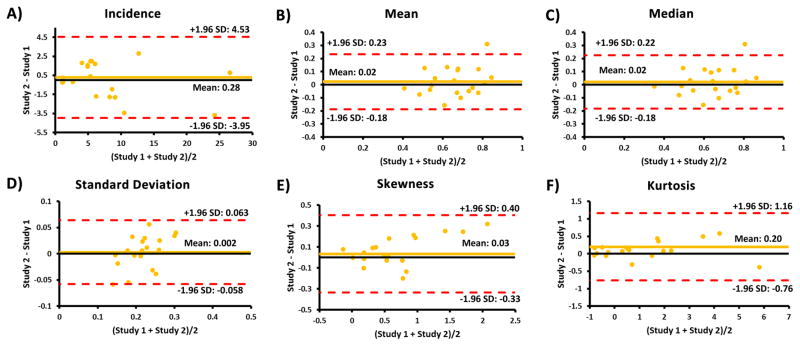
Repeatability test for all velocity distribution descriptors showed good agreement between studies, as it is showed by Bland-Altman plots (Fig. 9). Aortic segmented volume agreement was −6.84±27.08 cm3, limits of agreement: −59.91 to 46.24 cm3. Absolute errors between studies were: volume = 13±9 %, incidence = 24±14 %, mean velocity = 13±11 %, median velocity = 13±11 %, velocity standard deviation = 11±10 %, skewness = 21±13 %, and kurtosis = 19±14%.
FIGURE 9. Bland-Altman plots for inter-study repeatability for velocity distribution descriptors.
A–F: The plots for incidence, mean, median, standard deviation, skewness, and kurtosis, respectively.
DISCUSSION
This study investigated the age- and gender-related changes of velocity magnitude distribution within the entire volume of the thoracic aorta and demonstrated that: 1) aortic peak velocity and normalized ascending aortic diameter showed significant changes from childhood to adulthood; 2) aortic velocity magnitude distribution descriptors (incidence, mean, median, standard deviation, skewness and kurtosis) can differentiate hemodynamic changes across a wide range of ages; 3) gender significantly influence aortic velocity magnitude distribution (skewness and kurtosis) in the thoracic aorta despite similar normalized ascending aortic diameter; 4) adjustment of velocity magnitude distribution descriptors for heart rate may pertinent to account its potential mutual dependence as confounding factor.
Current guidelines for the evaluation and follow-up of thoracic aorta diseases recommend the measurement of aortic diameters at specific anatomic landmarks location and transvalvular aortic peak velocity using 2D planes(6,7). However, age and gender are closely related to these basic metrics along with height, weight, body surface area which are also important prognostic indicators that need to be taken into account in the evaluation of disease progression and outcome(33,34). As our study has shown, differences in ascending aortic diameter, aortic valve peak velocity and velocity magnitude distribution along the thoracic aorta exist through age range and gender. The 2D analysis strategy often results in underestimation of maximal aortic diameter and aortic valve peak velocity values due to location variability between observers(11,12). In our study, 1) a 3D PC-MRA segmentation was used to automatically calculate and find the maximal aortic diameter in the ascending aorta and 2) masked velocity magnitude MIPs were used to better assess aortic valve peak velocity and to provide a visual impression of flow patterns. The systematic analysis of velocity magnitude distribution over the entire aorta provided new metrics for characterizing flow behavior in healthy subjects across age and gender. Automatization of velocity distribution analysis may facilitate its application in multisite studies. Study repeatability showed a good agreement between studies. However, absolute error showed differences from 11 % – 24 %. These variations can be explained by the absolute error of the segmented volume, here 13 %. Smaller absolute error between segmentations led to smaller absolute error in a previous study for velocity distribution descriptors, an absolute error of the segmented volume = 4 % led to absolute errors from 2% – 7%(14).
The average aortic diameters found in this study are comparable to previous studies, men showed larger aortic dimensions than women(17–19,35,36). After normalizing ascending aorta diameter by BSA, no significant difference was observed between gender for the current cohort. Aortic geometry and aortic tissue properties (compliance and elasticity) are influenced by age(21) which explains the positive linear regression found in between age and aortic size. A square root regression was used to better characterize the physiological association of normalized aortic diameter and age in children and adults. Unlike aortic diameter, few studies have investigated the age and gender-related changes in aortic velocity. One of the first investigations employed 2D phase contrast MRI (2D PC-MRI) in healthy controls to asses pulse wave velocity in the thoracic aorta, demonstrating that mean aortic velocity decreased with age(22). A similar trend was found for peak velocity using a sagittal 2D analysis plane through the aorta with three-directional velocities(10). In our study, aortic valve peak velocity was obtained from velocity magnitude MIPs in a sagittal projection of 4D flow MRI data. Van Ooij et al.(26) applied a similar MIP approach to measure aortic valve peak velocity and found a similar positive trend with age. Velocity magnitude distribution analysis over the entire volume of the aorta allowed a more detailed and extended interrogation of blood flow hemodynamics. We used statistical descriptors of the velocity magnitude histogram (i.e. mean, median, standard deviation, skewness and kurtosis) to show significant associations with age in comparison with aortic valve peak velocity magnitude. Of interest, the orientation and shape of histogram, as quantified by skewness and kurtosis, showed the most significant associations with age. Skewness and kurtosis descriptors may provide further details of flow behaviour changes due to ageing, independently of aortic tissue properties and dimensions. The systematic velocity magnitude distribution analysis of 4D flow data may allow the creation of reference spider plot charts identifying the pathologic variations from hemodynamic characteristics due to age and gender, and indicating the importance of age and gender matched control cohorts for the assessment of cardiovascular disease. Recent studies showed the usefulness of distribution analysis in aortic diseases (14), intracranial hemodynamics (15), and on atrial hemodynamics in patients with atrial fibrillation (16).
Our study has the limitation that volunteers were enrolled based in an oral interview and not further examination was performed to discard undeclared cardiovascular risk factors such as high LDL cholesterol, low DHL cholesterol, high blood pressure, family history, diabetes, and smoking. Obesity and overweight may be also a risk factor. The main limitations of velocity magnitude distribution analysis may be the quality of the acquisition (e.g. velocity encoding selection, signal to noise ratio), pre-processing parameters (e.g. applied filters, flow corrections), and quality of 3D PC-MRA segmentation. Velocity magnitude distribution analysis required a sensitivity analysis to define the fraction of velocity voxels, included in the normalized histograms, detecting significant differences between groups. Spatial resolution showed an important variation considering the BSA differences between the pediatric and adult population (26% higher in adults). Group 1 (9–15 years) and group 5 (>60 years) were smaller in comparison with other groups. A previous study demonstrated that spatial resolution variations, in a ratio 1:3, may lead to differences <2% in velocity magnitude distribution parameters(14). Velocity encoding was the same (Venc = 1.5 m/s) in all subjects. In our study, subjects were scanned using scanners at 1.5 T and 3 T. Strecker et al demonstrated that 3 T strengths improves the 3D PC-MRA, which was used for segmentation of the aorta, and no statically significant difference were found for systolic peak velocity (0.005 m/s, P = 0.40) and net flow (3 mL/cycle, P = 0.39) measurements as compared with 1.5 T(37). 4D flow MRI and standard 2D phase-contrast temporal resolution may miss the “true” peak velocity as compared with Doppler echocardiography which is the clinical Gold standard (6). In addition, 4D flow MRI time frames are limited by heart rate which justify the adjustment of velocity magnitude distribution analysis descriptors when comparing groups. Further studies with a larger number of subjects and pathologies are needed to confirm the association of velocity magnitude distribution descriptors with patient prognosis.
In conclusion, aortic hemodynamics significantly change with age, affecting the aortic velocity magnitude distribution as depicted by incidence, mean, median, standard deviation, skewness and kurtosis. Despite having similar normalized ascending aortic diameter dimensions, velocity magnitude distribution in the aorta (i.e. skewness, and kurtosis) was different between gender. The systematic velocity magnitude distribution analysis of 4D flow data may identify pathologic variations, differentiating such changes from hemodynamic characteristics due to age and gender, and indicating the importance of age and gender matched control cohorts for the assessment of cardiovascular disease on aortic blood flow.
Acknowledgments
Grant Support: This work was supported by National Institute of Health National Heart, Lung, and Blood Institute grant R01HL115828, K25HL119608, Netherlands Heart Foundation 2014T087, American Heart Association 14POST18350019, and Mitacs Canada IT07679.
References
- 1.Von Knobelsdorff-brenkenhoff F, Karunaharamoorthy A, Trauzeddel RF, Barker AJ, Blaszczyk E, Markl M, Schulz-menger J. Valvular Heart Disease Evaluation of Aortic Blood Flow and Wall Shear Stress in Aortic Stenosis and Its Association With Left Ventricular Remodeling. Circ Cardiovasc Imaging. 2016;9(3):e004038. doi: 10.1161/CIRCIMAGING.115.004038. [DOI] [PMC free article] [PubMed] [Google Scholar]
- 2.Bissell MM, Hess AT, Biasiolli L, et al. Aortic dilation in bicuspid aortic valve disease: flow pattern is a major contributor and differs with valve fusion type. Circ Cardiovasc Imaging. 2013;6:499–507. doi: 10.1161/CIRCIMAGING.113.000528. [DOI] [PMC free article] [PubMed] [Google Scholar]
- 3.Mahadevia R, Barker AJ, Schnell S, et al. Bicuspid Aortic Cusp Fusion Morphology Alters Aortic 3D Outflow Patterns, Wall Shear Stress and Expression of Aortopathy. Circulation. 2013:673–682. doi: 10.1161/CIRCULATIONAHA.113.003026. [DOI] [PMC free article] [PubMed] [Google Scholar]
- 4.Hope MD, Hope TA, Crook SE, Ordovas KG, Urbania TH, Alley MT, Higgins CB. 4D flow CMR in assessment of valve-related ascending aortic disease. JACC Cardiovasc Imaging. 2011;4:781–7. doi: 10.1016/j.jcmg.2011.05.004. [DOI] [PubMed] [Google Scholar]
- 5.Holmes KW, Lehmann CU, Dalal D, Nasir K, Dietz HC, Ravekes WJ, Thompson WR, Spevak PJ. Progressive dilation of the ascending aorta in children with isolated bicuspid aortic valve. Am J Cardiol. 2007;99:978–83. doi: 10.1016/j.amjcard.2006.10.065. [DOI] [PubMed] [Google Scholar]
- 6.Vahanian A, Alfieri O, Andreotti F, et al. Guidelines on the management of valvular heart disease. Eur Heart J. 2012;33:2451–96. doi: 10.1093/eurheartj/ehs109. [DOI] [PubMed] [Google Scholar]
- 7.Erbel R, Aboyans V, Boileau C, et al. 2014 ESC Guidelines on the diagnosis and treatment of aortic diseases: Document covering acute and chronic aortic diseases of the thoracic and abdominal aorta of the adult * The Task Force for the Diagnosis and Treatment of Aortic Diseases of the European. Eur Heart J. 2014;35:2873–2926. doi: 10.1093/eurheartj/ehu281. [DOI] [PubMed] [Google Scholar]
- 8.Kilner PJ, Yang GZ, Mohiaddin RH, Firmin DN, Longmore DB. Helical and retrograde secondary flow patterns in the aortic arch studied by three-directional magnetic resonance velocity mapping. Circulation. 1993;88:2235–2247. doi: 10.1161/01.cir.88.5.2235. [DOI] [PubMed] [Google Scholar]
- 9.Markl M, Chan FP, Alley MT, et al. Time-resolved three-dimensional phase-contrast MRI. J Magn Reson Imaging. 2003;17:499–506. doi: 10.1002/jmri.10272. [DOI] [PubMed] [Google Scholar]
- 10.Bogren HG, Buonocore MH. 4D magnetic resonance velocity mapping of blood flow patterns in the aorta in young vs. elderly normal subjects. J Magn Reson Imaging. 1999;10:861–9. doi: 10.1002/(sici)1522-2586(199911)10:5<861::aid-jmri35>3.0.co;2-e. [DOI] [PubMed] [Google Scholar]
- 11.Garcia J, Barker AJ, Murphy I, Jarvis K, Schnell S, Collins JD, Carr JC, Malaisrie SC, Markl M. Four-dimensional flow magnetic resonance imaging-based characterization of aortic morphometry and haemodynamics: impact of age, aortic diameter, and valve morphology. Eur Hear J – Cardiovasc Imaging. 2015:jev228. doi: 10.1093/ehjci/jev228. [DOI] [PMC free article] [PubMed] [Google Scholar]
- 12.Bieging ET, Frydrychowicz A, Wentland A, Landgraf BR, Johnson KM, Wieben O, François CJ. In vivo three-dimensional MR wall shear stress estimation in ascending aortic dilatation. J Magn Reson Imaging. 2011;33:589–597. doi: 10.1002/jmri.22485. [DOI] [PMC free article] [PubMed] [Google Scholar]
- 13.von Knobelsdorff-Brenkenhoff F, Rudolph A, Wassmuth R, Abdel-Aty H, Schulz-Menger J. Aortic dilatation in patients with prosthetic aortic valve: comparison of MRI and echocardiography. J Heart Valve Dis. 2010;19:349–56. [PubMed] [Google Scholar]
- 14.Garcia J, Barker AJ, van Ooij P, Schnell S, Puthumana J, Bonow RO, Collins JD, Carr JC, Markl M. Assessment of altered three-dimensional blood characteristics in aortic disease by velocity distribution analysis. Magn Reson Med. 2015;74:817–825. doi: 10.1002/mrm.25466. [DOI] [PMC free article] [PubMed] [Google Scholar]
- 15.Schnell S, Ansari SA, Vakil P, et al. Three-dimensional hemodynamics in intracranial aneurysms: influence of size and morphology. J Magn Reson Imaging. 2014;39:120–31. doi: 10.1002/jmri.24110. [DOI] [PMC free article] [PubMed] [Google Scholar]
- 16.Fluckiger JU, Goldberger JJ, Lee DC, Ng J, Lee R, Goyal A, Markl M. Left atrial flow velocity distribution and flow coherence using four-dimensional FLOW MRI: a pilot study investigating the impact of age and Pre- and Postintervention atrial fibrillation on atrial hemodynamics. J Magn Reson Imaging. 2013;38:580–7. doi: 10.1002/jmri.23994. [DOI] [PubMed] [Google Scholar]
- 17.Davis AE, Lewandowski AJ, Holloway CJ, et al. Observational study of regional aortic size referenced to body size: production of a cardiovascular magnetic resonance nomogram. J Cardiovasc Magn Reson. 2014;16:9. doi: 10.1186/1532-429X-16-9. [DOI] [PMC free article] [PubMed] [Google Scholar]
- 18.Rylski B, Desjardins B, Moser W, Bavaria JE, Milewski RK. Gender-related changes in aortic geometry throughout life. Eur J Cardiothorac Surg. 2014;45:805–11. doi: 10.1093/ejcts/ezt597. [DOI] [PubMed] [Google Scholar]
- 19.Wolak A, Gransar H, Thomson LEJ, et al. Aortic size assessment by noncontrast cardiac computed tomography: normal limits by age, gender, and body surface area. JACC Cardiovasc Imaging. 2008;1:200–9. doi: 10.1016/j.jcmg.2007.11.005. [DOI] [PubMed] [Google Scholar]
- 20.Voges I, Jerosch-Herold M, Hedderich J, Pardun E, Hart C, Gabbert D, Hansen J, Petko C, Kramer H, Rickers C. Normal values of aortic dimensions, distensibility, and pulse wave velocity in children and young adults: a cross-sectional study. J Cardiovasc Magn Reson. 2012;14:77. doi: 10.1186/1532-429X-14-77. [DOI] [PMC free article] [PubMed] [Google Scholar]
- 21.Redheuil A, Yu W-C, Mousseaux E, Harouni AA, Kachenoura N, Wu CO, Bluemke D, Lima JAC. Age-Related Changes in Aortic Arch Geometry. J Am Coll Cardiol. 2011;58:1262–1270. doi: 10.1016/j.jacc.2011.06.012. [DOI] [PMC free article] [PubMed] [Google Scholar]
- 22.Mohiaddin RH, Firmin DN, Longmore DB. Age-related changes of human aortic flow wave velocity measured noninvasively by magnetic resonance imaging. J Appl Physiol. 1993;74:492–7. doi: 10.1152/jappl.1993.74.1.492. [DOI] [PubMed] [Google Scholar]
- 23.Vermeersch SJ, Rietzschel ER, De Buyzere ML, De Bacquer D, De Backer G, Van Bortel LM, Gillebert TC, Verdonck PR, Segers P. Age and gender related patterns in carotid-femoral PWV and carotid and femoral stiffness in a large healthy, middle-aged population. J Hypertens. 2008;26:1411–9. doi: 10.1097/HJH.0b013e3282ffac00. [DOI] [PubMed] [Google Scholar]
- 24.Segers P, Rietzschel ER, De Buyzere ML, Vermeersch SJ, De Bacquer D, Van Bortel LM, De Backer G, Gillebert TC, Verdonck PR. Noninvasive (input) impedance, pulse wave velocity, and wave reflection in healthy middle-aged men and women. Hypertension. 2007;49:1248–1255. doi: 10.1161/HYPERTENSIONAHA.106.085480. [DOI] [PubMed] [Google Scholar]
- 25.Smulyan H, Asmar RG, Rudnicki A, London GM, Safar ME. Comparative effects of aging in men and women on the properties of the arterial tree. J Am Coll Cardiol. 2001;37:1374–1380. doi: 10.1016/s0735-1097(01)01166-4. [DOI] [PubMed] [Google Scholar]
- 26.van Ooij P, Garcia J, Potters WV, Malaisrie SC, Collins JD, Carr JC, Markl M, Barker AJ. Age-related changes in aortic 3D blood flow velocities and wall shear stress: Implications for the identification of altered hemodynamics in patients with aortic valve disease. J Magn Reson Imaging. 2016;43:1239–1249. doi: 10.1002/jmri.25081. [DOI] [PMC free article] [PubMed] [Google Scholar]
- 27.Demir M, Acartürk E. Clinical characteristics influence aortic root dimension and blood flow velocity in healthy subjects. Angiology. 2001;52:457–61. doi: 10.1177/000331970105200703. [DOI] [PubMed] [Google Scholar]
- 28.Föll D, Taeger S, Bode C, Jung B, Markl M. Age, gender, blood pressure, and ventricular geometry influence normal 3D blood flow characteristics in the left heart. Eur Heart J Cardiovasc Imaging. 2013;14:366–73. doi: 10.1093/ehjci/jes196. [DOI] [PubMed] [Google Scholar]
- 29.Markl M, Harloff A, Bley TA, Zaitsev M, Jung B, Weigang E, Langer M, Hennig J, Frydrychowicz A. Time-resolved 3D MR velocity mapping at 3T: improved navigator-gated assessment of vascular anatomy and blood flow. J Magn Reson Imaging. 2007;25:824–31. doi: 10.1002/jmri.20871. [DOI] [PubMed] [Google Scholar]
- 30.Bock J, Kreher BW, Hennin J, Markl M. Optimized pre-processing of time-resolved 2D and 3D phase contrast MRI data. 15th Scientific Meeting International Society for Magnetic Resonance in Medicine; 2007. p. 3138. [Google Scholar]
- 31.Mosteller RD. Simplified calculation of body-surface area. N Engl J Med. 1987;317:1098. doi: 10.1056/NEJM198710223171717. [DOI] [PubMed] [Google Scholar]
- 32.Sluysmans T, Colan SD. Theoretical and empirical derivation of cardiovascular allometric relationships in children. J Appl Physiol. 2005;99:445–57. doi: 10.1152/japplphysiol.01144.2004. [DOI] [PubMed] [Google Scholar]
- 33.Hardikar AA, Marwick TH. Surgical thresholds for bicuspid aortic valve associated aortopathy. JACC Cardiovasc Imaging. 2013;6:1311–20. doi: 10.1016/j.jcmg.2013.10.005. [DOI] [PubMed] [Google Scholar]
- 34.Vasan RS, Larson MG, Benjamin EJ, Levy D. Echocardiographic reference values for aortic root size: the Framingham Heart Study. J Am Soc Echocardiogr. 1995;8:793–800. doi: 10.1016/s0894-7317(05)80003-3. [DOI] [PubMed] [Google Scholar]
- 35.Kaiser T, Kellenberger CJ, Albisetti M, Bergsträsser E, Valsangiacomo Buechel ER. Normal values for aortic diameters in children and adolescents--assessment in vivo by contrast-enhanced CMR-angiography. J Cardiovasc Magn Reson. 2008;10:56. doi: 10.1186/1532-429X-10-56. [DOI] [PMC free article] [PubMed] [Google Scholar]
- 36.Hegde SV, Lensing SY, Greenberg SB. Determining the normal aorta size in children. Radiology. 2015;274:859–65. doi: 10.1148/radiol.14140500. [DOI] [PubMed] [Google Scholar]
- 37.Strecker C, Harloff A, Wallis W, Markl M. Flow-sensitive 4D MRI of the thoracic aorta: Comparison of image quality, quantitative flow, and wall parameters at 1.5 T and 3 T. J Magn Reson Imaging. 2012;36:1097–1103. doi: 10.1002/jmri.23735. [DOI] [PubMed] [Google Scholar]


