

Abstract
Metabolic deceleration in pancreatic β-cells is associated with inhibition of glucose-induced insulin secretion (GIIS), but only in the presence of intermediate/submaximal glucose concentrations. Here, we used acute metformin treatment as a tool to induce metabolic deceleration in INS1 (832/13) β-cells, with the goal of identifying key pathways and metabolites involved in GIIS. Metabolites and pathways previously implicated as signals for GIIS were measured in the cells at 2–25 mm glucose, with or without 5 mm metformin. We defined three criteria to identify candidate signals: 1) glucose-responsiveness, 2) sensitivity to metformin-induced inhibition of the glucose effect at intermediate glucose concentrations, and 3) alleviation of metformin inhibition by elevated glucose concentrations. Despite the lack of recovery from metformin-induced impairment of mitochondrial energy metabolism (glucose oxidation, O2 consumption, and ATP production), insulin secretion was almost completely restored at elevated glucose concentrations. Meeting the criteria for candidates involved in promoting GIIS were the following metabolic indicators and metabolites: cytosolic NAD+/NADH ratio (inferred from the dihydroxyacetone phosphate:glycerol-3-phosphate ratio), mitochondrial membrane potential, ADP, Ca2+, 1-monoacylglycerol, diacylglycerol, malonyl-CoA, and HMG-CoA. On the contrary, most of the purine and nicotinamide nucleotides, acetoacetyl-CoA, H2O2, reduced glutathione, and 2-monoacylglycerol were not glucose-responsive. Overall these results underscore the significance of mitochondrial energy metabolism-independent signals in GIIS regulation; in particular, the candidate lipid signaling molecules 1-monoacylglycerol, diacylglycerol, and malonyl-CoA; the predominance of KATP/Ca2+ signaling control by low ADP·Mg2+ rather than by high ATP levels; and a role for a more oxidized state (NAD+/NADH) in the cytosol during GIIS that favors high glycolysis rates.
Keywords: beta cell (B-cell), glucose metabolism, insulin secretion, metformin, mitochondrial metabolism, metabolic coupling factors, metabolic deceleration
Introduction
Insulin secretion by pancreatic islet β-cells is the integrated outcome of mixed nutrient and neurohormonal cues, with glucose metabolism within β-cells lying at the heart of the sensor/signaling system (1–3). Despite considerable progress in identifying the different players involved in this process, the precise identity, mode, and site of action of several metabolic coupling factors (MCF),2 linking glucose/nutrient metabolism to insulin secretion, remain to be identified or more firmly established (2). The recent definition of a MCF suggests that it is a signal generated by nutrient metabolism that plays an essential, but not necessarily sufficient, role in promoting insulin secretion, either because it is a regulator of interacting metabolic pathway(s) involved in the fuel signaling cascades (regulatory MCF) or because it modulates the activity of key plasma membrane signaling proteins or the exocytotic machinery (effector MCF) (2).
Three metabolic pathways/cycles are thought to be central for MCF generation: 1) the citric acid cycle and the electron transport chain for ATP and reactive oxygen species synthesis; 2) the anaplerotic carboxylation of pyruvate to oxaloacetate, allowing pyruvate cycles, cataplerosis, and the production of cytosolic NADPH and malonyl-CoA (4); and 3) the glycerolipid/free fatty acid (GL/FFA) cycle, generating lipid signaling molecules (2, 5, 6), in particular 1-monoacylglycerol (1-MAG) (7–9). In the β-cell, flux through the citric acid cycle together with oxidative phosphorylation, in order, increases the cytoplasmic ATP/ADP ratio, closes KATP channels, depolarizes the plasma membrane, and opens voltage-gated calcium channels resulting in Ca2+ influx and the triggering of insulin secretion (10). Pyruvate cycles and the GL/FFA cycle generate signals to sustain and amplify insulin release in conjunction with the KATP/Ca2+ pathway of glucose metabolic signaling (10–14).
Several studies have emphasized the importance of hyper-responsiveness of insulin secretion to nutrient excess in the pathogenesis of type 2 diabetes through its effects to promote obesity and to cause islet β-cell failure through exhaustion, dysfunction, and apoptosis (15–19). We previously suggested that by inducing “metabolic deceleration,” the insulin-sensitizing anti-diabetic drugs pioglitazone and metformin could prevent β-cell hyper-responsiveness and protect them from nutrient-induced toxicity (20, 21). We have shown in vitro, in both INS1 (832/13) β-cells and rat islets, that both drugs inhibit glucose-induced insulin secretion (GIIS), but this is only evident at intermediate concentrations of glucose (∼6–8 mm) (20). Importantly, GIIS is unaltered by pioglitazone and metformin at basal glucose levels and is almost fully restored to normal at elevated glucose concentrations, indicating that the effect of reducing GIIS is not a consequence of drug toxicity (20).
In the current study, we have exploited the effect of metformin to acutely induce metabolic deceleration and inhibit GIIS in β-cells to investigate the importance of candidate metabolic pathways and putative MCFs in the processes of nutrient sensing-secretion coupling in INS1 (832/13) β-cells. We specifically sought to identify the pathways and metabolites that are inhibited by metformin at intermediate glucose concentrations and restored (or largely restored) at high glucose concentrations. To qualify as a candidate pathway/signal/MCF for GIIS, the following three criteria had to be met: 1) the pathway or metabolite level should be responsive to an increase in glucose from basal to intermediate stimulatory concentrations; 2) metformin treatment should inhibit the glucose-responsive pathway or metabolite level at intermediate glucose concentrations; and 3) the effect of metformin to inhibit the glucose-responsive pathway or metabolite level should be partially or totally alleviated at supramaximal glucose concentrations. Several, but not all, of the putative metabolic pathways and metabolites met the three criteria.
Results
Metformin causes a right shift in the glucose dose dependence of insulin secretion and Ca2+ response
Exposure of INS1 (832/13) cells to 5 mm metformin for 3.5 h (two preincubations plus incubation) had no effect on basal insulin release but markedly lowered GIIS in the presence of intermediate glucose concentrations (Fig. 1A). GIIS at the supramaximal glucose concentration of 25 mm was, however, unaffected by metformin. A similar effect of metformin on GIIS was noticed in isolated rat islets (Fig. 1C). Because metformin had no effect on either KCl-induced insulin release at low glucose (Fig. 1, B and D) or GIIS at basal and elevated glucose concentrations (Fig. 1, A and C), this inhibitory effect of metformin on insulin secretion is unlikely to be due to nonspecific toxicity.
Figure 1.

Metformin inhibits GIIS at intermediate glucose concentrations in INS1 (832/13) cells and isolated rat islets. A and B, glucose- and KCl-induced insulin secretion were measured in the presence of 5 mm metformin (Met) or vehicle (Ctl) in INS1 (832/13) cells. All the data (metformin and control conditions) are expressed as percentages of the 25 mm glucose (25G) control condition calculated from ng of insulin released after 45-min incubation/mg proteins; n = 9 from 3 separate experiments. Raw insulin secretion values, as ng/mg proteins/45 min, are as follows: for vehicle-treated cells, 33 ± 3 at 1 mm glucose and 339 ± 19 at 25 mm glucose; and for metformin-treated cells, 32 ± 3 at 1 mm glucose and 314 ± 18 at 25 mm glucose. C and D, glucose- and KCl-induced insulin secretion after 1-h incubation in isolated rat islets. The data are expressed as percentages of 25 mm glucose condition calculated from the percentage of the total insulin content secreted; n = 16 from 4 separate experiments. Raw insulin secretion values are as follows: for vehicle-treated islets, 1.5 ± 0.2% at 3 mm glucose and 6.1 ± 0.8% at 25 mm glucose; and for metformin-treated cells, 1.5 ± 0.2% at 3 mm glucose and 4.8 ± 0.8% at 25 mm glucose. KCl was added at 35 mm in the presence of 1 mm (cells) or 3 mm (islets) glucose. The results are expressed as means ± S.E. Two-way ANOVA with Sidak's multiple comparisons test was used. #, p < 0.05 for glucose effect from 1 mm (cells) or 3 mm (islets) glucose to 8 mm glucose in the control condition; *, p < 0.05 for metformin effect versus control at a given glucose concentration; a, p < 0.05 for glucose effect from 8 to 25 mm glucose in the metformin condition.
Because of the need for large numbers of cells, in particular for metabolomics, uniform and unrestricted access of cells to nutrients and O2, and homogeneous β-cell preparations, the rest of the studies were performed in INS1 (832/13) cells only. The rat INS1 (832/13) clonal cell line, which conserves for a large part β-cell specific markers and cellular phenotypes, has been extensively used in studies to define the molecular basis of GIIS (22, 23).
We found a steady rise in intracellular Ca2+ with increasing glucose concentrations in both control and metformin-treated cells, with Ca2+ levels being lower in the latter at both intermediate and elevated glucose concentrations (Fig. 2A). Nevertheless, the increase in intracellular Ca2+ induced by 25 mm glucose in metformin-treated cells was similar to the increase induced by 10 mm glucose in control cells (Fig. 2A), a condition where GIIS is already maximal (Fig. 1A).
Figure 2.

Effect of various glucose concentrations on intracellular Ca2+, glucose and fatty acid oxidation, mitochondrial membrane potential, and H2O2 production in the absence and presence of metformin. INS1 (832/13) cells were treated with 5 mm metformin (Met) or vehicle (Ctl) at the indicated glucose concentrations, as described under “Experimental procedures.” GIIS data from Fig. 1A has been added to some graphs for comparison. A, intracellular free calcium ([Ca2+]i) expressed as fold change in fluorescence 8 min after glucose addition when maximal glucose effect was reached; n = 12 from 2 separate experiments. a.u., arbitrary units. B, d-[U-14C]glucose oxidation to CO2 expressed as percentages of 25 mm glucose (25G) control condition calculated from the nmol glucose (Glc) oxidized after 45-min incubation/mg proteins; n = 6 from 3 separate experiments. Raw glucose oxidation values, as nmol/mg proteins/45 min, are as follows: for vehicle-treated cells, 3.0 ± 0.2 at 1 mm glucose and 31.8 ± 2.2 at 25 mm glucose; and for metformin-treated cells, 2.5 ± 0.1 at 1 mm glucose and 19.7 ± 1.7 at 25 mm glucose. C, mitochondrial membrane potential (ΔΨm) expressed as percentages of the 25 mm glucose control condition, calculated from absolute difference in fluorescence between the 1 mm glucose condition and the indicated glucose condition 30 min after glucose addition; n = 6 from 2 determinations performed separately for each glucose concentration (16 separate experiments in total). D, H2O2 cellular content expressed as percentages of 25 mm glucose control condition calculated from fold change in fluorescence versus the 2 mm glucose control condition after 20 min incubation; n = 8 from 2 separate experiments. E, [1-14C]palmitic acid oxidation to CO2 expressed as nmol of palmitic acid (Palm) oxidized after 45 min incubation/mg proteins; n = 4 from 2 separate experiments. The results are expressed as means ± S.E. Two-way ANOVA with Sidak's multiple comparisons test was used. #, p < 0.05 for glucose effect from 1/2 mm glucose to 7–10 mm glucose in the control condition; * or †, p < 0.05 for metformin effect inhibiting (*) or enhancing (†) glucose-induced changes versus control at a given glucose concentration; a, p < 0.05 for glucose effect from 7–10 to 25 mm glucose in metformin condition.
Metformin alters mitochondrial activity without effect on maximal GIIS
We next measured metformin effects on glucose metabolism and mitochondrial activity, because both are essential for GIIS. Metformin inhibited glucose oxidation to CO2 by 25–40% at all glucose concentrations above 3 mm (Fig. 2B). Glucose oxidation generates reducing equivalents that feed the electron transport chain and participate in maintaining the mitochondrial membrane potential (ΔΨm). Glucose maximally increased the ΔΨm at concentrations of 7–10 mm corresponding to maximal GIIS in control cells. Metformin markedly inhibited the glucose-induced ΔΨm polarization at all glucose concentrations above basal, with marked shifting of the response curve to the right without an upper plateau, corresponding closely with the right-shifted GIIS response (Fig. 2C). An increased ΔΨm can lead to superoxide and H2O2 generation (24), and the latter has been proposed as a signal for insulin secretion (25). Although we observed a trend for a glucose-induced increase in H2O2 at 10 and 25 mm glucose under control conditions, this was lost in metformin-treated cells (Fig. 2D). Under our experimental conditions, reactive oxygen species production did not correlate with GIIS either in the absence or presence of metformin (Fig. 2D). Metformin also inhibited palmitate oxidation to CO2 by ∼20% at glucose concentrations between 1 and 3 mm, under which conditions the cells rely on fatty acid oxidation to meet their energy needs (Fig. 2E).
We measured cellular O2 consumption rate (OCR) profiles in the presence and absence of metformin (Fig. 3). As expected from the glucose oxidation and ΔΨm results, increasing glucose from 2 mm to 6, 10, or 25 mm in control cells maximally enhanced the OCR to the same level, and this was markedly diminished by metformin (Fig. 3A). The drug markedly lowered glucose-induced ATP synthesis, estimated from the OCR attributed to ATP production, expressed as fold increase over 2 mm glucose at all glucose concentrations (Fig. 3B). The effect of metformin to markedly reduce the OCR was accompanied by a 50–55% reduction in proton leak, defined as the mitochondrial respiration recorded in the absence of ATP production (oligomycin-treated cells) minus that observed under conditions of electron chain inhibition (rotenone plus antimycin-treated cells) (Fig. 3C). Despite a marked reduction in glucose-induced ATP production by oxidative phosphorylation, absolute cellular ATP contents remained largely unaffected by metformin treatment (see below metabolomics data) likely because of the reduced proton leak increasing the effectiveness of a lower ΔΨm to maintain a basal ATP production rate and/or ATP production from anaerobic glycolysis. Metformin did not alter the maximal OCR induced by carbonyl cyanide-p-trifluoromethoxyphenylhydrazone (FCCP)-induced uncoupling of oxidative phosphorylation (Fig. 3D).
Figure 3.

Effect of glucose on mitochondrial respiration in the absence and presence of metformin. OCR was recorded in INS1 (832/13) cells treated with 5 mm metformin (Met) or vehicle (Ctl). Additions of glucose (Glc) were made from 2 mm to reach 2, 6, 10, or 25 mm glucose (G). At the indicated time, 0.25 μm oligomycin (O), 5 μm FCCP (F), and 1 μm rotenone plus 0.1 μm antimycin (R+A) were added. A, OCR profile. B, ATP turnover (glucose effect on OCR attributed to ATP production) calculated as change between rate 5 (fifth time point in A) and the average of rates 8 and 9 and expressed as fold over the 2 mm glucose condition of the same treatment (± metformin). C, proton leak calculated as change between averages of rates 8–9 and rates 12–14. D, maximal OCR recorded after FCCP addition (rate 10). In A, the traces at 2 mm glucose that remained stable after glucose addition have been omitted for clarity. The results are expressed as means ± S.E.; n = 4–6 from 2 separate experiments. Two-way ANOVA with Sidak's multiple comparisons test was used. #, p < 0.05 for glucose effect from 2 to 10 mm glucose in the control condition; *, p < 0.05 for metformin effect versus control at a given glucose concentration; b, p < 0.0001 for overall metformin effect.
We previously named this pattern of a “right shift” in glucose dose dependence of energy metabolism activation and GIIS as β-cell “metabolic deceleration” (20, 21). However, whereas mitochondrial activation and ATP production are thought to play a central role in GIIS (2, 26), we have now shown that despite the major inhibitory effect of metformin on glucose oxidation and mitochondrial activity measured as O2 consumption and ATP production by oxidative phosphorylation even at the highest glucose concentrations, GIIS in metformin-treated INS1 (832/13) cells at elevated (25 mm) glucose concentration is similar to that in control cells. Although the ΔΨm at supramaximal glucose concentrations was less affected, indicating a potential important role for this entity in our findings, these results also point to involvement of additional pathways and MCFs in GIIS.
Metabolic deceleration–mediated slowdown in GIIS by metformin is associated with parallel changes in 1-MAG and DAG
Some lipid signaling molecules, including diacylglycerols (DAGs) and MAG, have been proposed as MCFs for GIIS (2). The possibility of these lipid signals being involved in the GIIS rescue in metformin-treated INS1 (832/13) cells at elevated glucose concentrations was examined. Indeed, glucose-induced increases in the levels of total DAG (here we measured a mixture of 1,2- and 2,3-isomers; Fig. 4A) and 1-MAG (Fig. 4B), two glycerolipids produced during the GL/FFA cycle and implicated in GIIS (13), were markedly decreased by metformin compared with control conditions at the intermediate glucose concentration of 8 mm but minimally decreased (significant only for DAG) at the supramaximal glucose concentration of 25 mm. These changes in signaling lipids paralleled the GIIS response. By contrast, elevated glucose did not increase 2-MAG, and there was no correlation between 2-MAG levels and GIIS (Fig. 4C).
Figure 4.

Effect of glucose on the incorporation of palmitate into DAG and MAG, and on glycerol release in the absence and presence of metformin. Lipid metabolism was measured in INS1 (832/13) cells treated with 5 mm metformin (Met) or vehicle (Ctl). A–C, [1-14C] palmitic acid incorporation into DAG (mixture of 1,2-DAG and 2,3-DAG; A), 1-MAG (B), and 2-MAG (C). All the data (metformin and control conditions) are expressed as percentages of the 25 mm glucose (25G) control condition calculated from the nmol of palmitic acid esterified after 1 h incubation/mg proteins; n = 4 from 2 separate experiments. Average palmitic acid incorporation is as follows, in nmol of palmitic acid incorporated/mg protein/h: for DAG, control condition, 0.27 at 2 mm glucose and 6.37 at 25 mm glucose; for DAG, metformin condition, 0.32 at 2 mm glucose and 4.90 at 25 mm glucose; for 1-MAG, control condition, 0.046 at 2 mm glucose and 0.225 at 25 mm glucose; for 1-MAG, metformin condition, 0.042 at 2 mm glucose and 0.137 at 25 mm glucose; for 2-MAG, control condition, 0.27 at 2 mm glucose and 0.29 at 25 mm glucose; and for 2-MAG, metformin condition, 0.24 at 2 mm glucose and 0.22 at 25 mm glucose. D, glycerol (Gro) release expressed as percentages of the 25 mm glucose control condition calculated from the nmol glycerol released after 45 min incubation/mg protein; n = 9 from 3 separate experiments. Raw glycerol values, as nmol/mg proteins/45 min, are as follows: for vehicle-treated cells, 1.9 ± 0.3 at 1 mm glucose and 25.7 ± 1.5 at 25 mm glucose; and for metformin-treated cells, 1.5 ± 0.3 at 1 mm glucose and 22.0 ± 1.0 at 25 mm glucose. GIIS data from Figs. 1A (D) and 5A (A–C) have been added to the graphs for comparison. The results are expressed as means ± S.E. Two-way ANOVA with Sidak's multiple comparisons test was used. #, p < 0.05 for glucose effect from 1/2 mm glucose to 8 mm glucose in the control condition; *, p < 0.05 for metformin effect versus control at a given glucose concentration; a, p < 0.05 for glucose effect from 8 to 25 mm glucose in the metformin condition.
Glycerol, formed in β-cells either during MAG breakdown at the last step of the GL/FFA cycle (13) or from the hydrolysis of glycerol 3-phosphate (Gro3P) by a Gro3P phosphatase recently identified in our lab (27), cannot further be utilized by β-cells because they lack glycerokinase (13), such that it is released from the cell. Despite the reduction seen in DAG and 1-MAG levels at 8 mm glucose, metformin treatment had no significant effect on total glycerol release (Fig. 4D).
Metabolic deceleration–mediated slowdown in GIIS by metformin is associated with parallel changes in several critical metabolites and candidate MCFs
Using a targeted metabolomics approach, we measured intracellular levels of various water-soluble metabolites including proposed MCFs for GIIS from INS1 (832/13) cells incubated at 2, 8, and 25 mm glucose in the absence and presence of metformin. We have performed metabolomics analysis in relative terms, similar to what was reported in many of the earlier metabolomics studies performed on INS1 (832/13) and not absolute values. We have reported absolute values for certain specific metabolites in INS1 (832/13) cells in an earlier study (28). As shown in Fig. 5A, control and metformin-treated cells from which the metabolites were extracted secreted insulin similarly to that observed in Fig. 1A.
Figure 5.

Effect of glucose on the cellular content of glycolysis and citric acid cycle intermediates, short-chain acyl-CoAs, and amino acids in the absence and presence of metformin. GIIS (circles) and metabolites (squares) were measured in INS1 (832/13) cells treated with 5 mm metformin (white symbols) or vehicle (black symbols). Metabolites were extracted from cells at the end of an incubation period of 45 min. A, insulin released in the medium expressed as percentages of 25 mm glucose (25G) control condition calculated from the ng insulin/mg protein. B–T, intracellular metabolite contents expressed as percentages of 25 mm glucose control condition calculated from LC-MS peak area values normalized by protein content. Citrate and isocitrate are not differentiated by the method used. The results are expressed as means ± S.E.; n = 12 from 4 separate experiments. Two-way ANOVA with Sidak's multiple comparisons test was used. #, p < 0.05 for glucose effect from 2 to 8 mm glucose in the control condition; * or †, p < 0.05 for metformin effect inhibiting (*) or enhancing (†) glucose-induced changes versus control at a given glucose concentration; a, p < 0.05 for glucose effect from 8 to 25 mm glucose in the metformin condition. (Iso)citrate, both citrate and isocitrate; α-KG, α-ketoglutarate; AcAc-CoA, acetoacetyl-CoA.
As expected, higher glucose concentrations increased glycolytic (Fig. 5, B–E) and citric acid cycle (Fig. 5, F–J) intermediates in both the control and metformin-treated cells. However, the glucose-induced increase in dihydroxyacetone phosphate (DHAP) was markedly reduced, whereas the rise in Gro3P was marginally increased (at 8 mm glucose) in metformin-treated cells (Fig. 5C). The increase in pyruvate content was markedly increased by metformin at 25 mm glucose, and this was associated with increased lactate at both 8 and 25 mm glucose (Fig. 5, D and E). Metformin attenuated the increases in the citric acid cycle intermediates succinate and citrate + isocitrate (not discriminated) but increased fumarate and malate (at 25 mm glucose only) (Fig. 5, F and H–J). The glucose-induced increase in α-ketoglutarate was unaltered by metformin (Fig. 5G).
In control cells, an increase in glucose from 2 to 8 mm elevated acetyl-CoA (Fig. 5K) and malonyl-CoA (Fig. 5M) and lowered HMG-CoA (Fig. 5N) contents as we have previously shown (29, 30), with lesser changes of the same direction increasing to 25 mm glucose. Metformin treatment did not affect acetyl-CoA levels but dampened the glucose-induced increase in malonyl-CoA and decline in HMG-CoA. Of note, the metformin-induced changes in cell content of malonyl-CoA and the reciprocal of HMG-CoA were directly in line with the metformin-induced changes in GIIS (Fig. 5, M and O). Glucose and metformin treatment did not alter acetoacetyl-CoA levels (Fig. 5L).
The cell contents of the amino acids glutamate (Fig. 5P), glutamine (Fig. 5Q), and aspartate (Fig. 5S) were all glucose-responsive between 2 and 8 mm glucose in both control and metformin-treated cells. Considering the data at the intermediate glucose concentration of 8 mm, at which the metformin inhibitory effect on GIIS was maximum, the drug slightly elevated glutamate and alanine contents but lowered glutamine and aspartate (Fig. 5, P–T). There was no correlation between changes in GIIS caused by metformin and these amino acid levels.
ATP (Fig. 6A), AMP (Fig. 6D), GTP (Fig. 6F), GMP (Fig. 6G), and GSH (Fig. 6I) levels remained largely unaltered by a glucose increase from 2 mm to 8 or 25 mm in control cells, and metformin barely changed the cellular content of these metabolites. Glucose dose-dependently reduced GSSG levels, and this was unaltered by metformin (Fig. 6H). Interestingly, cell ADP content was elevated in metformin-treated cells at 2 mm glucose, and this dropped closer to control ADP contents by increasing glucose to 8 and 25 mm (Fig. 6B). The reciprocal of cellular ADP content, in the absence and presence of metformin, overall correlated with GIIS (Fig. 6C). Total cellular NADH content increased with glucose concentrations from 2 mm to 8 to 25 mm, with little, if any, metformin effect (Fig. 6L). Glucose and metformin treatment did not alter adenosine (Fig. 6E), NAD+ (Fig. 6K), the NADP+-NADPH couple (Fig. 6, M and N), and cAMP (Fig. 6J).
Figure 6.

Effect of glucose on the cellular content of purine nucleotides, nicotinamide nucleotides, and glutathione in the absence and presence of metformin. The data were obtained from the same experiments shown in Fig. 5, except that additional metabolites are shown. GIIS (circles) and metabolites (squares) were measured in INS1 (832/13) cells treated with 5 mm metformin (white symbols) or vehicle (black symbols). A–N, intracellular metabolite contents expressed as percentages of the 25 mm glucose (25G) control condition. GIIS from Fig. 5A has been added to the graphs for comparison with metabolite levels. The results are expressed as means ± S.E.; n = 12. Two-way ANOVA with Sidak's multiple comparisons test was used. #, p < 0.05 for glucose effect from 2 to 8 mm glucose in the control condition; * or †, p < 0.05 for metformin effect inhibiting (*) or enhancing (†) glucose-induced changes versus control at a given glucose concentration.
Fig. 7 shows ratios of nucleotides or redox couples with the numerator and denominator being calculated from the percentages of the control condition measured at 25 mm glucose (% 25G Ctl) for the respective nucleotide or redox couple levels, as shown in Figs. 5 and 6. Thus, these ratios are always 1.0 for the control at 25 mm glucose condition and are relative rather than being calculated from true metabolites concentrations. As expected, glucose increased the total cellular NADH/NAD+ ratio (Fig. 7A). Pyruvate/lactate (31) and DHAP/Gro3P (32) ratios reflect the cytosolic free NAD+/NADH ratio (NAD+c/NADHc), with a rise reflecting a more oxidized state that favors β-cell glycolytic flux, as shown previously in glucose stimulated pure rat islet β-cells (32) and INS1 (832/13) cells (33). The pyruvate/lactate and DHAP/Gro3P ratios are difficult to interpret at 2 mm glucose because of the low levels of these metabolites at that concentration. At 8 mm glucose, however, the ratios were markedly reduced in the metformin compared with the control condition indicative of a metformin effect to lower the NAD+c/NADHc at this intermediate glucose concentration (Fig. 7, B and C). The supramaximal glucose concentration of 25 mm, however, fully (pyruvate/lactate ratio) or partially (DHAP/Gro3P) alleviated this metformin effect (Fig. 7, B and C). In other words, metformin prevented the rise in the cytosolic NAD+/NADH ratio caused by 8 mm glucose, and high (25 mm) glucose alleviated this inhibition. Glucose and metformin treatment had no effect on the NADPH/NADP+ ratio (Fig. 7D). GSH/GSSG increased with increasing glucose concentrations, and metformin trended to further augment the ratio (Fig. 7E).
Figure 7.

Effect of glucose on the cellular ratios of nicotinamide nucleotides, cytosolic redox couples, and adenine nucleotides in the absence and presence of metformin. Values from Figs. 5 and 6 were used to calculate ratios of some redox (A–E) and adenine nucleotides couples (F and G) of interest in INS1 (832/13) cells treated with 5 mm metformin (white symbols) or vehicle (black symbols). Pyr, pyruvate; Lac, lactate.
Similar calculations for adenine nucleotides showed a glucose-induced increase in the ATP/ADP ratio from concentrations of 2–8 mm in control cells, which was inhibited by metformin (Fig. 7F). At 25 mm, the ATP/ADP ratio between control and metformin-treated cells was no longer different (Fig. 7F). The ATP/AMP ratio slightly increased from 2 to 8 mm glucose, without evidence of a metformin effect (Fig. 7G).
Table 1 provides an overview of the pathways/signals/MCFs studied with respect to which of them met the three criteria for a candidate pathway/signal/MCF for GIIS. Those meeting the criteria were [Ca2]i, ΔΨm, DAG, 1-MAG, DHAP, NAD+c/NADHc, ADP, ATP/ADP, malonyl-CoA, and HMG-CoA.
Table 1.
Summary of glucose and metformin effects on measured pathways and metabolites and their role as signals or metabolic coupling factors for GIIS
Symbols in headings refer to the statistical analysis (or qualitative evaluation in the case of metabolite ratios) performed in corresponding experiments, where # refers to a significant glucose effect from 1/2 to 7–10 mm in control condition; * refers to a metformin-induced inhibition of glucose effect at 7–10 mm glucose; and a to a glucose effect from 7–10 mm to 25 mm in metformin condition and/or restoration to control value at 25 mm glucose. Pathways or metabolites showing agreement with a role as signal or metabolic coupling factor (MCF) are highlighted in green, whereas those for which data do not support a role as signal or MCF in INS1 (832/13) cells are highlighted in red. +, yes; −, no; [Ca2+]i, intracellular calcium; Glc, glucose; ΔΨm, mitochondrial membrane potential; (Iso)citrate, undifferentiated citrate and isocitrate; AcAcetyl-CoA, acetoacetyl-CoA; GSH, reduced glutathione; GSSG, oxidized glutathione.
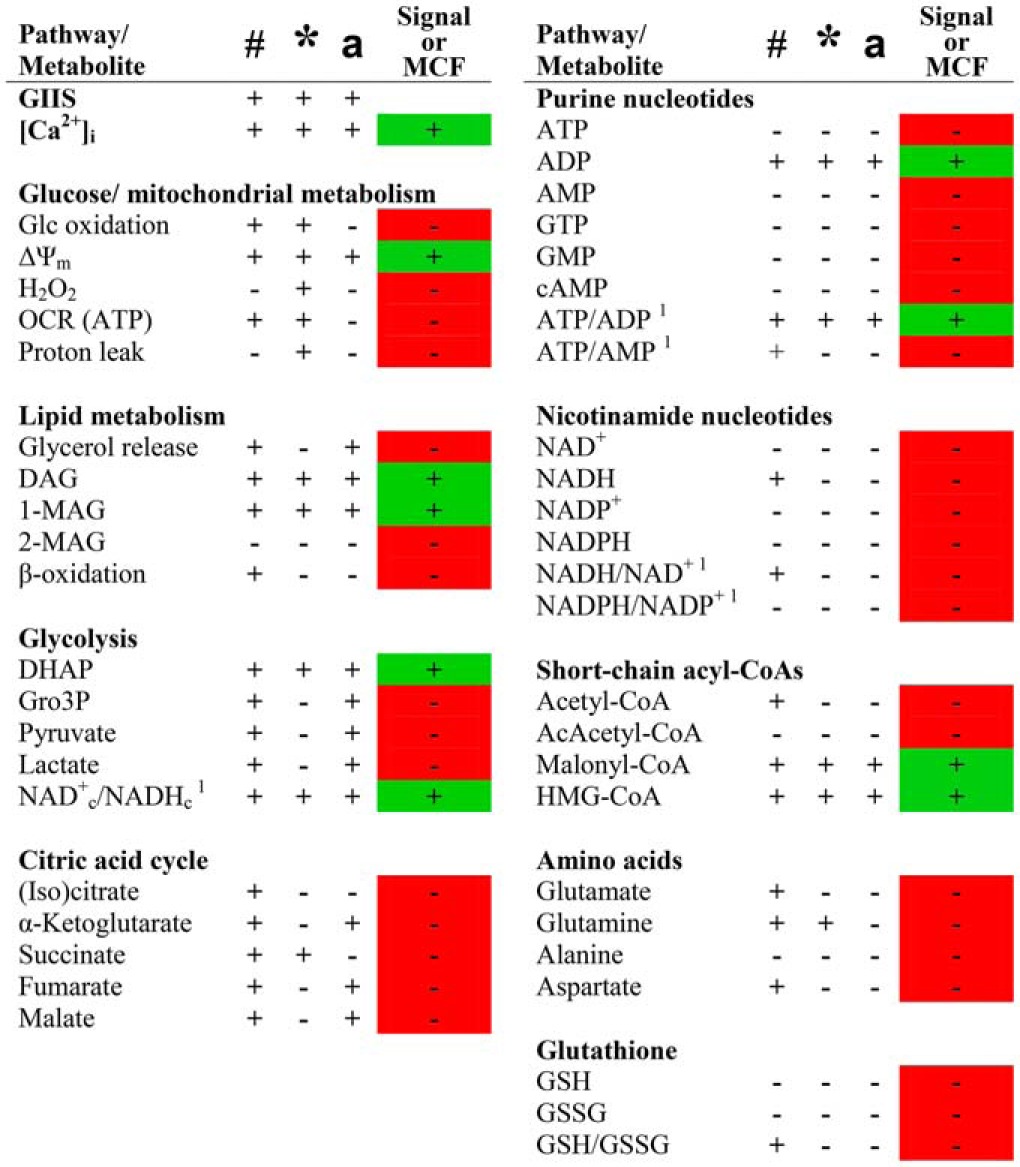
# significant glc effect from 1/2 mm (cells) or 3 mm (islets) Glc to 7–10 mm Glc in control condition.
* significant metformin inhibition of Glc effect versus control at a given Glc concentration.
a significant Glc effect from 7–10 mm to 25 mm Glc in metformin condition.
1 qualitative evaluation of Glc and metformin effects (statistical analysis cannot be performed).
Discussion
The role of glycolysis, glucose oxidation, and mitochondrial respiration in the KATP/Ca2+ triggering pathway of GIIS is established. Here we utilized metformin at a high dose to acutely inhibit the oxidative metabolism of glucose in INS1 (832/13) cells to allow closer examination of less well-established pathways in the promotion of GIIS. Whether similar effects of metformin occur in β-cells in vivo at doses used in the treatment of type 2 diabetes is unknown and was not the purpose of this study. The discussion focuses on 1) the acute effects of metformin on INS1 (832/13) cells metabolism; 2) the candidate pathways/signals/MCFs that meet the study requirements for involvement in promoting GIIS; and 3) the candidate pathways/signals/MCFs that did not meet the requirements for involvement in GIIS.
Effects of metformin on INS1 (832/13) cells metabolism
Metformin is known to be a mild inhibitor of complex I of the mitochondrial electron transport chain and an inhibitor of mitochondrial Gro3P dehydrogenase (34–37). Limited studies of the metabolic effects of metformin have been performed in pancreatic β-cells (20, 38–41). The findings of the current study support the presence of all these mechanisms of action of metformin at the 5 mm dose in INS1 (832/13) cells. The marked reduction in the effect of elevated glucose to increase the OCR is consistent with inhibition of complex I (42). The reduction in the ratio of DHAP/Gro3P at 8 mm glucose is also in keeping with inhibition of mitochondrial Gro3P dehydrogenase and the Gro3P shuttle (34), with a suggestion that it may have been partially overcome at supramaximal glucose concentrations. The capacity of 25 mm glucose to increase the ΔΨm in metformin-treated β-cells above that measured at 8 mm glucose was unexpected considering its marked inhibition of the OCR. This might be explained by increased activity of the succinate dehydrogenase of complex II (consistent with the reduced succinate and increased fumarate content in the metformin-treated cells at high glucose) (39) and the effect of metformin to reduce the mitochondrial proton leak. Importantly, metformin markedly inhibited β-cell mitochondrial oxidative phosphorylation but, as previously reported by us, inhibited GIIS only at intermediate glucose concentrations in INS1 (832/13) cells and rat islets (20), allowing us to investigate alternate MCFs in GIIS to those produced by glucose oxidation.
Metabolic pathways and metabolites that qualify as signals and MCFs for GIIS
Of the 40 pathways and metabolites measured, only 6 metabolites qualify as MCFs according to our criteria: ADP, the short chain acyl-CoAs malonyl-CoA and HMG-CoA, the glycerolipids DAG and 1-MAG, and the glycolytic intermediate DHAP (Table 1). In addition, the ATP/ADP and the cytosolic NAD+c/NADHc ratios also qualified as signals. Thus, the pathways involved in the production of these metabolites were likely inhibited by metformin at 8 mm glucose but partially or fully recovered at 25 mm glucose. These include glycolysis, anaplerosis/cataplerosis, and the GL/FFA cycle.
Accompanying the effect of metformin to reduce glucose oxidation was an increase in anaerobic glycolysis, as indicated by the increase in lactate at both 8 and 25 mm glucose, as has been previously reported for this drug (43). Lactate production provides a source of NAD+ to enable continued glycolysis. The increase in DHAP at 25 mm glucose is consistent with the supramaximal glucose pushing glycolysis and increasing the activity of the Gro3P shunt (34), again providing NAD+ required for the glyceraldehyde-3-phosphate dehydrogenase reaction of glycolysis (32) and supporting an increase in the NADc/NADHc ratio, as was seen at the 25 mm condition in metformin-treated cells. Increased activity of glycolysis would assist in increasing the ATP/ADP ratio, also observed at the highest glucose concentration, and provides Gro3P required for GL/FFA cycling (44, 45). Malonyl-CoA production was reduced at 8 mm glucose, suggesting some inhibition of anaplerosis/cataplerosis by metformin, which was partially overcome at the highest glucose concentration. An increase in malonyl-CoA supports the production of glycerolipid signaling molecules from the GL/FFA cycle such as DAG and 1-MAG (7, 8, 44, 45), as was also found.
ADP cellular content, which was much higher at basal glucose concentration in metformin-treated cells, reached control values in the presence of stimulatory glucose concentrations; this in turn alters the ATP/ADP ratio that is permissive for KATP channel closure and enhanced insulin secretion (2), satisfying the set criteria for ADP and the ATP/ADP ratio as candidate MCFs. Considering that Mg2+-bound ADP activates KATP channels and prevents β-cell depolarization and insulin exocytosis (46), the present data favor the view that ADP acts as an “off” signal and is functionally more relevant for insulin release than ATP (33, 47–50), at least in the second phase of GIIS.
Cataplerotic metabolites are considered as key coupling factors (51–53) and may play a role in GIIS normalization in the presence of 25 mm glucose in metformin-treated cells. Among the several metabolites measured, only malonyl-CoA, which is derived from cataplerotic citrate in the cytosol, fulfils the set criteria for metabolic signal for insulin secretion. Malonyl-CoA was proposed as a regulatory MCF (2, 29, 55) and is thought to regulate insulin secretion by inhibiting carnitine O-palmitoyltransferase 1, redirecting long chain fatty acyl-CoA away from β-oxidation toward esterification into the GL/FFA cycle and the generation of lipid signaling molecules such as DAG and 1-MAG (8, 44, 56, 57). Thus, β-oxidation, is considered an “off” signal for insulin release (45). It is therefore intriguing to note that despite a decrease in malonyl-CoA level in metformin-treated cells at 8 mm glucose, fatty acid oxidation is not increased. Perhaps in the presence of metformin, malonyl-CoA is not the key factor regulating fat oxidation. Alternatively, in addition to its regulatory role in lipid partitioning, malonyl-CoA could be implicated in GIIS via protein malonylation and fatty acid synthesis as discussed before (2).
HMG-CoA levels, which declined with increasing glucose concentration, inversely correlated with GIIS. However, in terms of metabolic signaling, there is currently no evidence that a reduction in HMG-CoA concentrations could be a signal for GIIS, and no target for this metabolite has been suggested.
DAG and 1-MAG levels in metformin-treated cells were lower at 8 mm glucose accompanied by lower insulin secretion but increase further with increase in glucose to 25 mm, where insulin secretion was restored. Thus, these two metabolites qualify as MCFs for secretion. Interestingly, both metabolites have identified targets related to insulin secretion. The former (sn1,2-DAG) is an activator of some protein kinase C isoforms and the longstanding hypothesis has been put forth that the amplification pathway of GIIS involves DAG production, although this is debated (58). 1-MAG has recently been identified as a MCF via activation of the exocytosis coordinator munc13-1 (7, 8). Interestingly, here we show that the 2-MAG specie levels do not correlate at all with GIIS, strongly supporting the view that only the 1-MAG specie acts as a MCF, as proposed before (7, 8). The decreased formation of glycerolipid signaling molecules can be due to metformin-induced slowdown of the GL/FFA cycle at intermediate glucose concentration, probably involving enhanced AMPK activity in β-cells (40, 41), acting on the lipogenic arm of the cycle (45). The lack of metformin effect on glycerol release at all glucose concentrations is possibly explained by the unaltered Gro3P hydrolysis by the action of the recently identified Gro3P phosphatase (27).
The DHAP/Gro3P ratio, which reflects the cytosolic NAD(H) redox state (31, 32), was influenced by glucose and metformin in a similar fashion as GIIS, thus qualifying a rise in NAD+c/NADHc ratio as a metabolic signal. Enhanced glucose metabolism in the β-cell has previously been shown in pure rat islet β-cells (32) and INS1 (832/13) cells (33) to cause a rise in the NAD+c/NADHc ratio in the face of an elevation in the total cellular NADH/NAD ratio. Although mechanisms have been proposed to link an increased cytosolic NADPH/NADP+ ratio to insulin exocytosis (4), a link between the NAD+c/NADHc ratio and GIIS has not. Its main role may be to favor glycolysis, important to GIIS (32, 33).
Intracellular Ca2+, well-known to be necessary for insulin exocytosis (59), not surprisingly correlated well with insulin secretion and fulfilled the set criteria. The ΔΨm changes with glucose and metformin also met the set criteria as a potential factor important in promoting GIIS. However, we do not know whether ΔΨm is involved per se for normal insulin secretion.
Interestingly, GIIS occurring independently of mitochondrial oxidative phosphorylation has also been reported in liver kinase B1 KO islets (49, 50). Despite markedly impaired mitochondria, glucose was able to effect a distal process in the promotion of insulin exocytosis that involved KATP channel closure, depolarization of the plasma membrane, and insulin exocytosis (49, 50). The current studies with metformin, and those in liver kinase B1 KO islets support the existence of pathways in addition to those supported by mitochondrial respiration.
Metabolic pathways and metabolites that do not qualify as MCFs and some limitations
Some candidate MCFs for GIIS suggested earlier, including H2O2, glutamate, NADPH, and glutathione, failed to qualify as such in the present study. We must emphasize that our current experimental model takes into account pathways and static metabolite levels during a sustained phase of insulin release (45 min after the addition of a glucose stimulus) in INS1 (832/13) cells. Therefore, signals or MCFs that would be transiently elevated or involved solely in the triggering of insulin release could be missed. Moreover, we measured the total cellular content of given metabolites, whereas some signals may be localized to a specific organelle or a cytosolic microenvironment, such as close to exocytosis sites.
Conclusion
The principal findings can be summarized as follows: 1) signals independent of mitochondrial energy metabolism and ATP production play key roles in glucose signaling for insulin secretion, because at supramaximal glucose concentration in the presence of metformin, there is unchanged GIIS despite very pronounced reduction in glucose oxidation, O2 consumption, and ATP production; 2) a reduction in ADP levels rather than a rise in ATP is of primary importance for KATP channel closure and Ca2+ signaling; 3) mitochondrial membrane hyperpolarization correlated well with GIIS and the possibility should be considered that it provides a signal that remains to be defined; 4) a rise in the NAD+c/NADHc ratio may play a role in GIIS; 5) malonyl-CoA likely acts as a regulatory MCF via CPT1 inhibition favoring the accumulation of the signaling glycerolipids 1-MAG and DAG; 6) DAG levels correlated with GIIS and DAG may act via C kinase enzymes and possibly munc13-1; and 7) 1-MAG, but not the 2-MAG, species qualifies as a MCF, likely via munc13-1 exocytotic effector activation (8).
Experimental procedures
Rat islet isolation, cell culture, and metformin treatment
Animal procedures were approved by the Institutional Committee for the Protection of Animals at the Centre de Recherche du Centre Hospitalier de l'Université de Montréal. Pancreatic islets from Wistar rats (Charles River, St. Constant, Canada) were isolated by collagenase digestion of total pancreas and cultured overnight in RPMI 1640, 10% FBS, 10 mm HEPES, pH 7.4, 2 mm glutamine, 1 mm pyruvate (RPMI complete) at 11 mm glucose, as previously described (20). INS1 (832/13) cells were cultured in RPMI complete with 50 μm β-mercaptoethanol at 11 mm glucose, as previously described (20). Prior to experimental incubations, isolated rat islets and 80% confluent INS1 (832/13) cells were first preincubated for 2 h in fresh RPMI complete at 3 mm glucose (islets) or 2 mm glucose with 50 μm β-mercaptoethanol (INS1 (832/13) cells), with and without 5 mm metformin (Sigma). Unless otherwise stated, islets and cells were then washed and further preincubated for 45 min in KRBH containing 0.5% BSA (Fatty acid-free BSA; Sigma) and 3 mm (islets) or 2 mm glucose (cells), with and without 5 mm metformin, and incubated for the indicated time period in KRBH containing 0.5% BSA in presence of the indicated concentration of glucose, with and without 5 mm metformin.
Insulin secretion and glycerol release
Static insulin secretion from isolated rat islets and INS1 (832/13) cells was measured, as previously described (20). Insulin from media and acidified ethanol extracts (for total insulin content) was measured by alphaLISA (PerkinElmer Life Sciences). Glycerol released into the incubation medium was measured using a radiometric method (27, 54).
Glucose and lipid metabolism, mitochondrial membrane potential, and oxygen consumption
Glucose and palmitate oxidation and incorporation of palmitate into glycerolipids were measured using radiolabeled tracers (d-[14C(U)]glucose and [1-14C]palmitic acid) as previously described (20). Separation of glycerolipids (1- and 2-MAG) and total DAG (a mixture of 1,2-DAG and 2,3-DAG) was by thin-layer chromatography on boric acid-coated silica gel plates (prevents isomerization of 1- and 2-MAG species), using a 70:30 chloroform:acetone solvent system (8). Mitochondrial membrane potential was assayed using rhodamine 123 (20). Oxygen consumption and extracellular acidification rates after sequential addition of glucose, oligomycin (ATP synthase inhibitor), FCCP (uncoupler), and rotenone plus antimycin A (electron transport chain inhibitors) were measured on a XF24 extracellular flux analyzer (Seahorse Bioscience, Billerica, MA) (21).
Hydrogen peroxide cellular content
H2O2 was measured as recently described (33). Briefly, INS1 (832/13) cells were grown to 80% confluence in 24-well plates. The cells were preincubated as described above (see “Rat islet isolation, cell culture, and metformin treatment”) and incubated for 20 min in KRBH 0.5% BSA with 2, 6, 10, and 25 mm glucose containing 100 μm Amplex Red reagent (Molecular Probes, Eugene, OR). After incubation, the cells were washed once with ice-cold PBS, scraped off in 100 μl of 0.1 m Tris-HCl 0.1% BSA buffer, and sonicated for 5 s. Cell lysates were transferred into black clear-bottomed 96-well plates to which 100 μl of 1 units/ml horseradish peroxidase was added. After 5 min of incubation, the red fluorescent oxidation product resorufin (excitation, 571 nm; emission, 585 nm) was detected using a plate reader (FLUOstar Optima; BMG Labtech, Ortenberg, Germany). Nonspecific fluorescence values were subtracted from readings, and 0.006% H2O2 and 0.4 μm of the anti-oxidant N-acetylcysteine were included as controls.
Cytosolic Ca2+
INS1 (832/13) cells were seeded 24 h prior to measurements in black 96-well plates with clear bottoms at 60,000 cells/well. KRBH was prepared without bicarbonate and supplemented with 1% BSA, 2.5 mm probenicid, 0.2 mm sulfinpyrazone, 10 μm forskolin, and 50 μm 3-isobutyl-1-methylxanthine (KRBH-C). The cells at 80% confluency were preincubated for 2 h, with and without 5 mm metformin, as described above (see “Rat islet isolation, cell culture, and metformin treatment”). The cells were then washed in KRBH prepared without bicarbonate and supplemented with 1% BSA, 2.5 mm probenicid, 0.2 mm sulfinpyrazone, 10 μm forskolin, and 50 μm 3-isobutyl-1-methylxanthine (KRBH-C) with 2 mm glucose; preincubated for 75 min in KRBH-C, 2 mm glucose ± 5 mm metformin, containing 4 μm Fluo-4 AM (Life Technologies, Burlington, Canada, received as a 1 mm solution in DMSO, which was diluted using an equal volume of warm 20% pluronic F-127 in DMSO (Life Technologies) before its addition to the buffer); washed again with KRBH-C, 2 mm glucose; and further preincubated for 30 min in KRBH-C at 2 mm glucose. After this preincubation, KRBH-C containing glucose was added to attain final concentrations of 2, 6, 10, or 25 mm glucose, and fluorescence was recorded every 55 s for 15 min in a plate reader (FLUOstar Optima, BMG Labtech, Ortenberg, Germany; excitation, 485 nm; emission, 530 nm). Triton X-100 (0.5%) and EGTA (25 mm) were then sequentially added to each well for intracellular Ca2+ concentration calibration. Nonspecific fluorescence values obtained in the presence of EGTA were subtracted from recorded experimental values, and the corrected values were normalized to maximal fluorescence obtained in the presence of Triton.
Targeted metabolomics
INS1 (832/13) cells were treated as for insulin secretion experiments above. Water soluble metabolites believed to be important for GIIS, including glycolytic and citric acid cycle intermediates, short-chain acyl-CoAs, amino acids, purine, and nicotinamide nucleotides, were extracted from cells and analyzed on a LC-MS/MS system, as previously described (27, 28, 33).
Statistical analysis
Prism version 6.05 and InStat version 3.10 (GraphPad Software, San Diego, CA) were used. The results are expressed as means ± S.E. Differences between groups were considered significant at p < 0.05 according to the tests indicated in the figure legends. According to the three criteria to be met for a candidate pathway/signal/MCF for GIIS, the following consistent symbols were used in tables and figures: # for a significant glucose effect from basal to intermediate glucose concentrations under control conditions; * for a metformin-induced inhibition of glucose effect; and a for a glucose effect from intermediate to supramaximal glucose concentrations in the metformin condition and/or restoration of the glucose effect in the metformin condition to that of the control condition at the supramaximal glucose concentration. There were circumstances in which metformin treatment enhanced rather than inhibited a glucose-induced change in cell content of a particular metabolite, and this is represented by †. Such an occurrence is against such a metabolite being a candidate signal/MCF for GIIS.
Author contributions
J. L. designed, performed, and analyzed the experiments and wrote the manuscript. A. A. performed and analyzed the experiments. S. R. M. M. and E. J. conceived and analyzed the experiments and revised the manuscript. B. E. C. and C. J. N. analyzed the experiments and revised the manuscript. M. P. conceived the study, designed and analyzed the experiments, and revised the manuscript. All authors reviewed the results and approved the final version of the manuscript.
Acknowledgments
We thank the Metabolomics and Cellular Physiology Core Facilities of the Centre de Recherche du Centre Hospitalier de l'Université de Montréal and the Montreal Diabetes Research Center for performing the metabolite and insulin determinations.
This work was supported by grants from Canadian Institutes of Health Research (to M. P. and S. R. M. M.) and a scholarship from Kuwait University (to A. A.). The authors declare that they have no conflicts of interest with the contents of this article.
- MCF
- metabolic coupling factor
- DAG
- diacylglycerol
- DHAP
- dihydroxyacetone phosphate
- FCCP
- carbonyl cyanide-p-trifluoromethoxyphenylhydrazone
- GIIS
- glucose-induced insulin secretion
- GL/FFA
- glycerolipid/free fatty acid
- Gro3P
- glycerol 3-phosphate
- KRBH
- Krebs–Ringer bicarbonate buffer with HEPES
- MAG
- monoacylglycerol
- OCR
- oxygen consumption rate
- ANOVA
- analysis of variance.
References
- 1. Thorens B. (2014) Neural regulation of pancreatic islet cell mass and function. Diabetes Obes Metab. 16, 87–95 [DOI] [PubMed] [Google Scholar]
- 2. Prentki M., Matschinsky F. M., and Madiraju S. R. (2013) Metabolic signaling in fuel-induced insulin secretion. Cell Metab. 18, 162–185 [DOI] [PubMed] [Google Scholar]
- 3. Rutter G. A., Pullen T. J., Hodson D. J., and Martinez-Sanchez A. (2015) Pancreatic β-cell identity, glucose sensing and the control of insulin secretion. Biochem. J. 466, 203–218 [DOI] [PubMed] [Google Scholar]
- 4. Ferdaoussi M., and MacDonald P. E. (2017) Toward connecting metabolism to the exocytotic site. Trends Cell Biol. 27, 163–171 [DOI] [PubMed] [Google Scholar]
- 5. El-Azzouny M., Evans C. R., Treutelaar M. K., Kennedy R. T., and Burant C. F. (2014) Increased glucose metabolism and glycerolipid formation by fatty acids and GPR40 receptor signaling underlies the fatty acid potentiation of insulin secretion. J. Biol. Chem. 289, 13575–13588 [DOI] [PMC free article] [PubMed] [Google Scholar]
- 6. Pearson G. L., Mellett N., Chu K. Y., Boslem E., Meikle P. J., and Biden T. J. (2016) A comprehensive lipidomic screen of pancreatic β-cells using mass spectroscopy defines novel features of glucose-stimulated turnover of neutral lipids, sphingolipids and plasmalogens. Mol. Metab. 5, 404–414 [DOI] [PMC free article] [PubMed] [Google Scholar]
- 7. Zhao S., Poursharifi P., Mugabo Y., Levens E. J., Vivot K., Attane C., Iglesias J., Peyot M. L., Joly E., Madiraju S. R., and Prentki M. (2015) α/β-Hydrolase domain-6 and saturated long chain monoacylglycerol regulate insulin secretion promoted by both fuel and non-fuel stimuli. Mol. Metab. 4, 940–950 [DOI] [PMC free article] [PubMed] [Google Scholar]
- 8. Zhao S., Mugabo Y., Iglesias J., Xie L., Delghingaro-Augusto V., Lussier R., Peyot M. L., Joly E., Taïb B., Davis M. A., Brown J. M., Abousalham A., Gaisano H., Madiraju S. R., et al. (2014) α/β-Hydrolase domain-6-accessible monoacylglycerol controls glucose-stimulated insulin secretion. Cell Metab. 19, 993–1007 [DOI] [PubMed] [Google Scholar]
- 9. Mulder H. (2016) Metabolic coupling in pancreatic β cells: lipolysis revisited. Diabetologia 59, 2510–2513 [DOI] [PubMed] [Google Scholar]
- 10. Henquin J. C. (2009) Regulation of insulin secretion: a matter of phase control and amplitude modulation. Diabetologia. 52, 739–751 [DOI] [PubMed] [Google Scholar]
- 11. MacDonald M. J. (1995) Feasibility of a mitochondrial pyruvate malate shuttle in pancreatic islets. Further implication of cytosolic NADPH in insulin secretion. J. Biol. Chem. 270, 20051–20058 [PubMed] [Google Scholar]
- 12. MacDonald M. J., Smith A. D. 3rd, Hasan N. M., Sabat G., and Fahien L. A. (2007) Feasibility of pathways for transfer of acyl groups from mitochondria to the cytosol to form short chain acyl-CoAs in the pancreatic β cell. J. Biol. Chem. 282, 30596–30606 [DOI] [PubMed] [Google Scholar]
- 13. Prentki M., and Madiraju S. R. (2008) Glycerolipid metabolism and signaling in health and disease. Endocr. Rev. 29, 647–676 [DOI] [PubMed] [Google Scholar]
- 14. Straub S. G., and Sharp G. W. (2002) Glucose-stimulated signaling pathways in biphasic insulin secretion. Diabetes Metab. Res. Rev. 18, 451–463 [DOI] [PubMed] [Google Scholar]
- 15. Prentki M., and Nolan C. J. (2006) Islet β cell failure in type 2 diabetes. J. Clin. Invest. 116, 1802–1812 [DOI] [PMC free article] [PubMed] [Google Scholar]
- 16. Andrikopoulos S. (2010) Obesity and type 2 diabetes: slow down! Can metabolic deceleration protect the islet β cell from excess nutrient-induced damage? Mol. Cell. Endocrinol. 316, 140–146 [DOI] [PubMed] [Google Scholar]
- 17. Attané C., Peyot M.-L., Lussier R., Poursharifi P., Zhao S., Zhang D., Morin J., Pineda M., Wang S., Dumortier O., Ruderman N. B., Mitchell G. A., Simons B., Madiraju S. R., Joly E., et al. (2016) A β cell ATGL-lipolysis/adipose tissue axis controls energy homeostasis and body weight via insulin secretion in mice. Diabetologia 59, 2654–2663 [DOI] [PMC free article] [PubMed] [Google Scholar]
- 18. Templeman N. M., Skovsø S., Page M. M., Lim G. E., and Johnson J. D. (2017) A causal role for hyperinsulinemia in obesity. J. Endocrinol. 232, R173–R183 [DOI] [PubMed] [Google Scholar]
- 19. Erion K. A., Berdan C. A., Burritt N. E., Corkey B. E., and Deeney J. T. (2015) Chronic exposure to excess nutrients left-shifts the concentration dependence of glucose-stimulated insulin secretion in pancreatic β-cells. J. Biol. Chem. 290, 16191–16201 [DOI] [PMC free article] [PubMed] [Google Scholar]
- 20. Lamontagne J., Pepin E., Peyot M.-L., Joly E., Ruderman N. B., Poitout V., Madiraju S. R., Nolan C. J., and Prentki M. (2009) Pioglitazone acutely reduces insulin secretion and causes metabolic deceleration of the pancreatic β-cell at submaximal glucose concentrations. Endocrinology 150, 3465–3474 [DOI] [PMC free article] [PubMed] [Google Scholar]
- 21. Lamontagne J., Jalbert-Arsenault E., Pepin E., Peyot M.-L., Ruderman N. B., Nolan C. J., Joly E., Madiraju S. R., Poitout V., and Prentki M. (2013) Pioglitazone acutely reduces energy metabolism and insulin secretion in rats. Diabetes 62, 2122–2129 [DOI] [PMC free article] [PubMed] [Google Scholar]
- 22. Hohmeier H. E., Mulder H., Chen G., Henkel-Rieger R., Prentki M., and Newgard C. B. (2000) Isolation of INS-1-derived cell lines with robust ATP-sensitive K+ channel-dependent and -independent glucose-stimulated insulin secretion. Diabetes 49, 424–430 [DOI] [PubMed] [Google Scholar]
- 23. Spégel P., Andersson L. E., Storm P., Sharoyko V., Göhring I., Rosengren A. H., and Mulder H. (2015) Unique and shared metabolic regulation in clonal β-cells and primary islets derived from rat revealed by metabolomics analysis. Endocrinology 156, 1995–2005 [DOI] [PubMed] [Google Scholar]
- 24. Murphy M. P. (2009) How mitochondria produce reactive oxygen species. Biochem. J. 417, 1–13 [DOI] [PMC free article] [PubMed] [Google Scholar]
- 25. Pi J., Bai Y., Zhang Q., Wong V., Floering L. M., Daniel K., Reece J. M., Deeney J. T., Andersen M. E., Corkey B. E., and Collins S. (2007) Reactive oxygen species as a signal in glucose-stimulated insulin secretion. Diabetes 56, 1783–1791 [DOI] [PubMed] [Google Scholar]
- 26. Nicholls D. G. (2016) The pancreatic β-cell: a bioenergetic perspective. Physiol. Rev. 96, 1385–1447 [DOI] [PubMed] [Google Scholar]
- 27. Mugabo Y., Zhao S., Seifried A., Gezzar S., Al-Mass A., Zhang D., Lamontagne J., Attane C., Poursharifi P., Iglesias J., Joly E., Peyot M.-L., Gohla A., Madiraju S. R., and Prentki M. (2016) Identification of a mammalian glycerol-3-phosphate phosphatase: role in metabolism and signaling in pancreatic β-cells and hepatocytes. Proc. Natl. Acad. Sci. 113, E430–E439 [DOI] [PMC free article] [PubMed] [Google Scholar]
- 28. Guay C., Joly E., Pepin E., Barbeau A., Hentsch L., Pineda M., Madiraju S. R., Brunengraber H., and Prentki M. (2013) A role for cytosolic isocitrate dehydrogenase as a negative regulator of glucose signaling for insulin secretion in pancreatic β-cells. PLoS One 8, e77097. [DOI] [PMC free article] [PubMed] [Google Scholar]
- 29. Prentki M., Vischer S., Glennon M. C., Regazzi R., Deeney J. T., and Corkey B. E. (1992) Malonyl-CoA and long chain acyl-CoA esters as metabolic coupling factors in nutrient-induced insulin secretion. J. Biol. Chem. 267, 5802–5810 [PubMed] [Google Scholar]
- 30. Corkey B. E., Glennon M. C., Chen K. S., Deeney J. T., Matschinsky F. M., and Prentki M. (1989) A role for malonyl-CoA in glucose-stimulated insulin secretion from clonal pancreatic β-cells. J. Biol. Chem. 264, 21608–21612 [PubMed] [Google Scholar]
- 31. Corkey B. E., and Shirihai O. (2012) Metabolic master regulators: sharing information among multiple systems. Trends Endocrinol. Metab. 23, 594–601 [DOI] [PMC free article] [PubMed] [Google Scholar]
- 32. Matschinsky F. M., Ghosh A. K., Meglasson M. D., Prentki M., June V., and von Allman D. (1986) Metabolic concomitants in pure, pancreatic β cells during glucose-stimulated insulin secretion. J. Biol. Chem. 261, 14057–14061 [PubMed] [Google Scholar]
- 33. Mugabo Y., Zhao S., Lamontagne J., Al-Mass A., Peyot M.-L., Corkey B. E., Joly E., Madiraju S. R. M., and Prentki M. (2017) Metabolic fate of glucose and candidate signaling and excess-fuel detoxification pathways in pancreatic β-cells. J. Biol. Chem. 292, 7407–7422 [DOI] [PMC free article] [PubMed] [Google Scholar]
- 34. Madiraju A. K., Erion D. M., Rahimi Y., Zhang X.-M., Braddock D. T., Albright R. A., Prigaro B. J., Wood J. L., Bhanot S., MacDonald M. J., Jurczak M. J., Camporez J.-P., Lee H.-Y., Cline G. W., Samuel V. T., et al. (2014) Metformin suppresses gluconeogenesis by inhibiting mitochondrial glycerophosphate dehydrogenase. Nature. 510, 542–546 [DOI] [PMC free article] [PubMed] [Google Scholar]
- 35. Owen M. R., Doran E., and Halestrap A. P. (2000) Evidence that metformin exerts its anti-diabetic effects through inhibition of complex 1 of the mitochondrial respiratory chain. Biochem. J. 348, 607–614 [PMC free article] [PubMed] [Google Scholar]
- 36. Brunmair B., Staniek K., Gras F., Scharf N., Althaym A., Clara R., Roden M., Gnaiger E., Nohl H., Waldhäusl W., and Fürnsinn C. (2004) Thiazolidinediones, like metformin, inhibit respiratory complex I: a common mechanism contributing to their antidiabetic actions? Diabetes 53, 1052–1059 [DOI] [PubMed] [Google Scholar]
- 37. Foretz M., Guigas B., Bertrand L., Pollak M., and Viollet B. (2014) Metformin: from mechanisms of action to therapies. Cell Metab. 20, 953–966 [DOI] [PubMed] [Google Scholar]
- 38. Hinke S. A., Martens G. A., Cai Y., Finsi J., Heimberg H., Pipeleers D., and Van de Casteele M. (2007) Methyl succinate antagonises biguanide-induced AMPK-activation and death of pancreatic β-cells through restoration of mitochondrial electron transfer. Br. J. Pharmacol. 150, 1031–1043 [DOI] [PMC free article] [PubMed] [Google Scholar]
- 39. Masini M., Anello M., Bugliani M., Marselli L., Filipponi F., Boggi U., Purrello F., Occhipinti M., Martino L., Marchetti P., and De Tata V. (2014) Prevention by metformin of alterations induced by chronic exposure to high glucose in human islet β cells is associated with preserved ATP/ADP ratio. Diabetes Res. Clin. Pract. 104, 163–170 [DOI] [PubMed] [Google Scholar]
- 40. Kefas B. A., Cai Y., Kerckhofs K., Ling Z., Martens G., Heimberg H., Pipeleers D., and Van de Casteele M. (2004) Metformin-induced stimulation of AMP-activated protein kinase in β-cells impairs their glucose responsiveness and can lead to apoptosis. Biochem. Pharmacol. 68, 409–416 [DOI] [PubMed] [Google Scholar]
- 41. Leclerc I., Woltersdorf W. W., da Silva Xavier G., Rowe R. L., Cross S. E., Korbutt G. S., Rajotte R. V., Smith R., and Rutter G. A. (2004) Metformin, but not leptin, regulates AMP-activated protein kinase in pancreatic islets: impact on glucose-stimulated insulin secretion. Am. J. Physiol. Endocrinol. Metab. 286, E1023–E1031 [DOI] [PubMed] [Google Scholar]
- 42. Bridges H. R., Jones A. J., Pollak M. N., and Hirst J. (2014) Effects of metformin and other biguanides on oxidative phosphorylation in mitochondria. Biochem. J. 462, 475–487 [DOI] [PMC free article] [PubMed] [Google Scholar]
- 43. Salani B., Del Rio A., Marini C., Sambuceti G., Cordera R., and Maggi D. (2014) Metformin, cancer and glucose metabolism. Endocr. Relat. Cancer 21, R461–R471 [DOI] [PubMed] [Google Scholar]
- 44. Nolan C. J., Madiraju M. S., Delghingaro-Augusto V., Peyot M.-L., and Prentki M. (2006) Fatty acid signaling in the β-cell and insulin secretion. Diabetes 55, S16–S23 [DOI] [PubMed] [Google Scholar]
- 45. Prentki M., and Madiraju S. R. (2012) Glycerolipid/free fatty acid cycle and islet β-cell function in health, obesity and diabetes. Mol. Cell. Endocrinol. 353, 88–100 [DOI] [PubMed] [Google Scholar]
- 46. Nichols C. G., Shyng S. L., Nestorowicz A., Glaser B., Clement J. P. 4th, Gonzalez G., Aguilar-Bryan L., Permutt M. A., and Bryan J. (1996) Adenosine diphosphate as an intracellular regulator of insulin secretion. Science 272, 1785–1787 [DOI] [PubMed] [Google Scholar]
- 47. Lorenz M. A., El Azzouny M. A., Kennedy R. T., and Burant C. F. (2013) Metabolome response to glucose in the β-cell line INS-1 832/13. J. Biol. Chem. 288, 10923–10935 [DOI] [PMC free article] [PubMed] [Google Scholar]
- 48. Aguilar-Bryan L., and Bryan J. (1999) Molecular biology of adenosine triphosphate-sensitive potassium channels. Endocr. Rev. 20, 101–135 [DOI] [PubMed] [Google Scholar]
- 49. Fu A., Robitaille K., Faubert B., Reeks C., Dai X.-Q., Hardy A. B., Sankar K. S., Ogrel S., Al-Dirbashi O. Y., Rocheleau J. V., Wheeler M. B., MacDonald P. E., Jones R., and Screaton R. A. (2015) LKB1 couples glucose metabolism to insulin secretion in mice. Diabetologia 58, 1513–1522 [DOI] [PubMed] [Google Scholar]
- 50. Swisa A., Granot Z., Tamarina N., Sayers S., Bardeesy N., Philipson L., Hodson D. J., Wikstrom J. D., Rutter G. A., Leibowitz G., Glaser B., and Dor Y. (2015) Loss of liver kinase B1 (LKB1) in β cells enhances glucose-stimulated insulin secretion despite profound mitochondrial defects. J. Biol. Chem. 290, 20934–20946 [DOI] [PMC free article] [PubMed] [Google Scholar]
- 51. Panten U., Willenborg M., Schumacher K., Hamada A., Ghaly H., and Rustenbeck I. (2013) Acute metabolic amplification of insulin secretion in mouse islets is mediated by mitochondrial export of metabolites, but not by mitochondrial energy generation. Metabolism 62, 1375–1386 [DOI] [PubMed] [Google Scholar]
- 52. MacDonald M. J., Fahien L. A., Brown L. J., Hasan N. M., Buss J. D., and Kendrick M. A. (2005) Perspective: emerging evidence for signaling roles of mitochondrial anaplerotic products in insulin secretion. Am. J. Physiol. Endocrinol. Metab. 288, E1–E15 [DOI] [PubMed] [Google Scholar]
- 53. Farfari S., Schulz V., Corkey B., and Prentki M. (2000) Glucose-regulated anaplerosis and cataplerosis in pancreatic β-cells: possible implication of a pyruvate/citrate shuttle in insulin secretion. Diabetes 49, 718–726 [DOI] [PubMed] [Google Scholar]
- 54. Bradley D. C., and Kaslow H. R. (1989) Radiometric assays for glycerol, glucose, and glycogen. Anal. Biochem. 180, 11–16 [DOI] [PubMed] [Google Scholar]
- 55. Roduit R., Nolan C., Alarcon C., Moore P., Barbeau A., Delghingaro-Augusto V., Przybykowski E., Morin J., Massé F., Massie B., Ruderman N., Rhodes C., Poitout V., and Prentki M. (2004) A role for the malonyl-CoA/long-chain acyl-CoA pathway of lipid signaling in the regulation of insulin secretion in response to both fuel and nonfuel stimuli. Diabetes 53, 1007–1019 [DOI] [PubMed] [Google Scholar]
- 56. Ferdaoussi M., Bergeron V., Zarrouki B., Kolic J., Cantley J., Fielitz J., Olson E. N., Prentki M., Biden T., MacDonald P. E., and Poitout V. (2012) G protein-coupled receptor (GPR)40-dependent potentiation of insulin secretion in mouse islets is mediated by protein kinase D1. Diabetologia 55, 2682–2692 [DOI] [PMC free article] [PubMed] [Google Scholar]
- 57. Sheu L., Pasyk E. A., Ji J., Huang X., Gao X., Varoqueaux F., Brose N., and Gaisano H. Y. (2003) Regulation of insulin exocytosis by Munc13–1. J. Biol. Chem. 278, 27556–27563 [DOI] [PubMed] [Google Scholar]
- 58. Schmitz-Peiffer C., and Biden T. J. (2008) Protein kinase C function in muscle, liver, and β-cells and its therapeutic implications for type 2 diabetes. Diabetes 57, 1774–1783 [DOI] [PMC free article] [PubMed] [Google Scholar]
- 59. Wollheim C. B., and Sharp G. W. (1981) Regulation of insulin release by calcium. Physiol. Rev. 61, 914–973 [DOI] [PubMed] [Google Scholar]