Abstract
Current anti-epidermal growth factor receptor (EGFR) therapy for oral cancer does not provide satisfactory efficacy due to drug resistance or reduced EGFR level. As an alternative candidate target for therapy, here we identified an oncogene, ROS1, as an important driver for oral squamous cell carcinoma (OSCC) metastasis. Among tumors from 188 oral cancer patients, upregulated ROS1 expression strongly correlated with metastasis to lung and lymph nodes. Mechanistic studies uncover that the activated ROS1 results from highly expressed ROS1 gene instead of gene rearrangement, a phenomenon distinct from other cancers. Our data further reveal a novel mechanism that reduced histone methyltransferase EZH2 leads to a lower trimethylation of histone H3 lysine 27 suppressive modification, relaxes chromatin, and promotes the accessibility of the transcription factor STAT1 to the enhancer and the intron regions of ROS1 target genes, CXCL1 and GLI1, for upregulating their expressions. Down-regulation of ROS1 in highly invasive OSCC cells, nevertheless, reduces cell proliferation and inhibits metastasis to lung in the tail-vein injection and the oral cavity xenograft models. Our findings highlight ROS1 as a candidate biomarker and therapeutic target for OSCC. Finally, we demonstrate that co-targeting of ROS1 and EGFR could potentially offer an effective oral cancer therapy.
Introduction
Oral squamous cell carcinoma (OSCC) is the most prevalent (more than 90%) oral cancer. Nearly 145 400 people died of oral cancer and 300 400 new cases occurred globally in 2012.1 The causes of OSCC include chronic irritation and inflammation from tobacco smoking, alcohol consumption, betel nut chewing, and HPV infection.2, 3, 4, 5, 6 Inhibitors and blocking antibodies of epidermal growth factor receptor (EGFR) have been used clinically to treat OSCC because EGFR level is elevated in 70–90% of patients with OSCC.7 However, clinical trials for therapies that target EGFR have not been successful for head and neck cancers.8 One recent study showed that, among patients exhibiting primary OSCC, their invasiveness correlated inversely with the level of EGFR in cells.9 This result explains why the response rate for treatment with anti-EGFR (cetuximab) is only 13% for head and neck cancers.10 Another study demonstrated that only 10–15% of those with Stage I oral cancer responded to erlotinib (EGFR inhibitor), and patients of Stage II–IV did not respond to treatment at all.11 Findings from these two studies underscore the heterogeneity of oral cancer and reveal that additional factors must be involved in determining the invasiveness of OSCC. Thus, understanding the mechanisms that underlie differential drug sensitivity of OSCC is key to the development of improved therapeutic strategies to circumvent the lack of efficacy for late-stage OSCC patients.
We speculate that, to overcome EGFR resistance, the molecular mechanism may involve compensating for EGFR signaling. Here, we screened the expression of 16 receptor tyrosine kinases (RTKs) that have previously been implicated in tumorigenesis, and found that the oncogene ROS1 is upregulated in highly invasive OSCC. v-ROS was originally identified as an oncogenic RTK encoded in the genome of avian sarcoma virus UR2,12, 13, 14 and ROS1 is the human homolog of v-ROS,15, 16, 17 for which the cellular ligand remains unknown. Constitutive activation of ROS1 was resulted from genetic rearrangement in non-small-cell lung cancer, glioblastoma, cholangiocarcinoma, ovarian cancer, and gastric adenocarcinoma. The 5′ fusion partners of ROS1 identified to date include FIG, SLC34A2, CD74, TPM3, SDC4, EZR, LRIG3, KDELR2, YWHAE, TFG, CEP85L, and CCDC6.18 Although efforts have been devoted to studying the effect of constitutively active ROS1 fusion proteins, the regulation of endogenous ROS1 expression and the role of ROS1 amplification in cancer are not clear. An emerging theme suggests that cancer is a consequence of a dysregulated epigenome, which grants for phenotypic selection in the dynamic microenvironment.19 Epigenetic modifications confer cancer cell plasticity, thereby allowing cells to circumvent the control of development/differentiation, resulting in cellular heterogeneity.
In this study, we investigated the mechanisms that contributed to the metastasis of OSCC, revealing that upregulated expression of the ROS1 oncogene correlates with metastatic potential and recurrence among 188 OSCC patients. We determined the mechanisms that led to ROS1 upregulation and found that treatment with inhibitors of ROS1 and EGFR dramatically decreased the invasiveness of OSCC and therefore could provide substantial clinical benefits to patients.
Results
Upregulated ROS1 in highly invasive OSCC cells
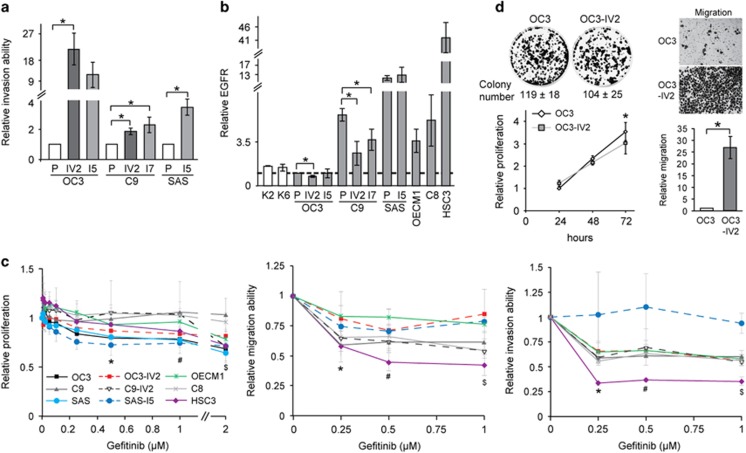
We have established several isogenic pairs of highly invasive OSCC cell lines through in vitro or in vivo selections.20 OC3-I5, C9-I7, and SAS-I5 were highly invasive lines derived from their respective parental lines, OC3, C9, and SAS, acquired through serial Boyden chamber invasion assay (in vitro selection). OC3-IV2 and C9-IV2 lines were established from lung metastases after tail vein injection of OC3 or C9 cells into CB17-SCID mice (in vivo selection). The relative invasiveness of these OSCC isogenic lines was compared (Figure 1a). In clinical practice, anti-EGFR is the most common therapy for oral cancer.21 Thus, EGFR level in keratinocytes from normal oral mucosa (K2 and K6 cells) and OSCC cell lines were compared. As shown in Figure 1b, EGFR level varied up to 40-fold among the different OSCC cell lines; notably, the levels in the more invasive lines OC3-IV2, C9-IV2, and C9-I7 were lower than those in their respective parental lines OC3 and C9 (Figure 1b). No obvious difference between SAS and SAS-I5 cells was likely attributed to the constitutively high EGFR levels in these cells. These data suggest that EGFR is not the only candidate biomarker for oral cancer. In fact, reduced EGFR expression correlated with greater invasiveness of OSCC. When treated with the EGFR inhibitor gefitinib (dose range 0.005–2 μM), the proliferation of most OSCC cell lines was reduced 20–30%, whereas C9 and C8 cells were not affected by gefitinib treatment (Figure 1c, left panel). Gefitinib treatment reduced cell migration and invasion by 20–40% for most OSCC lines (Figure 1c, middle and right panels). Interestingly, both SAS-I5 and HSC3 cells had a relatively high EGFR level, but their sensitivity to gefitinib differed substantially; neither the invasion nor migration capacity of SAS-I5 cells was significantly affected by gefitinib, whereas these abilities were reduced by 50–70% for HSC3 cells (Figure 1c, middle and right panels). These results illustrate that OSCC cells are heterogeneous and that the inhibition of EGFR may not always yield the expected outcomes.
Figure 1.
The correlation of EGFR expression and OSCC cell invasion. (a) Invasion potential of each of OC3, C9, SAS, and their isogenic pairs of highly invasive OSCC cell lines was determined with the Boyden chamber assay. (b) Protein levels of EGFR in OSCC cells were determined using Western blotting. Protein levels in OSCC cells were normalized to that in OC3 cells. P: parental cells. (c) Left: The MTT assay was used to determine proliferation of OSCC cells treated with different concentrations of gefitinib for 72 h. Middle and right: Migration and invasion potential of OSCC cell lines treated with different concentrations of gefitinib was assessed with the Boyden chamber assay. Values for proliferation, migration, and invasion were normalized to those for OSCC cells treated with control (DMSO). *, #, $Compared with DMSO treatment. (Proliferation: *OC3, SAS, SAS-I5; #OC3, SAS, SAS-I5, HSC3; $OC3, OC3-IV2, C9-IV2, SAS, HSC3. Migration: *C9, C8, SAS-I5, HSC3; #, $C9, C9-IV2, C8, OECM1, SAS-I5, HSC3. Invasion: *, $OC3-IV2, C9, C9-IV2, C8, OECM1, HSC3; #OC3-IV2, C9, C8, OECM1, HSC3.) (d) Left: Colony formation assays were performed for 12 days, and the quantification of colony number from three independent experiments is presented as the mean±SEM. Bottom: proliferation of OC3 and OC3-IV2 cells was assessed using the MTT assays. Proliferation was normalized to that of OC3 cells growing for 24 h. *Comparison between the two cell lines for the same time point. Right: Migration of OC3 and OC3-IV2 cells were determined with the Boyden chamber assays. The quantified results are shown at the bottom. Data from at least three independent experiments are presented as mean±SEM (*, #, $P<0.05).
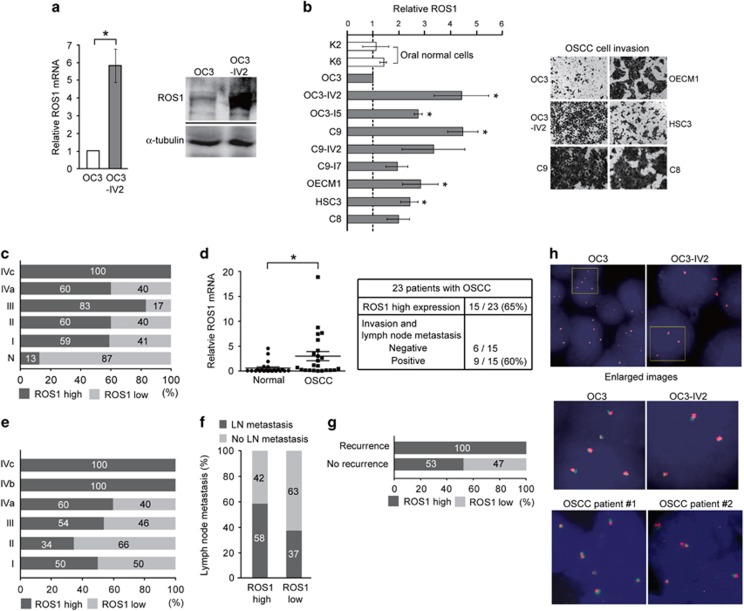
The fold increase of invasiveness was the highest for the OC3 and OC3-IV2 isogenic pair (Figure 1a), thus they were chosen as model cell lines to search for molecules responsible for OSCC invasiveness. Colony formation and MTT assays revealed that OC3 cells proliferated slightly faster than OC3-IV2 cells. Based on Boyden chamber invasion assays, OC3-IV2 cells exhibited significantly increased migration and invasion compared with OC3 cells (Figures 1a and d). Dysregulated expression and/or activation of RTKs are often associated with malignant transformation.22, 23 To search for candidate RTKs that may be responsible for the observed invasiveness of OC3-IV2 cells, we measured mRNA levels of 16 RTKs that have previously been implicated in tumorigenesis. Among those, ROS1 mRNA level was higher in OC3-IV2 cells than in OC3 cells (Supplementary Figure 1), and quantitative PCR (Q-PCR) analysis revealed a ~6-fold difference (Figure 2a, left panel). Similarly, ROS1 protein level was greatly increased in OC3-IV2 cells (Figure 2a, right panel). We compared ROS1 protein level among isogenic lines of OSCC cells, revealing an increased ROS1 level in all isogenic OSCC lines compared to the normal and OC3 cells (Figure 2b, left panel). Likewise, the invasion capacity of C9, OECM1, HSC3, and C8 cells was greater than that of OC3 cells (Figure 2b, right panel), correlating with the elevated ROS1 level measured in these cells. ROS1 protein level was also examined using tissue arrays containing samples from 64 normal and OSCC subjects; increased ROS1 level strongly correlated with higher metastasis (Figure 2c and Supplementary Figure 2). Elevated ROS1 levels were apparent in more than 60% of the oral cancer patients and in 100% Stage IV patients with distant metastasis (Stage IVc). Moreover, ROS1 mRNA level was measured in 23 pairs of matched normal and cancer tissues from OSCC patients from southern Taiwan; ROS1 mRNA was elevated in 15 of 23 patient tissues compared with normal tissues. In addition, 60% of OSCC patients with ROS1 upregulation exhibited lymph node metastasis (Figure 2d). In line with those findings, 101 OSCC samples from northern Taiwan also showed a significant correlation between high ROS1 level and metastasis and recurrence (Figures 2e–g). Our results demonstrate a strong correlation between upregulated ROS1 level and the prevalence of OSCC metastasis. As ROS1 fusions with other genes have been reported in a variety of cancer types, FISH was performed using ROS1 split FISH probes to determine the existence of ROS1 rearrangements in OSCC cell lines and 10 OSCC patient samples. Split signals were not observed, suggesting the lack of ROS1 fusion with any other gene in these cell lines and OSCC patient samples (Figure 2h). To confirm this result, we sequenced the 5’ region of ROS1 as well as the full-length mRNA; no gene fusion was found (data not shown).
Figure 2.
Identification of ROS1 in the highly invasive OSCC cell lines and the clinical relevance of high ROS1 level. (a) Left: ROS1 mRNA level was measured by Q-PCR. Right: Western blotting was performed with anti-ROS1. (b) Left: ROS1 protein levels in normal and OSCC cells were quantified by Western blotting. Protein levels in OSCC cells were normalized to those in OC3 cells. Data from at least three independent experiments are presented as mean±SEM (*Compared with OC3, P<0.05). Right: Representative images of OSCC cell invasion. (c) Expression of ROS1 in normal and OSCC tissues from commercial tissue arrays containing samples for 64 patients was analyzed using IHC. Samples were sub-grouped according to tumor stage. (Normal tissue from autopsy: n=8; Stage I: n=23; Stage II: n=15; Stage III: n=6; Stage IVa: n=10; Stage IVc: n=2) Stage I: primary tumor is less than 2 cm in diameter. Stage II: primary tumor is more than 2 cm in diameter, but less than 4 cm. Stage III: primary tumor is more than 4 cm in diameter or cervical lymph node metastasis is detected (metastatic tumor is less than or equal to 3 cm in diameter). Stage IVa: primary tumor invades adjacent tissues and/or cervical lymph node metastasis is detected (metastatic tumor is more than 3 cm in diameter, but less than or equal to 6 cm). Stage IVb: primary tumor invades adjacent tissues and cervical lymph node metastasis is detected (metastatic tumor is more than 6 cm in diameter). Stage IVc: distant metastasis has occurred. (d) Relative ROS1 mRNA levels in tissues of 23 OSCC patients from Kaohsiung Medical University, Taiwan, were measured using Q-PCR compared with their matched normal oral tissues (*P<0.05). The correlation between ROS1 level and metastasis of OSCC is shown in the table below. (e–g) Clinical OSCC samples (101 total) from Taipei Veterans General Hospital were analyzed for ROS1 expression. Samples were sub-grouped according to tumor stage (Stage I: n=2; Stage II: n=29; Stage III: n=13; Stage IVa: n=52; Stage IVb: n=3; Stage IVc: n=2) (e). Percentages of patients with cervical lymph node metastasis were grouped by ROS1 expression level (high, low) (f) and with or without recurrence (g). (h) FISH analysis uses a 5’ ROS1 probe (red) and a 3’ ROS1 probe (green) to hybridize ROS1 gene region in OC3 and OC3-IV2 cells and in clinical OSCC tissues from Taipei Veterans General Hospital. The ROS1 locus is shown as co-localized red and green signals. Nuclei were stained with DAPI.
Effect of upregulated ROS1 in migration, invasion and lung colonization of OSCC cells
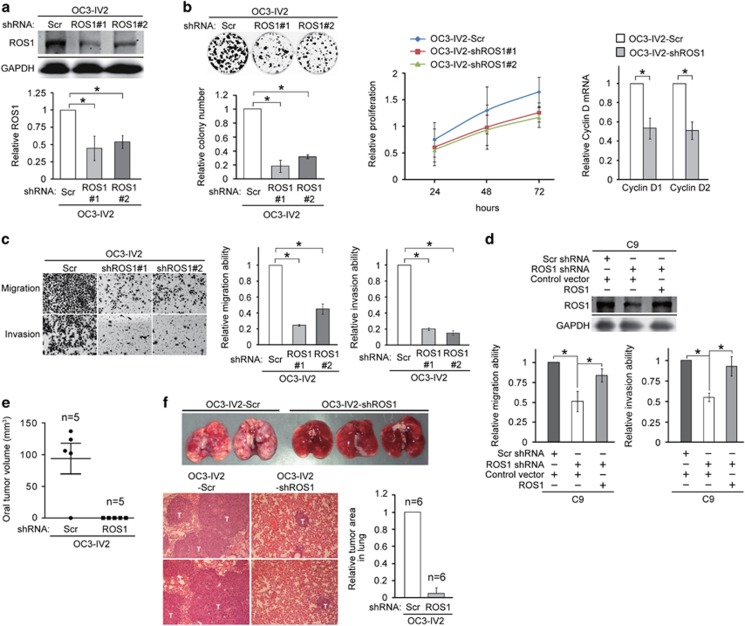
To determine whether our observed upregulated ROS1 level could increase the migration and invasion capacities of OC3-IV2 cells, we established OC3-IV2 cells stably expressing a scrambled shRNA (OC3-IV2-Scr) or ROS1-specific shRNA (OC3-IV2-shROS1#1 and #2). ROS1 protein levels in OC3-IV2-shROS1#1 and OC3-IV2-shROS1#2 were reduced by 40–50% compared with that in control OC3-IV2-Scr cells (Figure 3a). The proliferation of OC3-IV2-shROS1 cells was reduced compared with control cells based on colony formation and MTT assays (Figure 3b, left and middle panels), consistent with the reduced expression of the G1-S cell-cycle regulators cyclin D1 and cyclin D2 in OC3-IV2-shROS1 cells (Figure 3b, right panel). ROS1 knockdown also significantly inhibited migration and invasion of OC3-IV2 cells (Figure 3c). Furthermore, the reduced C9 cell migration and invasion due to ROS1 knockdown could be rescued by overexpression of ROS1 (Figure 3d). In a parallel in vivo study, OC3-IV2-Scr and OC3-IV2-shROS1 cells were orthotopically injected into the oral buccal mucosa of SCID mice. No tumor formation was detected in mice injected with OC3-IV2-shROS1 cells; in contrast, tumor volume was ~117 mm3 in mice injected with OC3-IV2-Scr (Figure 3e). OC3-IV2-Scr and OC3-IV2-shROS1 cells were also injected into SCID mice via tail vein. The ROS1 knockdown prevented OSCC metastasis and colonization in lungs (Figure 3f). These data indicate that ROS1 is required for the increased migration, invasion, proliferation, and lung metastasis of OSCC cells.
Figure 3.
Effect of elevated ROS1 level in OSCC cell migration, invasion, and lung colonization. (a) Western blotting to quantify ROS1 from OC3-IV2-Scramble (Scr), OC3-IV2-shROS1#1, and #2 stable cell lines. (b) Left: Colony formation assays for OC3-IV2-Scr, OC3-IV2-shROS1#1, and #2 cells; quantified results are shown. Middle: Relative proliferation of OC3-IV2-Scr, OC3-IV2-shROS1#1, and #2 cells was assessed with the MTT assay. Right: Relative cyclin D1 and D2 mRNA expression in OC3-IV2-Scr and OC3-IV2-shROS1#1 cells was measured using Q-PCR. (c) Migration and invasion of OC3-IV2-Scr, OC3-IV2-shROS1#1, and #2 cells were quantified with the Boyden chamber assay. (d) Upper: Western blotting for ROS1 from C9-shROS1 stable cells transiently transfected with ROS1-encoded plasmid. Bottom: Migration and invasion of C9-shROS1 stable cells overexpressing ROS1 were quantified with the Boyden chamber assay. (e) OC3-IV2-Scr or OC3-IV2-shROS1#1 cells were injected into oral buccal mucosa of SCID mice. Oral tumor volume (mm3) was measured 2.5 months after injection. (f) OC3-IV2-Scr or OC3-IV2-shROS1#1 cells were injected into the tail vein of SCID mice. Lung tissues were taken 2.5 months after injection. Images of lung (upper panels) and H&E staining of lung tissue sections (bottom panels) are shown. T: metastatic tumor area. Relative tumor areas in lung were measured from two independent experiments of six mice total.
Synergistic effect of co-treatment of OSCC cells with gefitinib and either foretinib or crizotinib
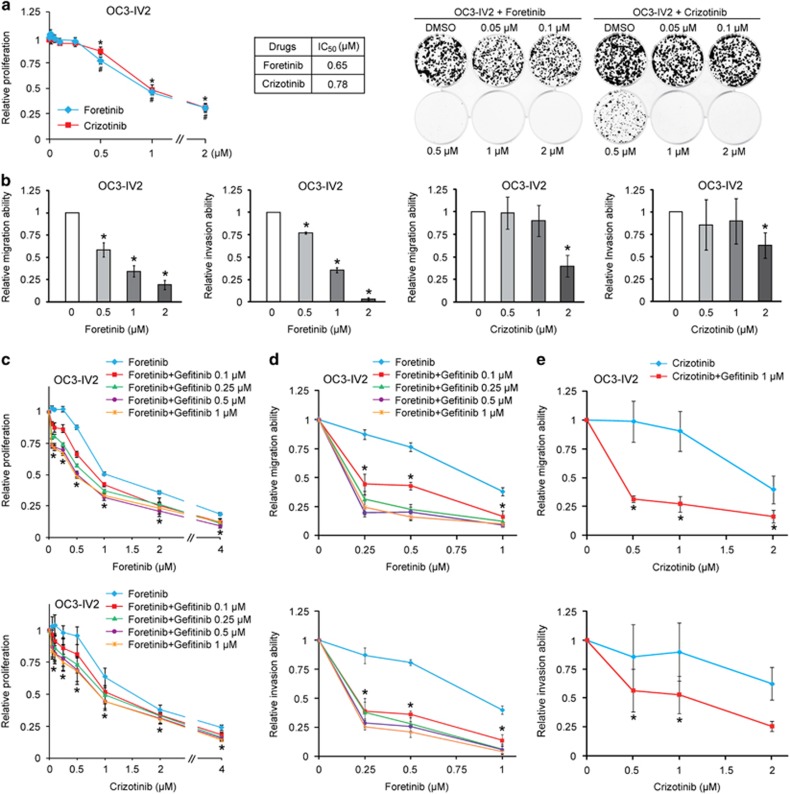
We next treated OSCC cells with ROS1 inhibitors, foretinib and crizotinib. Cell proliferation was inhibited by 50% at ⩾1 μM (Figure 4a). Cell migration and invasion were significantly inhibited by ⩾0.5 μM foretinib (Figure 4b, left panels), yet inhibition was only observed with 2 μM crizotinib (right panels). The differential potency of these two inhibitors echoes published result that foretinib is a relatively more specific ROS1 inhibitor than crizotinib.24 Based on the above findings, we hypothesized that the ROS1 pathway may compensate for downregulated EGFR signaling or EGFR resistance during late stage of OSCC. OSCC cells were treated with foretinib/crizotinib alone or in combination with 0.1–1 μM gefitinib. Combined treatment with 0.1 μM gefitinib and 0.1–1 μM foretinib or crizotinib resulted in an additional 10–20% inhibition of OC3-IV2 cell proliferation compared with foretinib/crizotinib alone (Figure 4c). In contrast, co-treatment with foretinib and gefitinib drastically inhibited cell migration and invasion by 60–80% (Figure 4d). Similarly, co-treatment with 0.5–2 μM crizotinib and 1 μM gefitinib also synergistically inhibited OSCC cell migration and invasion (Figure 4e). In addition, co-treatment with foretinib or crizotinib and gefitinib inhibited the proliferation, migration, and invasion capacities of C9 and C9-IV2 cells more so than with foretinib or crizotinib alone (Supplementary Figure 3). These results demonstrate that ROS1 collaborates with EGFR to promote OSCC cell proliferation, migration, and invasion and that combined treatment with foretinib and gefitinib improves the efficacy of inhibiting highly invasive OSCC.
Figure 4.
Inhibitor assays for highly invasive OSCC cells. (a) Left: Proliferation of OC3-IV2 cells treated with different concentrations of foretinib or crizotinib for 72 h was measured with the MTT assay. Proliferation was normalized to that of OC3-IV2 cells treated with control (DMSO). *, #Compared with DMSO treatment. IC50 values for foretinib and crizotinib are shown. Right: Colony formation of OC3-IV2 cells treated with different concentrations of foretinib or crizotinib for 12 days; representative images are shown. (b) Cell migration and invasion of OC2-IV2 cells treated with different concentrations of foretinib or crizotinib were quantified with the Boyden chamber assay. (c) Proliferation of OC3-IV2 cells treated with foretinib/crizotinib alone or in combination with the indicated concentrations of gefitinib for 72 h was measured with the MTT assay. *Compared with foretinib or crizotinib alone. (d and e) Migration and invasion of OC3-IV2 cells treated with foretinib (d) or crizotinib (e) alone or in combination with the indicated concentrations of gefitinib were assessed with the Boyden chamber assay. Values for proliferation, migration, and invasion were normalized to those for OC3-IV2 cells treated with DMSO. *Compared with foretinib or crizotinib alone. Data from at least three independent experiments are presented as mean±SEM (*, #P<0.05).
Epigenetic regulation of ROS1
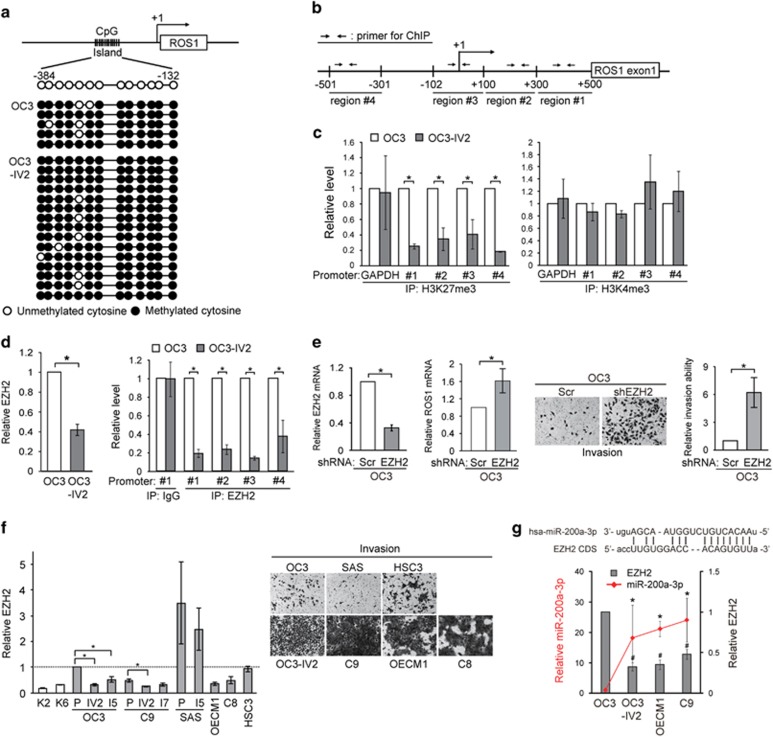
To understand the mechanisms responsible for the increased ROS1 expression in OSCC tumors, DNA methylation and histone modification at the ROS1 promoter were examined. The CpG islands between nucleotides –384 to –132 within the promoter were previously reported to be the main regulatory region of ROS1.25 Bisulfite sequencing analysis revealed a comparable degree of methylation at the ROS1 promoter between OC3 and OC3-IV2 cells (Figure 5a). Thus, DNA methylation is not likely to contribute to the increased expression of ROS1 in OSCC. Histone H3 methylation contributes to either activation or repression of transcription; histone H3 lysine 4 tri-methylation (H3K4me3) represents transcriptional activation, whereas H3K27me3 marks transcriptional repression.26, 27, 28, 29 ChIP assays were performed to identify histone modifications at the 5’ region of ROS1 (Figure 5b). In OC3-IV2 cells, H3K27me3 in the ROS1 region was decreased compared with OC3 cells (Figure 5c, left panel), whereas H3K4me3 did not differ between the two cell lines (Figure 5c, right panel). It is thus suggested that the reduced H3K27me3 at the 5’ region of ROS1 might contribute to increased ROS1 transcription in OC3-IV2 cells. One key enzyme responsible for methylating H3K27 is EZH2 (enhancer of zeste homolog 2), the main enzymatic subunit of the polycomb repressive complex 2.30 Interestingly, EZH2 level was reduced in OC3-IV2 cells (Figure 5d, left panel), and occupancy by EZH2 within the 5’ region of ROS1 was decreased compared to that in OC3 cells (Figure 5d, right panel), consistent with the observed reduction in H3K27me3 (Figure 5c, left panel). Depleting EZH2 also increased the ROS1 level as well as OC3 cell invasiveness (Figure 5e). These results indicate that reduced EZH2 level in the more invasive OC3-IV2 cells decreased H3K27me3 at the ROS1 promoter, thereby upregulating ROS1 transcription. Similarly, the EZH2 level in C9-IV2 cells was also reduced compared with C9 cells (Figure 5f, left panel). Moreover, the lower EZH2 level in C9, OECM1, and C8 cells (relative to OC3 cells) correlated well with the increased invasiveness of these cells (Figure 5f). To understand what led to reduced EZH2, we compared miRNA (miR) expression between OC3 and OC3-IV2 cells using miR arrays. Of the 326 miRs in the array, 119 were upregulated by >1.5-fold in OC3-IV2 cells compared to OC3 cells. Using the miRanda algorithm, 29 candidate miRs were identified based on the binding energy between each miR and EZH2 (ΔG⩽–15; Supplementary Figure 4a, left panel). Additional filtering with the miR target prediction software packages miRWalk and DIANA-microT identified miR-200a-3p and miR-138-5p as the best candidates for targeting EZH2 (Supplementary Figure 4a, right panel). We compared their expressions in OC3, OC3-IV2, OECM1, and C9 cells. Higher expression of miR-200a-3p correlated well with greater invasiveness and reduced EZH2 expression (Figure 5g). Expression of miR-138-5p, on the other hand, was downregulated in OECM1 and C9 cells but upregulated in OC3-IV2 cells (Supplementary Figure 4b).
Figure 5.
H3K27me3 modification and EZH2 occupancy at the ROS1 promoter. (a) Bisulfite sequencing was performed to assess the methylation status of CpG islands in the ROS1 promoter. PCR products were cloned into TA-vector plasmids, and individual clones were sequenced. (b) Schematic diagram shows four primer pairs for ChIP assays within the ROS1 promoter. +1: transcription start site (TSS). (c) ChIP assays for OC3 and OC3-IV2 cells using anti-H3K27me3 or anti-H3K4me3 for IP, followed by Q-PCR with specific primers flanking the ROS1 promoter. (d) Left: Relative levels of EZH2 protein in OC3 and OC3-IV2 cells were quantified by Western blotting. Right: ChIP assays using anti-EZH2 for IP, followed by Q-PCR with specific primers for the ROS1 promoter as b indicated. (e) Left: Relative EZH2 mRNA expression in OC3-Scr and OC3-shEZH2 cells was measured using Q-PCR. Middle: Q-PCR for relative ROS1 mRNA expression in OC3-Scr and OC3-shEZH2 cells. Right: Invasion of OC3-Scr and OC3-shEZH2 cells was quantified with the Boyden chamber assay. (f) Left: Western blotting for EZH2 in OSCC cells normalized to the level in OC3 cells. P: parental cells. Right: Representative images of OSCC cell invasion (Boyden chamber assay). (g) Top: Complementary sequence between miR-200a-3p and coding sequence of EZH2 mRNA. Bottom: Relative miR-200a-3p and EZH2 protein levels in OSCC cells were determined using Q-PCR and Western blotting, respectively. Data from at least three independent experiments are presented as mean±SEM (*, #P<0.05).
ROS1-associated oncogenic signaling and novel target genes
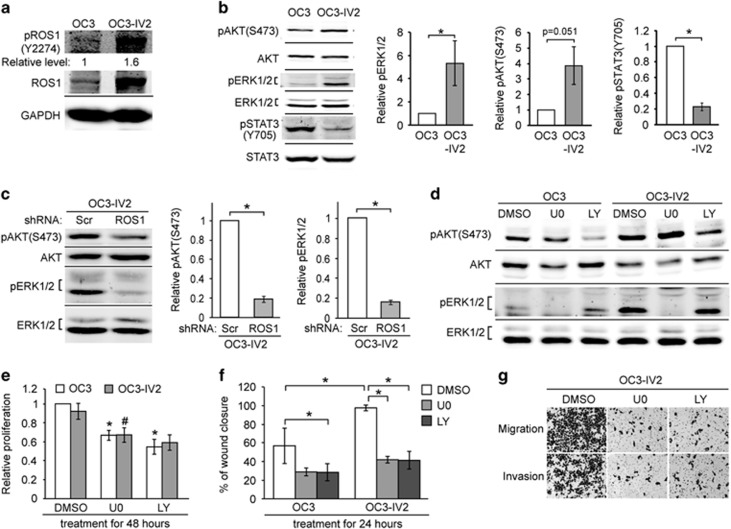
Concurrent with the increased ROS1 in highly invasive OSCC cells, phosphorylation of ROS1 at tyrosine 2274 was also increased, suggestive of elevated activity (Figure 6a). ROS1 was previously shown to activate the MAPK kinase (MEK)-extracellular signal-regulated kinase (ERK1/2) and phosphatidylinositol 3-kinase (PI3K)-AKT signaling pathways.31, 32, 33, 34 As expected, phosphorylation of ERK1/2 and AKT was increased in OC3-IV2 cells compared to the parental OC3 cells (Figure 6b). In contrast, phosphorylated STAT3 transcription factor [pSTAT3(Y705)] was reduced in OC3-IV2 cells (Figure 6b). The reduction of pSTAT3(Y705) may be a result of reduced EGFR level in the more invasive OSCC cells. Clinical data obtained from OSCC and salivary gland cancer samples also showed reduced pSTAT3(Y705).11, 35 Knockdown of ROS1 reduced pERK1/2 and pAKT (Figure 6c). Specific inhibition of either MEK-ERK1/2 or PI3K-AKT signaling by U0126 or LY294002 inhibitor (Figure 6d) reduced the proliferation, migration, and invasion of OC3 and OC3-IV2 cells (Figures 6e and g).
Figure 6.
Effect of increased ROS1 on MAPK, PI3K-AKT signaling pathways, cell proliferation, migration, and invasion. (a) Western blotting was carried out with lysates of OC3 and OC3-IV2 cells using anti-ROS1 and anti-pROS1(Y2274). The value for pROS1(Y2274) was normalized to total ROS1. (b and c) Relative protein levels of pAKT(S473), AKT, pERK1/2, ERK1/2, pSTAT3(Y705), and STAT3 in OC3, OC3-IV2, OC3-IV2-Scr, and OC3-IV2-shROS1#1 cells as determined with Western blotting. Levels of pERK1/2, pAKT(S473), and pSTAT3(Y705) were normalized to those of total ERK1/2, AKT, and STAT3, respectively, and then to OC3 and OC3-IV2-Scr cells. (d) pAKT(S473), AKT, pERK1/2, and ERK1/2 levels in lysates from OC3 and OC3-IV2 cells treated with 20 μM U0126 or LY294002 for 24 h. (e and f) Relative proliferation and migration of OC3 and OC3-IV2 cells treated with 20 μM U0126 or LY294002 for 24 or 48 h were assessed using MTT and wound-healing assays, respectively. *, #Compared with DMSO treatment. (g) Migration and invasion of OC3-IV2 cells treated with 20 μM U0126 or LY294002 for 26 h were assessed with the Boyden chamber assay. Data from at least three independent experiments are presented as mean±SEM (*, #P<0.05).
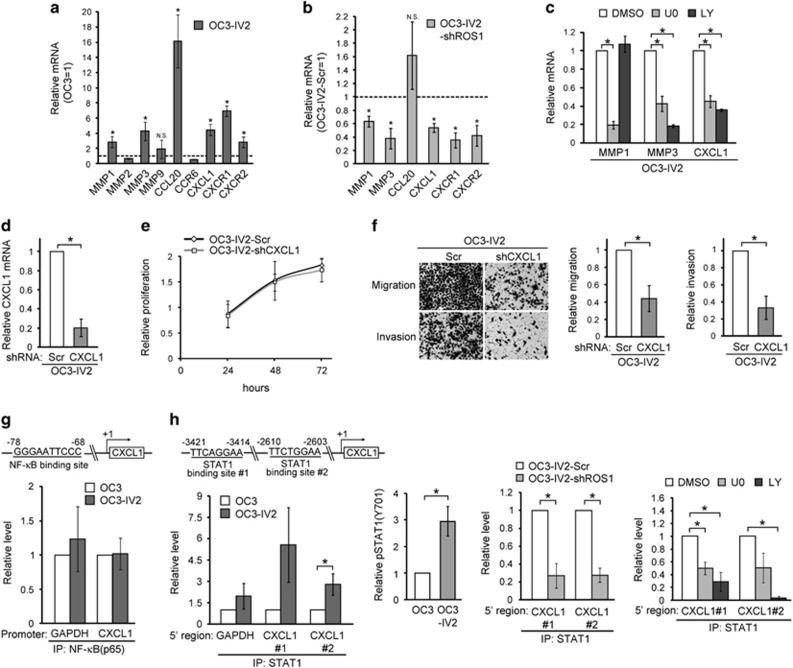
We next performed microarray analysis and identified candidate metalloproteinases MMPs and cytokines/chemokines that were differentially expressed and likely involved in OSCC invasion. Q-PCR analysis quantified the expression of several MMP genes as well as CCL20, CCR6, CXCL1, and the receptors for CXCL1 (CXCR1/2). Of those, MMP1, MMP3, CXCL1, and CXCR1/2 were upregulated in OC3-IV2 cells, and their expressions were downregulated upon ROS1 knockdown via shROS1 (Figures 7a and b). In contrast, CCL20 level was not affected by shROS1. Furthermore, the expression of MMP1, MMP3, and CXCL1s was reduced upon inhibition of the PI3K-AKT and/or MEK-ERK1/2 pathways (Figure 7c). Activation of chemokine signaling is known to increase MMPs and thus cell invasion,36 therefore it is likely that CXCL1 plays a key role in promoting OSCC cell migration and invasion. To this end, an OC3-IV2 cell line stably expressing CXCL1 shRNA (OC3-IV2-shCXCL1) was established (Figure 7d); CXCL1 knockdown indeed reduced the migration and invasion but not proliferation of OC3-IV2 cells (Figures 7e and f). These findings clearly demonstrate that ROS1 activates the MEK-ERK1/2 and PI3K-AKT signaling pathways and increases the expression of MMP1, MMP3, CXCL1, and CXCR1/2. Hence, the observed increase in migration and invasion capacities of OC3-IV2 cells is dependent on an increased level of CXCL1 in tumors.
Figure 7.
Identification of ROS1 target genes and their effect on migration and invasion of OSCC cells. (a) The mRNA levels for the indicated genes in OC3-IV2 cells were measured by Q-PCR and normalized to those in OC3 cells. (b) The mRNA levels for MMP1, MMP3, CCL20, CXCL1, and CXCR1/2 in OC3-IV2-shROS1#1 cells were normalized to those in OC3-IV2-Scr. (c) The mRNA levels of MMP1, MMP3, CCL20, and CXCL1 in OC3-IV2 cells treated with 20 μM U0126 or LY294002 for 24 h were normalized to those in DMSO-treated samples. (d) Q-PCR for relative CXCL1 mRNA level in OC3-IV2-Scr and OC3-IV2-shCXCL1 cells. (e and f) Proliferation, migration, and invasion in OC3-IV2-Scr and OC3-IV2-shCXCL1 cells were measured using MTT and Boyden chamber assays, respectively. (g and h) Schematic diagram showing the predicted binding sites for NF-κB or STAT1 within the 5’ region of CXCL1. ChIP assays were performed using anti-NF-κB(p65) or anti-STAT1 for IP, followed by Q-PCR. The relative levels of pSTAT1 in OC3 and OC3-IV2 cells were quantified by Western blotting. STAT1 ChIP assays were performed using lysates from OC3-IV2-Scr, OC3-IV2-shROS1, and OC3-IV2 cells treated with 20 μM U0126 or LY294002 for 24 h. Data from at least three independent experiments are presented as mean±SEM (*P<0.05).
STAT1-mediated regulation of CXCL1
CXCL1 is a target gene of the transcription factors NF-κB and STAT1.37 Thus, we performed ChIP assays to determine the occupancy of the CXCL1 regulatory region by NF-κB (–78/–68 in CXCL1) and STAT1 (–2610/–2603 and –3421/–3414). Occupancy by NF-κB at the promoter region of ROS1 did not differ between OC3 and OC3-IV2 cells, whereas occupancy by STAT1 was increased in OC3-IV2 cells (Figures 7g and h). This increased occupancy by STAT1 at the enhancer region of CXCL1 probably resulted from an increase in pSTAT1 in OC3-IV2 cells (Figure 7h, middle left panel). In line with our finding that CXCL1 was a newly identified target of ROS1, ROS1 knockdown reduced STAT1 occupancy within the CXCL1 enhancer (Figure 7h, middle right panel). Consistent with these data, the occupancy by STAT1 was dependent on ROS1-mediated activation of the MEK-ERK1/2 and PI3K-AKT pathways based on inhibitor assays (Figure 7h, right panel).
Effect of ROS1-induced Gli1 expression in cell proliferation and migration/invasion
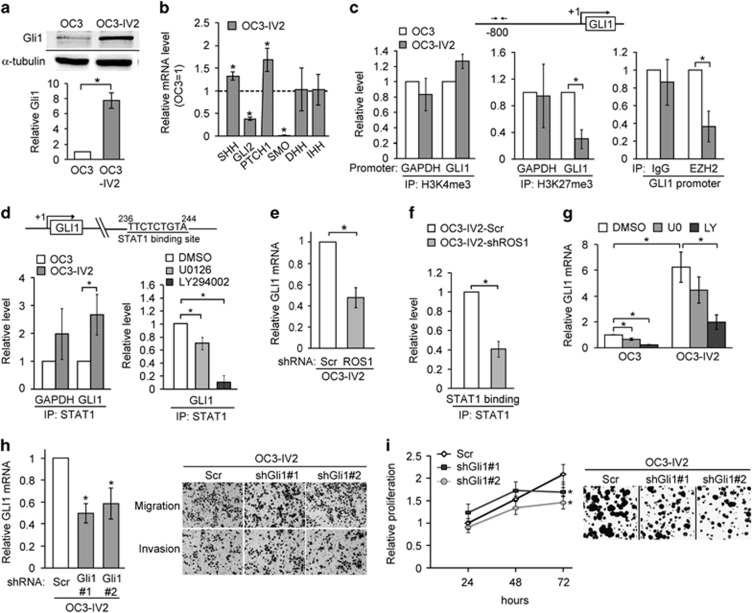
Our results so far imply a substantive contribution of ROS1 to OSCC cell migration and invasion. Nonetheless, depleting ROS1 also reduced OSCC cell proliferation and colonization (Figures 3b–f), suggesting that ROS1 helps to maintain cell proliferation. Clinical studies have shown that increased nuclear Gli1 correlates with larger primary tumors, lymphatic metastasis, tumor recurrence, and poor prognosis for OSCC patients.38, 39 Although Gli1 is best known as the principal transcription factor for the canonical Sonic hedgehog (Shh) pathway, it can also be regulated through the non-canonical MEK-ERK1/2 and PI3K-AKT pathways.40, 41 We tested the possibility that Gli1 acts downstream of ROS1. As shown in Figure 8a, Gli1 protein level indeed was increased in the more invasive OSCC cells. Among other factors acting in the Shh signaling pathway, the expression of SHH and PTCH1 was increased in OC3-IV2 cells compared with OC3 cells, whereas expression of DHH and IHH did not differ between these cell lines. In contrast, GLI2 and SMO expressions were reduced in OC3-IV2 cells (Figure 8b). Similar to our observed epigenetic regulation of ROS1, ChIP assays revealed that H3K27me3 modification and occupancy by EZH2 at the GLI1 promoter were decreased in the highly invasive OSCC cells (Figure 8c). STAT1 occupancy of intron 1 of GLI1 was increased, and this increase was inhibited by an inhibitor of the PI3K-AKT pathway (Figure 8d). ROS1 knockdown reduced GLI1 expression (Figure 8e) and STAT1 occupancy of GLI1 intron 1 (Figure 8f), indicating that GLI1 is a novel target gene of ROS1. Consistent with ROS1 acting upstream of Gli1, inhibiting PI3K-AKT significantly reduced Gli1 level (Figure 8g). Interestingly, neither cell migration nor invasion was affected by Gli1 knockdown (shGli1#1 and #2; Figure 8h); rather, cell proliferation and colony formation were reduced (Figure 8i). These findings support a positive role for Gli1 in maintaining cell proliferation of OC3-IV2 cells and also explain why inhibiting ROS1 reduces cell proliferation. GLI1 expression is regulated by the ROS1-PI3K-AKT pathway, occupancy of GLI1 intron 1 by STAT1, occupancy of the GLI1 promoter by EZH2, and histone H3K27me3 modification at the GLI1 promoter.
Figure 8.
ROS1-regulated Gli1 level is required for cell proliferation. (a) Western blotting for quantification/comparison of Gli1 level in OC3 and OC3-IV2 cells. (b) The mRNA levels for the indicated genes in OC3-IV2 cells were measured by Q-PCR and normalized to those in OC3 cells. (c) ChIP assays were performed to compare modifications of H3K4me3 and H3K27me3 or EZH2 occupancy of the GLI1 promoter in OC3 and OC3-IV2 cells. (d) Comparison of ChIP assay results for STAT1 occupancy of the GLI1 gene region for OC3 cells, OC3-IV2 cells, and OC3-IV2 cells treated with 20 μM U0126 or LY294002 for 24 h. (e) Q-PCR analysis showing relative GLI1 mRNA expression between OC3-IV2-Scr and OC3-IV2-shROS1#1 cells. (f) STAT1 ChIP assays at the GLI1 gene region were performed using lysates from OC3-IV2-Scr and OC3-IV2-shROS1#1. (g) Relative mRNA level of GLI1 was compared among OC3 and OC3-IV2 cells treated with 20 μM U0126 or LY294002 for 24 h by Q-PCR. (h) Left: Relative mRNA expression from GLI1 between OC3-IV2-Scr, OC3-IV2-shGli1#1, and #2 cells. *Compared with the relative mRNA expression in OC3-IV2-Scr cells. Right: The Boyden chamber assay was used to assess migration and invasion of OC3-IV2-Scr, OC3-IV2-shGli1#1, and #2 cells. (i) Proliferation of OC3-IV2-Scr, OC3-IV2-shGli1#1, and #2 cells was assessed by MTT and colony formation assays. *Compared with OC3-IV2-Scr cells at the indicated time point. Data from at least three independent experiments are presented as mean±SEM (*P<0.05).
Discussion
Quantitative phosphotyrosine profiling of Rat-1 fibroblast cells expressing different ROS1 fusion proteins has led to the identification of diverse tyrosine phosphorylation and signaling pathways.42 Therefore, it is likely that different ROS1 fusions in various cancer types adopt distinct mechanisms to promote tumorigenesis. To add to the heterogeneity of cancers, this study revealed another form of ROS1 activation without fusion that is required for clonal growth and metastasis of OSCC cells. Mechanistic investigation revealed that loss of EZH2-mediated epigenetic suppression opened up a subset of promoter/intron/candidate enhancer regions to facilitate STAT1 accessibility and thus enhanced expressions of ROS1 and its target genes. Nonetheless, we cannot rule out other possibilities, such as reduced levels of miRNAs that target ROS1 transcripts or increased expression of a H3K27 demethylase. Both gain- and loss-of-function mutations of EZH2 have been linked to tumorigenesis.43, 44, 45 As studies have suggested that EZH2 functions to promote cellular stemness or differentiation, evidence so far nevertheless points to its cell type–specific role in fate determination.30 In a number of OSCC cell lines, knockdown of EZH2 increased invasiveness (Supplementary Figure 5a and b). Because EZH2 is a histone methyltransferase, a reduction in cellular EZH2 level could affect several different genes. It is possible that shEZH2 may have affected lineage specificity and/or altered cell morphology, thereby enhancing the expression of stemness genes. Interestingly, the most invasive OSCC-shEZH2 cells were those that had combined elevated expressions of ROS1, GLI1, and CXCL1 (Supplementary Figure 5c and d). These findings differ from those reporting an oncogenic role for EZH2 in prostate cancer in that elevated EZH2 level (silences tumor suppressor genes) correlates with metastasis (Supplementary Figure 6a). Consistent with our results, the level of EZH2 in metastatic lymph nodes of OSCC patients was found to be lower than in primary tumors (Supplementary Figure 6b).46
Although Gli1 is best known as a transcription factor involved in the Shh pathway, treatment of OC3 and OC3-IV2 cells with Shh ligand had no effect on their proliferation, migration, or Gli1 level (Supplementary Figure 7). These results indicate that the observed increased level of Gli1 is not a consequence of activating the canonical Shh pathway. OC3 cells were originally derived from a patient having betel nut–chewing habit but no history of smoking or excessive alcohol consumption. This finding is in line with a previous report suggesting that Shh level is not increased in OSCC caused by betel nut chewing.38
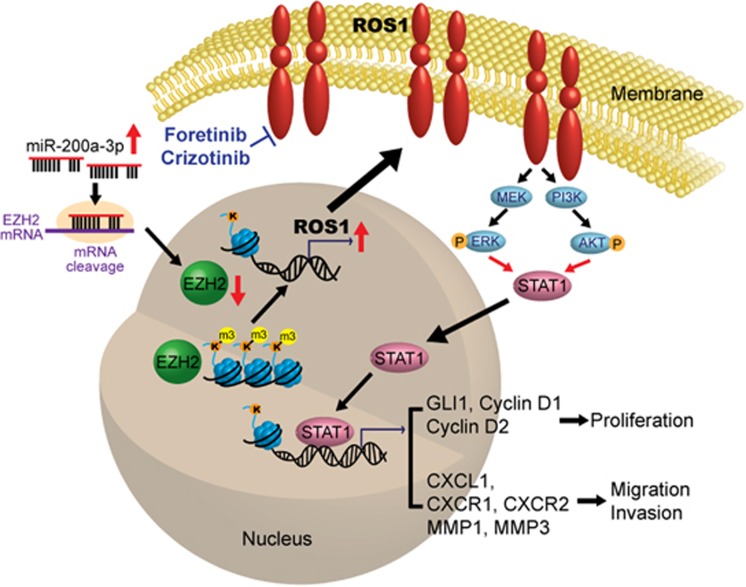
The current study establishes a strong correlation between elevated expression of the ROS1 oncogene and OSCC metastasis among 188 OSCC patients and a number of OSCC cell lines. The EZH2-mediated change in the epigenome of OSCC cells induces upregulation of ROS1 and its target genes, conferring greater invasiveness and plasticity to cope with the tumor microenvironment. Low EZH2 and enhanced invasiveness are likely attributed to high level of miR-200a-3p. Among the newly identified ROS1 targets, CXCL1, its receptors CXCR1 and CXCR2, MMP1 and MMP3 contribute to cellular invasiveness whereas Gli1, Cyclin D1 and D2 are required for cell proliferation. To circumvent the lack of efficacy of targeting EGFR, co-targeting EGFR and ROS1 provides a novel therapy of treating oral cancer (Figure 9). This study may also provide an improved OSCC treatment regimen by combining ROS1 inhibitor with other therapeutics for those with elevated ROS1.
Figure 9.
Schematic model of how ROS1 promotes oral cancer progression. Higher level of miR-200a-3p correlates with low EZH2 and enhanced OSCC invasion. The reduction of EZH2 level in the highly invasive OSCC cells relieves H3K27m3 modification and opens chromatin for transcriptional activation of ROS1 as well as a number of novel ROS1 target genes. Elevated ROS1 activates the MEK-ERK1/2 and PI3K-AKT pathways to increase STAT1 occupancy at the regulatory regions of GLI1 and CXCL1 to promote cell proliferation and invasion.
Materials and methods
Detailed information and procedures for cell proliferation assays, in vitro migration and invasion assays, knockdown of selective genes via RNAi using lentivirus infection, Reverse Transcription-PCR and Q-RCR, Western blotting, FISH, bisulfite sequencing, and ChIP are described in Supplementary Information.
Cell lines
Human oral cancer cell lines OC3,47 CGHNC9 (C9),48 CGHNC8 (C8),48 OECM1,49 SAS,50 and HSC351 were used. OC3, C9 and C8 cells were derived from OSCC of patients. OECM1 was derived from gingival epidermoid carcinoma. SAS was derived from tongue squamous cell carcinoma. HSC3 was established from tumors of metastatic lymph nodes that originated in tongue squamous cell carcinoma. The selected highly invasive cell lines OC3-IV2, OC3-I5, C9-IV2, C9-I7, and SAS-I5 have been described previously.20 OC3, OC3-IV2, and OC3-I5 cells were grown in a 1:1 ratio of DMEM (Invitrogen, Carlsbad, CA, USA) and keratinocyte serum-free medium (KSFM; Invitrogen), supplemented with 10% (v/v) FBS (Invitrogen). C9, C9-IV2, C9-I7, C8, SAS, SAS-I5, and HSC3 cells were grown in DMEM with 10% (v/v) FBS. OECM1 was grown in RPMI-1640 (Invitrogen) with 10% (v/v) FBS. Normal keratinocytes from tissue biopsies of normal oral mucosa CGHNK2 (K2) and CGK6 (K6) were grown in KSFM supplemented with bovine pituitary extract (Invitrogen), epidermal growth factor (Invitrogen), and G418 (Sigma-Aldrich, St Louis, MO, USA).
Antibodies and reagents
Antibodies against ROS1 (#ab108492) and H3K4me3 (#ab8580) were purchased from Abcam (Cambridge, MA, USA). Antibodies against pROS1(Y2274) (#3078), pERK1/2 (#9106), pAKT(S473) (#4051), AKT (#9272), STAT3 (#9139), EZH2 (#5246), and Gli1 (#2534) were purchased from Cell Signaling Technology (Danvers, MA, USA). Antibody against pSTAT3(Y705) (#BS4181) was purchased from Bioworld Technology (Louis Park, MN, USA). Antibody against H3K27me3 (#07-449) was purchased from Merck Millipore. Antibodies against ERK1/2 (#M5670) and GAPDH (#G8795) were purchased from Sigma-Aldrich. Antibodies against STAT1 (#sc-346) and pSTAT1 (#sc-8394) were purchased from Santa Cruz Biotechnology (Santa Cruz, CA, USA). Alexa Flour 700–conjugated goat anti-mouse IgG secondary antibody (#A21036) was purchased from Invitrogen. IRDye800CW-labeled anti-rabbit secondary antibody (#926-32211) was purchased from LI-COR Biosciences (Lincoln, NE, USA). LY294002 and U0126 were purchased from Calbiochem (San Diego, CA, USA). Foretinib and gefitinib were purchased from ApexBio Technology (Houston, TX, USA). Crizotinib was purchased from Selleckchem (Huston, TX, USA).
IHC analysis and gene expression of patient tissue samples
Two types of human tissue were used for IHC studies. Human oral cancer tissue array slides containing samples for 101 patients were obtained from Taipei Veterans General Hospital, Taipei, Taiwan. This study is approved by Institutional Review Board of Taipei Veterans General Hospital. Commercial tissue array slides containing samples for 64 patients (OR208) was purchased from US Biomax. IHC staining was performed using anti-ROS1 (1:100; ab5512; Abcam) with an automated slide staining system DISCOVERY XT from Ventana Medical Systems, Inc (Roche, Basel, Switzerland). IHC data for ROS1 staining was graded into strong, moderate, and weak categories based on staining intensity. Strong intensity was interpreted as high ROS1 expression, whereas moderate or weak intensity was interpreted as low ROS1 expression. Twenty-three human oral cancer tissue sections containing paired normal and tumor tissue were obtained from the Department of Public Health and Environmental Medicine, Kaohsiung Medical University, Taiwan. ROS1 expression in these tissues was determined via Q-PCR.
Orthotopic and tail-vein injection of OSCC cells into mice
For oral orthotopic and tail-vein xenograft experiments, 1 × 10⁶ OC3-IV2-Scr or OC3-IV2-shROS1 cells were harvested and re-suspended in 100 ml PBS. Ten (oral orthotopic) or twelve (tail-vein xenograft) were randomized into two group for cell injection. The cells were injected through the oral buccal mucosa or tail vein of 6-week-old male CB17/lcr-Prkdcscid/Crl mice (BioLasco, Taiwan). Investigators were not blinded to each group. For the oral orthotopic xenograft model, oral tumors were measured by vernier caliper 2.5 months after injection, and tumor volume was calculated as: V=(L × W2)/2, where L is length; W is width. For the tail-vein xenograft model, all mice were sacrificed 2.5 months after injection; lungs were harvested, fixed with formalin, sectioned, and subjected to H&E staining. Total areas of metastatic nodules per field were counted using Image J. All procedures were performed according to approved Institutional Animal Care and Use Committee protocols.
miRNA array analysis
The miRNA expression levels between OC3 and OC3-IV2 cells were analyzed using Affymetrix miRNA 2.0 array (Affymetrix, Santa Clara, CA, USA). The experiment was performed at Microarray Core Laboratory, National Health Research Institute, Taiwan.
Statistical analysis
Statistical analysis of all results was carried out using the paired Student’s t-test. All values reflect the mean±S.E.M. of data obtained from at least three independent experiments. Statistical significance was defined as P<0.05.
Acknowledgments
This study was supported by grants from Ministry of Science and Technology, Taiwan (NSC 105-2320-B-007-002-MY3) and National Tsing Hua University, Taiwan (104N2739E1 and 105N722CV7) and postdoctoral fellowships from Ministry of Science and Technology, Taiwan (NSC 106-2811-B-007-001 to YJC) and National Tsing Hua University, Taiwan (105N183DE1 to YJC). We thank Professor Rong-Long Pan for commenting on our manuscript.
Author contributions
LC and LHW designed the studies, wrote the manuscript, and obtained funding. CHS and YJC conducted experiments, acquired data, analyzed data, and wrote the manuscript. WCH, THJ, MCL, HC, SWC, and SFH conducted experiments and acquired data. MHY and TYS provided clinical samples. HJK and WCW provided reagents and edited the manuscript. YJC provided reagents.
Footnotes
Supplementary Information accompanies this paper on the Oncogene website (http://www.nature.com/onc)
The authors declare no conflict of interest.
Supplementary Material
References
- Torre LA, Bray F, Siegel RL, Ferlay J, Lortet-Tieulent J, Jemal A. Global cancer statistics, 2012. CA Cancer J Clin 2015; 65: 87–108. [DOI] [PubMed] [Google Scholar]
- Warnakulasuriya S. Living with oral cancer: epidemiology with particular reference to prevalence and life-style changes that influence survival. Oral Oncol 2010; 46: 407–410. [DOI] [PubMed] [Google Scholar]
- Dionne KR, Warnakulasuriya S, Zain RB, Cheong SC. Potentially malignant disorders of the oral cavity: current practice and future directions in the clinic and laboratory. Int J Cancer 2015; 136: 503–515. [DOI] [PubMed] [Google Scholar]
- Ernani V, Saba NF. Oral Cavity Cancer: Risk Factors, Pathology, and Management. Oncology 2015; 89: 187–195. [DOI] [PubMed] [Google Scholar]
- Johnson NW, Warnakulasuriya S, Gupta PC, Dimba E, Chindia M, Otoh EC et al. Global oral health inequalities in incidence and outcomes for oral cancer: causes and solutions. Adv Dent Res 2011; 23: 237–246. [DOI] [PubMed] [Google Scholar]
- Markopoulos AK. Current aspects on oral squamous cell carcinoma. Open Dent J 2012; 6: 126–130. [DOI] [PMC free article] [PubMed] [Google Scholar]
- Ryott M, Wangsa D, Heselmeyer-Haddad K, Lindholm J, Elmberger G, Auer G et al. EGFR protein overexpression and gene copy number increases in oral tongue squamous cell carcinoma. Eur J Cancer 2009; 45: 1700–1708. [DOI] [PMC free article] [PubMed] [Google Scholar]
- Moon C, Chae YK, Lee J. Targeting epidermal growth factor receptor in head and neck cancer: lessons learned from cetuximab. Exp Biol Med (Maywood) 2010; 235: 907–920. [DOI] [PubMed] [Google Scholar]
- Kimura I, Kitahara H, Ooi K, Kato K, Noguchi N, Yoshizawa K et al. Loss of epidermal growth factor receptor expression in oral squamous cell carcinoma is associated with invasiveness and epithelial-mesenchymal transition. Oncol Lett 2016; 11: 201–207. [DOI] [PMC free article] [PubMed] [Google Scholar]
- Vermorken JB, Trigo J, Hitt R, Koralewski P, Diaz-Rubio E, Rolland F et al. Open-label, uncontrolled, multicenter phase II study to evaluate the efficacy and toxicity of cetuximab as a single agent in patients with recurrent and/or metastatic squamous cell carcinoma of the head and neck who failed to respond to platinum-based therapy. J Clin Oncol 2007; 25: 2171–2177. [DOI] [PubMed] [Google Scholar]
- Tsien CI, Nyati MK, Ahsan A, Ramanand SG, Chepeha DB, Worden FP et al. Effect of erlotinib on epidermal growth factor receptor and downstream signaling in oral cavity squamous cell carcinoma. Head Neck 2013; 35: 1323–1330. [DOI] [PMC free article] [PubMed] [Google Scholar]
- Wang LH, Hanafusa H, Notter MF, Balduzzi PC. Genetic structure and transforming sequence of avian sarcoma virus UR2. J Virol 1982; 41: 833–841. [DOI] [PMC free article] [PubMed] [Google Scholar]
- Shibuya M, Hanafusa H, Balduzzi PC. Cellular sequences related to three new onc genes of avian sarcoma virus (fps, yes, and ros) and their expression in normal and transformed cells. J Virol 1982; 42: 143–152. [DOI] [PMC free article] [PubMed] [Google Scholar]
- Feldman RA, Wang LH, Hanafusa H, Balduzzi PC. Avian sarcoma virus UR2 encodes a transforming protein which is associated with a unique protein kinase activity. J Virol 1982; 42: 228–236. [DOI] [PMC free article] [PubMed] [Google Scholar]
- Birchmeier C, Birnbaum D, Waitches G, Fasano O, Wigler M. Characterization of an activated human ros gene. Mol Cell Biol 1986; 6: 3109–3116. [DOI] [PMC free article] [PubMed] [Google Scholar]
- Matsushime H, Wang LH, Shibuya M. Human c-ros-1 gene homologous to the v-ros sequence of UR2 sarcoma virus encodes for a transmembrane receptorlike molecule. Mol Cell Biol 1986; 6: 3000–3004. [DOI] [PMC free article] [PubMed] [Google Scholar]
- Birchmeier C, O'Neill K, Riggs M, Wigler M. Characterization of ROS1 cDNA from a human glioblastoma cell line. Proc Natl Acad Sci USA 1990; 87: 4799–4803. [DOI] [PMC free article] [PubMed] [Google Scholar]
- Davies KD, Doebele RC. Molecular pathways: ROS1 fusion proteins in cancer. Clin Cancer Res 2013; 19: 4040–4045. [DOI] [PMC free article] [PubMed] [Google Scholar]
- Timp W, Feinberg AP. Cancer as a dysregulated epigenome allowing cellular growth advantage at the expense of the host. Nat Rev Cancer 2013; 13: 497–510. [DOI] [PMC free article] [PubMed] [Google Scholar]
- Huang WC, Chan SH, Jang TH, Chang JW, Ko YC, Yen TC et al. miRNA-491-5p and GIT1 serve as modulators and biomarkers for oral squamous cell carcinoma invasion and metastasis. Cancer Res 2014; 74: 751–764. [DOI] [PubMed] [Google Scholar]
- Shaib W, Kono S, Saba N. Antiepidermal growth factor receptor therapy in squamous cell carcinoma of the head and neck. J Oncol 2012; 2012: 521215. [DOI] [PMC free article] [PubMed] [Google Scholar]
- Blume-Jensen P, Hunter T. Oncogenic kinase signalling. Nature 2001; 411: 355–365. [DOI] [PubMed] [Google Scholar]
- Lemmon MA, Schlessinger J. Cell signaling by receptor tyrosine kinases. Cell 2010; 141: 1117–1134. [DOI] [PMC free article] [PubMed] [Google Scholar]
- Davare MA, Saborowski A, Eide CA, Tognon C, Smith RL, Elferich J et al. Foretinib is a potent inhibitor of oncogenic ROS1 fusion proteins. Proc Natl Acad Sci U S A 2013; 110: 19519–19524. [DOI] [PMC free article] [PubMed] [Google Scholar]
- Jun HJ, Woolfenden S, Coven S, Lane K, Bronson R, Housman D et al. Epigenetic regulation of c-ROS receptor tyrosine kinase expression in malignant gliomas. Cancer Res 2009; 69: 2180–2184. [DOI] [PubMed] [Google Scholar]
- Black JC, Van Rechem C, Whetstine JR. Histone lysine methylation dynamics: establishment, regulation, and biological impact. Mol Cell 2012; 48: 491–507. [DOI] [PMC free article] [PubMed] [Google Scholar]
- Chi P, Allis CD, Wang GG. Covalent histone modifications—miswritten, misinterpreted and mis-erased in human cancers. Nat Rev Cancer 2010; 10: 457–469. [DOI] [PMC free article] [PubMed] [Google Scholar]
- Rodriguez-Paredes M, Esteller M. Cancer epigenetics reaches mainstream oncology. Nat Med 2011; 17: 330–339. [DOI] [PubMed] [Google Scholar]
- Dawson MA, Kouzarides T. Cancer epigenetics: from mechanism to therapy. Cell 2012; 150: 12–27. [DOI] [PubMed] [Google Scholar]
- Kim KH, Roberts CW. Targeting EZH2 in cancer. Nat Med 2016; 22: 128–134. [DOI] [PMC free article] [PubMed] [Google Scholar]
- Xiong Q, Chan JL, Zong CS, Wang LH. Two chimeric receptors of epidermal growth factor receptor and c-Ros that differ in their transmembrane domains have opposite effects on cell growth. Mol Cell Biol 1996; 16: 1509–1518. [DOI] [PMC free article] [PubMed] [Google Scholar]
- Zong CS, Chan JL, Yang SK, Wang LH. Mutations of Ros differentially effecting signal transduction pathways leading to cell growth versus transformation. J Biol Chem 1997; 272: 1500–1506. [DOI] [PubMed] [Google Scholar]
- Nguyen KT, Zong CS, Uttamsingh S, Sachdev P, Bhanot M, Le MT et al. The role of phosphatidylinositol 3-kinase, rho family GTPases, and STAT3 in Ros-induced cell transformation. J Biol Chem 2002; 277: 11107–11115. [DOI] [PubMed] [Google Scholar]
- Uttamsingh S, Zong CS, Wang LH. Matrix-independent activation of phosphatidylinositol 3-kinase, Stat3, and cyclin A-associated Cdk2 Is essential for anchorage-independent growth of v-Ros-transformed chicken embryo fibroblasts. J Biol Chem 2003; 278: 18798–18810. [DOI] [PubMed] [Google Scholar]
- Ettl T, Stiegler C, Zeitler K, Agaimy A, Zenk J, Reichert TE et al. EGFR, HER2, survivin, and loss of pSTAT3 characterize high-grade malignancy in salivary gland cancer with impact on prognosis. Hum Pathol 2012; 43: 921–931. [DOI] [PubMed] [Google Scholar]
- Kawanishi H, Matsui Y, Ito M, Watanabe J, Takahashi T, Nishizawa K et al. Secreted CXCL1 is a potential mediator and marker of the tumor invasion of bladder cancer. Clin Cancer Res 2008; 14: 2579–2587. [DOI] [PubMed] [Google Scholar]
- Burke SJ, Lu D, Sparer TE, Masi T, Goff MR, Karlstad MD et al. NF-kappaB and STAT1 control CXCL1 and CXCL2 gene transcription. Am J Physiol Endocrinol Metab 2014; 306: E131–E149. [DOI] [PMC free article] [PubMed] [Google Scholar]
- Wang YF, Chang CJ, Lin CP, Chang SY, Chu PY, Tai SK et al. Expression of hedgehog signaling molecules as a prognostic indicator of oral squamous cell carcinoma. Head Neck 2012; 34: 1556–1561. [DOI] [PubMed] [Google Scholar]
- Fan HX, Wang S, Zhao H, Liu N, Chen D, Sun M et al. Sonic hedgehog signaling may promote invasion and metastasis of oral squamous cell carcinoma by activating MMP-9 and E-cadherin expression. Med Oncol 2014; 31: 41. [DOI] [PubMed] [Google Scholar]
- Mimeault M, Batra SK. Frequent deregulations in the hedgehog signaling network and cross-talks with the epidermal growth factor receptor pathway involved in cancer progression and targeted therapies. Pharmacol Rev 2010; 62: 497–524. [DOI] [PMC free article] [PubMed] [Google Scholar]
- Filbin MG, Dabral SK, Pazyra-Murphy MF, Ramkissoon S, Kung AL, Pak E et al. Coordinate activation of Shh and PI3K signaling in PTEN-deficient glioblastoma: new therapeutic opportunities. Nat Med 2013; 19: 1518–1523. [DOI] [PMC free article] [PubMed] [Google Scholar]
- Jun HJ, Johnson H, Bronson RT, de Feraudy S, White F, Charest A. The oncogenic lung cancer fusion kinase CD74-ROS activates a novel invasiveness pathway through E-Syt1 phosphorylation. Cancer Res 2012; 72: 3764–3774. [DOI] [PMC free article] [PubMed] [Google Scholar]
- Zingg D, Debbache J, Schaefer SM, Tuncer E, Frommel SC, Cheng P et al. The epigenetic modifier EZH2 controls melanoma growth and metastasis through silencing of distinct tumour suppressors. Nat Commun 2015; 6: 6051. [DOI] [PubMed] [Google Scholar]
- Ernst T, Chase AJ, Score J, Hidalgo-Curtis CE, Bryant C, Jones AV et al. Inactivating mutations of the histone methyltransferase gene EZH2 in myeloid disorders. Nat Genet 2010; 42: 722–726. [DOI] [PubMed] [Google Scholar]
- Sashida G, Harada H, Matsui H, Oshima M, Yui M, Harada Y et al. Ezh2 loss promotes development of myelodysplastic syndrome but attenuates its predisposition to leukaemic transformation. Nat Commun 2014; 5: 4177. [DOI] [PubMed] [Google Scholar]
- O'Donnell RK, Kupferman M, Wei SJ, Singhal S, Weber R, O'Malley B et al. Gene expression signature predicts lymphatic metastasis in squamous cell carcinoma of the oral cavity. Oncogene 2005; 24: 1244–1251. [DOI] [PubMed] [Google Scholar]
- Lin SC, Liu CJ, Chiu CP, Chang SM, Lu SY, Chen YJ. Establishment of OC3 oral carcinoma cell line and identification of NF-kappa B activation responses to areca nut extract. J Oral Pathol Med 2004; 33: 79–86. [DOI] [PubMed] [Google Scholar]
- Lu YC, Chen YJ, Wang HM, Tsai CY, Chen WH, Huang YC et al. Oncogenic function and early detection potential of miRNA-10b in oral cancer as identified by microRNA profiling. Cancer Prev Res (Phila) 2012; 5: 665–674. [DOI] [PubMed] [Google Scholar]
- Yang CC, Tu SF, Chang RC, Kao SY. In vitro cellular response of retinoic acid treated human oral cancer cell lines. Zhonghua Yi Xue Za Zhi (Taipei) 2001; 64: 357–363. [PubMed] [Google Scholar]
- Okumura K, Konishi A, Tanaka M, Kanazawa M, Kogawa K, Niitsu Y. Establishment of high- and low-invasion clones derived for a human tongue squamous-cell carcinoma cell line SAS. J Cancer Res Clin Oncol 1996; 122: 243–248. [DOI] [PubMed] [Google Scholar]
- Momose F, Araida T, Negishi A, Ichijo H, Shioda S, Sasaki S. Variant sublines with different metastatic potentials selected in nude mice from human oral squamous cell carcinomas. J Oral Pathol Med 1989; 18: 391–395. [DOI] [PubMed] [Google Scholar]
Associated Data
This section collects any data citations, data availability statements, or supplementary materials included in this article.


