

Abstract
Tracheal sounds have been the subject of many research studies. In this review, we describe the state of the art, original work relevant to upper airways obstruction during sleep, and ongoing research concerning the methods used when analysing tracheal sounds. Tracheal sound sensors are a simple and noninvasive means of measurement and are more reliable than other breathing sensors. Developments in acoustic processing techniques and enhancements in tracheal sound signals over the past decade have led to improvements in the accuracy and clinical relevance of diagnoses based on this technology. Past and current research suggests that they may have a significant role in the diagnosis of obstructive sleep apnoea.
Key points
Tracheal sounds are currently a topic of significant interest but are not yet used in most routine sleep study systems.
Measured at the suprasternal notch, tracheal sounds can provide reliable information on breathing sounds, snoring sounds and respiratory efforts.
Tracheal sounds may be used as a noninvasive method of studying abnormalities of the upper airways during wakefulness.
Educational aims
To understand the principles of tracheal sound measurement and analysis.
To highlight the importance of tracheal sounds for the diagnosis of sleep apnoea–hypopnoea syndrome.
To present the most relevant clinical studies that have validated the use of tracheal sound sensors and to make future clinical validation studies possible.
Short abstract
Tracheal sounds analysis may have a significant role in the diagnosis of obstructive sleep apnoea http://ow.ly/f7ax30cAcnP
Background
Advances in technology have made it possible to achieve noninvasive and reliable recordings of physiological parameters for the diagnosis of sleep apnoea. Apnoea is a complete cessation of airflow and hypopnoea a reduction of airflow usually occurring during sleep [1]. Based on underlying pathophysiology, these respiratory events are classified as obstructive or central, i.e. with or without increased respiratory efforts. Accurate and reliable detection and classification of apnoeas and hypopneas is critical for the diagnosis and quantification of disease severity, as well as for appropriate therapy selection.
According to international recommendations [1], the method of choice for detecting respiratory events during sleep is by identifying reductions in airflow or tidal volume. Thermistors and nasal cannula pressure transducers are the most commonly used sensors for measuring airflow in routine sleep studies. However, thermistors are temperature sensors and do not provide quantitative measurements of airflow for the detection of hypopnoea. In addition, misclassification of respiratory events when using nasal pressure alone is common in the presence of mouth breathing, especially in paediatric patients and cases of nasal obstruction. Furthermore, while thermistors and nasal cannulas are recommended for the detection of apnoeas and hypopnoeas, their signal validity for >6 h of recording is less than 60% in both children [2] and adults [3].
Oesophageal manometry is considered the golden standard for the estimation of respiratory effort and classification of events [1]. However, this method is invasive and can affect sleep quality [4], so is therefore not used for routine sleep studies. In the absence of oesophageal pressure (Poes), respiratory inductance plethysmography (RIP) is recommended for the evaluation of respiratory efforts during sleep studies [1]. Nevertheless, reliable results with these sensors are dependent on accurate placement and stability of the belts, which is challenging in certain patients, particularly young children, pregnant women and obese patients. In addition, accuracy during recording can be diminished by displacement of the belts due to body movements during the night. Thus, alternative methods for detecting oral airflow and evaluating respiratory effort during sleep are needed. The use of an ambient microphone snoring [5] or nocturnal breathing sounds [6] has been advocated for evaluating obstructive sleep apnoea (OSA). Breathing sound analysis provides valuable information about airway structure and respiratory disorders, including OSA. Tracheal sounds, heard at the suprasternal notch, are currently a topic of significant interest. Tracheal sound signals are louder and cover a wide frequency range compared with lung sounds heard on the chest wall [7]. They are rich in information regarding breathing and could therefore play an important role in monitoring respiratory activity, as well as in the detection and characterisation of respiratory events, during sleep.
Tracheal sounds
What are tracheal sounds?
Tracheal sounds, heard at the suprasternal notch, are a measure of the body surface vibrations set into motion by pressure fluctuations. These pressure variations are transmitted through the inner surface of the trachea from turbulent airflow in the airways [8]. The vibrations are determined by the magnitude and frequency content of the pressure, and by the mass, elastance and resistance of the tracheal wall and surrounding soft tissue. Thus, the surface sensor detects tracheal wall vibrations, not regular acoustic sounds. This characteristic can be used not only to detect tracheal breathing sounds (flow and snoring) but also to record suprasternal pressure (SSP), a good surrogate for evaluation of respiratory effort [9, 10].
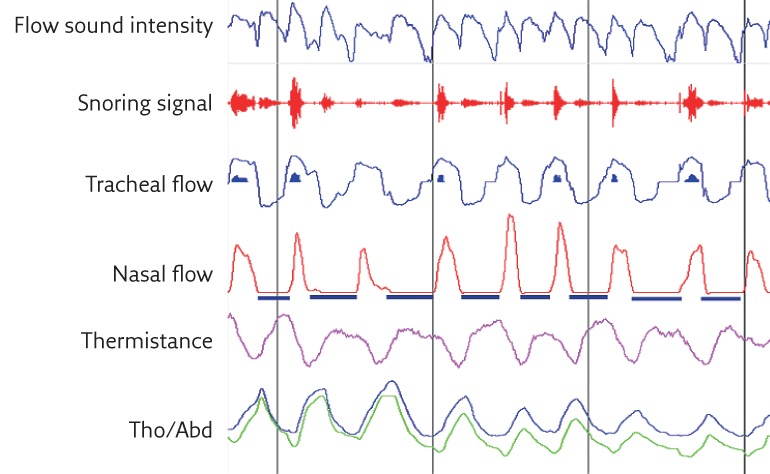
Given the relatively short distance between the sensor and the various sound sources in the airways, the tracheal sound intensity is robust enough, even at low airflow rates, so an acceptable signal-to-noise ratio can be achieved without pre-amplification. This makes tracheal sounds more sensitive to changes in respiratory flow in comparison with lung sounds. In addition, the response characteristics for most sensors are linear over a wide range of frequencies [11]. Tracheal sounds are also better correlated with airflow than lung sounds and if properly processed, they can distinguish inspiration from expiration. Figure 1 shows an example of the accuracy of respiratory cycle delimitation using a tracheal sound signal. Compared with lung sounds measured through the chest wall, tracheal sounds are often considered to be purer and less filtered breath sounds, and are therefore more useful when studying breathing and diagnosing various respiratory disorders, particularly OSA.
Figure 1.

Automatic breathing sound respiratory cycle delimitation using envelope detection techniques. The beginning and the end of inspiration and expiration are properly detected and correspond closely with the respiratory cycle delimitation on the nasal pressure signal as well as the RIP signals. Tho/Abd: thoracoabdominal.
In comparison with normal subjects, OSA patients have specific upper airway (UAW) characteristics, such as higher airway collapsibility and a smaller cross-sectional area at several levels of the pharynx [5]. These characteristics can affect the resonance produced by the UAW and impact on the tracheal breathing sounds. The measurements of tracheal sounds provide valuable information concerning UAW obstruction [12]. Apnoea monitoring through simple recording and analysis of tracheal sounds is therefore of interest to sleep physicians. Sanchez and Pasterkamp [13] studied the characteristics of tracheal sounds in children and adults and the possibility of a correlation between tracheal sound spectra and body length. They found that children had significantly louder sounds, and that tracheal sounds at a given flow had higher frequency components in children than in adults depending on body length. These findings suggest that sound characteristics are the result of resonance, which depends on UAW dimensions. Thus, tracheal sounds may be used as a noninvasive method of studying abnormalities of the UAW.
Technical aspects of tracheal sound sensors
Like electronic stethoscopes, tracheal sound sensors consist of an acoustic sensor inserted into a thick protective plastic chamber, with deep cuff creating an airtight space between the transducer and the skin of the patient (figure 2). The chamber must have a certain shape and dimensions to ensure a good quality tracheal sound signal recording and for improved practicability of the sensor. Usually, the cavity has a cylindrical shape and the sensor in closest contact with the patient’s face is convex so that it fits the curve just above the suprasternal notch. To ensure that the acoustic sensor never touches the skin of the patient during recording, the sensor’s cavity allows an air gap of 2–3 mm, between the sensor and the contact surface of the chamber. Air tightness is crucial to prevent ambient noise and a double-sided ring tape is used to attach the cavity to the patient’s skin. However, during recordings, signal saturation may occur as the sensor is air-coupled to the skin by a closed cavity. To solve the saturation problem, a calibrated hole on the back of the sensor is used to decrease the sensitivity of the sensor. The recorded signal is usually amplified; however, this amplification may not always be necessary given the high intensity of the tracheal sound signals. The signal is, however, band pass filtered to separate the high-pitched frequencies of the breathing sound from the low-pitched frequencies of the snoring sound. Depending on the tracheal sound systems used, the flow sound is usually detected at frequencies of 200–2000 Hz, with an intensity no greater than a certain threshold level. The snoring sound is usually detected at a frequency of 20–200 Hz, with an intensity that exceeds a predetermined threshold level. In a particularly advanced system, the PneaVoX (Cidelec, Sainte Gemmes sur Loire, France), a third band pass filter, is used at a much lower frequency range to extract SSP variations, which could be used for the detection of respiratory effort and help characterise the respiratory events during a sleep study.
Figure 2.

Presentation of a tracheal sound transducer. a) Diagram of the PneaVoX sensor that uses both an acoustic sensor and an SSP sensor. The sensors are inserted in a protective plastic housing to ensure an airtight acoustic chamber between the skin and the transducer. b) The sensor. c) Attachment of tracheal sound sensors to the skin using double-faced tape with an adhesive bandage over the sensor.
Before analysis, extracted signals are sampled and digitised using analogue-to-digital converters. The choice of sampling rate and the number of bits used for A/D conversion varies from one system to another and may affect signal quality. Incorrect positioning of the tracheal sound sensor can also result in poor quality or absence of the signal. The sensor should be placed on the skin above the sternal notch and then secured in place using adhesive tape (figure 2). Tracheal sound sensors are less likely to be displaced or removed by patients compared with other sensors during a recording session, especially in sleep studies. However, the quality of the measurement is also influenced by the characteristics of the sensor.
Tracheal sound sensors in sleep study systems
Today, the majority of commercial apnoea monitoring devices include acoustic sensors in their systems. However, most of these applications only use the acoustic signal for the detection, monitoring and analysis of snoring in general, an indication of UAW narrowing during sleep. Many studies have evaluated the use of tracheal sound sensors and developed different methods and automatic algorithms for the detection and classification of apnoeic events during sleep. However, most sleep study systems are yet to implement these proposed methods and use the tracheal sound sensors as a supplement sensor to the routinely used sensors.
Penzel and coworkers [14, 15] proposed one of the first ambulatory recording (MESAM; Madaus Medizin Elektronik GmbH, Gundelfingen, Germany) systems (now discontinued) using a combination of heart rate and snoring analysis to detect sleep-related breathing disorders. They first used a two-channel recorder with a laryngeal microphone and ECG electrodes [16]. A four-channel recorder was developed later with an additional oximeter and a small position sensor [17]. An automatic analysis algorithm was developed and allowed the discrimination between frequencies associated with snoring and those related to other breathing sounds. The MESAM system proved to be valuable in clinical practice with >10 000 recordings made during 6 years of use. Later, the system evolved to the Poly-MESAM and the Micro-MESAM, still used under the name ApneaLink (Resmed, San Diego, CA, USA). However, the systems no longer analyse tracheal sounds.
To our knowledge, the only tracheal sound sensor commercially available today for sleep studies with various polygraphy and polysomnography systems is the PneaVoX. In 1995, a study by Van Surell et al. [18] compared a PG system that used tracheal sounds with SSP for detection and classification of apnoeas, to a routine PSG recording in 50 patients. They concluded that the PG system could be used to detect severe OSA. This technology has been extensively used in clinical practice in France for the last 25 years.
Clinical applications for sleep studies
Respiratory flow measurement and detection of events
Tracheal sounds correlate well with respiratory flow and could be used in the same way as any other flow signal for the analysis of respiratory events during sleep. The detection of tracheal sounds for the measurement of sleep-related respiratory disorders has therefore widely been investigated in many studies. In 1980, Krumpe et al. [16] were the first to show that laryngeal sound monitoring could be useful in sleep studies. They found that apnoea could be identified by the cessation of laryngeal sounds during continuous monitoring. In 1982, Cummiskey et al. [17] used a tracheal sound sensor associated with a thermistor, a nasal pressure cannula and pulse oximetry for the detection of apnoeas and hypopneas. They showed that there was no significant difference in the number of events detected with the tracheal sounds or the reference sensors. In 1988, Penzel et al. [19] developed a new technique for online snoring analysis using a combination of filtered and unfiltered output signals from one laryngeal microphone. They proposed a method that could differentiate between obstructive apnoeas characterised by low volume snoring and the hyperventilation at the termination of apnoeas characterised by loud snoring. However, these studies only compared tracheal sound recordings with the conventional method of thermistors or nasal pressure but not with direct measurements of airflow using a pneumotachograph (PNT).
In 1989, Meslier et al. [20] simultaneously recorded tracheal sound and PNT signals during sleep in healthy patients. The tracheal breathing sounds were detected using a microphone air-coupled to a stethoscope head and placed right on the sternal notch, which was not the case in previous studies. There was no difference in the number of apnoeas and their duration recorded using the tracheal sound method and the PNT. However, apnoeas appear to be more frequent and of shorter duration when using the thermistor method compared with the tracheal sound method. In 1990, Soufflet et al. [21] studied the interaction between tracheal sounds and respiratory rate. They recorded respiratory flow in nine healthy subjects using tracheal microphones and a PNT, and showed that tracheal sounds correlated with the respiratory flow and could be used to measure the flow rate.
These studies mainly analysed the tracheal sound signals in the time domain and investigated how the tracheal intensity signal changes with time; later studies explored frequency analysis of tracheal sound signals systematically and examined how much of the signal lies within each given frequency band over a range of frequencies. In 2004, Nakano et al. [22] recommended the use of tracheal sound signals in ambulatory diagnostic devices, especially for patients with a high probability of OSA. In 2010, Yadollahi et al. [23] evaluated the use of tracheal sounds and pulse oximetry in comparison to PSG. A high correlation was demonstrated between events defined by changes in tracheal sounds and oxygen saturation, and standard PSG scoring. In a recently published study, Mlynczak et al. [24] used a wireless acoustic sensor placed on the tracheal notch to measure breathing sounds during sleep. The study investigated the accuracy of a new method in differentiating between normal breathing sounds and snoring episodes. This system was the first to propose a wireless tracheal sound sensor and to use a smartphone application for its interface. This new system may therefore qualify as a good tool for simple OSA screening.
The American Academy of Sleep Medicine (AASM) recommends scoring a respiratory event in adults as an apnoea if there is a drop in the peak signal excursion by ≥90% of pre-event baseline using an oronasal thermal sensor or an alternative apnoea sensor and that the duration of the ≥90% drop in sensor signal is ≥10 s. Using this criteria, apnoeas can easily be detected using a tracheal flow intensity signal (figure 3) [1]. Detecting hypopnoeas using tracheal sounds is more difficult, particularly with time domain visual analysis (figure 4). However, many tracheal sound automatic analysis techniques have been developed that mainly use frequency domain exploration of the tracheal sounds [19]. Yadollahi and Moussavi [25] developed an automatic acoustic method for detecting apnoeas and hypopnoeas using only tracheal sounds and arterial oxygen saturation measured by pulse oximetry (SpO2). They showed a high correlation (96%) of tracheal sound analysis with PSG results, and the method performed well in differentiating simple snorers from OSA patients. Other techniques, such as compressed tracheal sound analysis, have been used to screen for sleep-disordered breathing. Visual analysis as well as automatic analysis with non-linear filtering of compressed tracheal sounds seemed to provide an effective way of screening for obstructive apnoeas and hypopneas during sleep [26].
Figure 3.

Detection of three consecutive obstructive apnoeas using the PneaVoX tracheal sound sensor. 1) Absence of tracheal sound (absence of respiratory cycles on the flow sound intensity and the snoring intensity signals). 2) Absence of oronasal flow on the thermistor signal. 3) Absence of nasal pressure on the nasal pressure signal.
Figure 4.
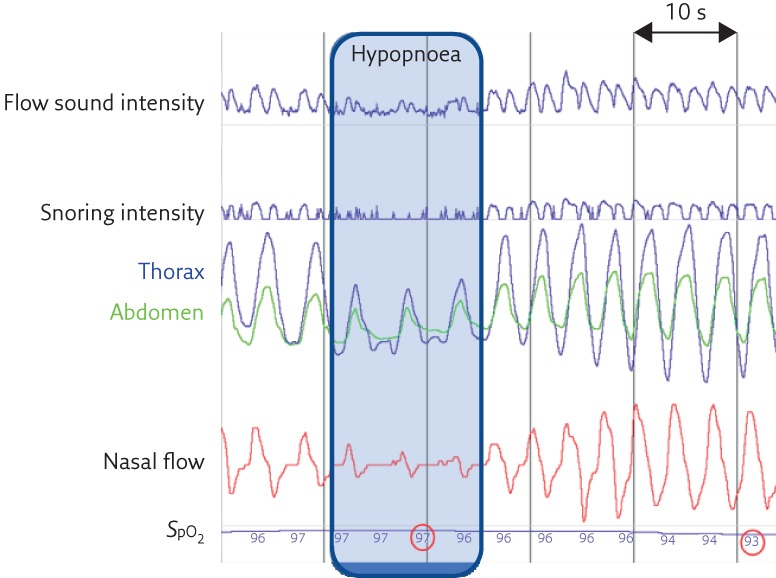
A respiratory event with the criteria for hypopnoea without snoring sounds. Persistence of respiratory cycles in the flow sound signal but reduced in amplitude both at inspiration and expiration.
Snoring signal and the characterisation of events
For snoring sound analysis, Azarbarzin and Moussavi [27] showed that ambient snoring sounds are not as characteristic as tracheal snoring sounds. The signal-to-noise ratio and the power of the signal are much higher, with tracheal sounds making it easier to distinguish between regular snoring sounds and snoring sounds in apnoeic patients. Snoring sounds associated with OSA have characteristics that are not easily detected with ambient microphones. For better analysis of snoring sounds, the placement of the sensor on the suprasternal notch is recommended [28].
Snoring sound is also useful for the characterisation of hypopnoeas. The AASM suggests classifying hypopnoeas as obstructive if snoring is detected during the event [1]. Furthermore, the presence of snoring can help avoid misclassification of hypopnoeas as apnoeas when the magnitude of airflow reduction is overestimated due to nasal obstruction or poor positioning of the nasal cannula. However, it is possible to note another type of noise during apnoeas, known as a “choking sound”, which is induced by intense respiratory effort with a slight, transient reopening of the UAW during the obstructive apnoea. Scorers must not confuse this choking sound with snoring sounds. Snoring sounds are always associated with well-established respiratory cycles and snoring occurs either during inspiration or during expiration. However, choking sounds appear in the absence of respiratory cycles because there is no air movement.
SSP as a surrogate measure of respiratory effort
So far, most studies of tracheal and snoring sounds have mainly concentrated on automatic detection of apnoea and hypopnoea events, and have not used tracheal sounds for event characterisation, which is however crucial for correct diagnosis. Three types of apnoeas have been distinguished. Obstructive apnoeas are defined as apnoeas with constant or increased respiratory efforts. In the absence of respiratory effort, apnoeas are central, and if the event starts as central but respiratory effort resumes during the event, the apnoea is mixed [1]. To distinguish between obstructive, central and mixed apnoeas, in addition to flow measurement for the detection of events, it is necessary to record the inspiratory effort during sleep. The low-pitched snoring sound signal and the high-pitched breathing sound signal can be extracted at different frequency bands from a raw tracheal sound signal. In addition, a non-audible, much lower frequency signal corresponding to SSP can also be derived using band pass filtering. This signal corresponds to pressure variations induced by respiratory effort. The patient’s respiratory effort causes variations in pharyngeal pressure, which induces pressure variations in the tracheal sound sensor chamber. These pressure variations are measured through movements of the skin in contact with the sensor at the sternal notch. SSP allows apnoeas to be characterised as obstructive, central or mixed [9, 10]. Figure 5 shows an example of a mixed apnoea where respiratory effort is absent at the beginning of the event and resumes before the event finishes. In the absence of respiratory effort, the RIP signals as well as the SSP signals may be limited to higher frequency cardiogenic oscillations (figure 5), not to be confused with respiratory efforts that are characterised by lower frequency oscillations. In a study that used visual analysis of tracheal sound signals, Meslier et al. [9] showed a solid correlation between SSP and Poes signals in the measurement of respiratory effort for apnoea classification. A recording system with a tracheal sound sensor (an older generation of the PneaVoX) was used in this study. In addition to recording tracheal sounds and snoring, the acoustic sensor allows SSP to be recorded. The SSP measurements showed good sensitivity (99.4%) and specificity (93.6%) for the visual evaluation of respiratory efforts in adults when compared with Poes. In the French recommendations for clinical practice, measurement of SSP was recommended for the classification of apnoea events with an Oxford Centre for Evidence-Based Medicine level III of evidence [29]. However, due to the non-linear nature of the microphone used in the study, there were some limitations to the approach, especially for correct intrathoracic pressure detection. A new generation PneaVoX was developed using a combination of a pressure transducer and a microphone in a single device (figure 2). In a recent study, Amaddeo et al. [10] compared the PneaVoX sensor to the sensors recommended by the AASM (the oronasal thermal sensor and RIP belts) for the characterisation of sleep apnoeas in 20 children. In comparison with the recommended polygraph sensors, the PneaVoX sensor had a high degree of signal validity in children and could be a useful tool for characterising apnoeas in children.
Figure 5.

Example of a mixed apnoea where respiratory efforts are absent at the beginning of the event and resume before the event finishes. The respiratory efforts evaluated with the SSP are confirmed by the RIP signals as well as by the oesophageal pressure.
Use of tracheal sounds in other applications
In addition to their ability to detect respiratory efforts and characterise apnoea, tracheal sound sensors can also detect oral breathing (figure 6). Oral breathing detection is important in sleep studies and the AASM recommends the use of thermistors [1]. During oral breathing, patients inhale through their nose and exhale through their mouth or vice versa. Consequently, the nasal pressure signal is null or significantly reduced while the thermistor signal detects respiratory variations. In these situations, the use of nasal pressure alone to evaluate the respiratory flow may result in false detection of apnoeas, especially in children. During a sleep study, tracheal sound sensors could be used as adjunct airflow sensors to reliably detect mouth breathing. In comparison with oronasal thermistors, tracheal sound sensors are less likely to be displaced or removed by the patient during a sleep study recording, as they are taped on the sternal notch. However, there is no study to date that evaluates the reliability of tracheal sound analysis in the detection of oral breathing.
Figure 6.
Detection of oral breathing using tracheal sounds. During expiration, the nasal pressure signal is null while the sound signal remains present. The oral expiration detected by the tracheal sound signal is confirmed by the thermistor signal, which shows respiratory variations.
Recently, several studies have investigated the use of tracheal breathing sounds in the characterisation of UAW during wakefulness in order to predict OSA. Using computed tomography, Heo and Kim [30] demonstrated a significant correlation between the apnoea–hypopnoea index and the UAW minimal cross-sectional area, during both sleep and wakefulness. Solà-Soler et al. [31] showed that severe OSA patients could be identified during wakefulness by using a combination of patient anthropometric parameters and tracheal sound information. Montazeri and Moussavi [32] used tracheal sounds to screen for OSA during wakefulness. Extracted spectral features of the tracheal sounds showed characteristics that could easily discriminate OSA patients from control subjects. In a recent study, Elwali and Moussavi [33] used tracheal breathing sound spectrum analysis for characterisation of airways structure during wakefulness and daytime screening for OSA. The extracted tracheal sound features correlated well with AHI and accurately separated OSA from non-OSA subjects. The results of these studies open the way for future clinical validation of reliable, fast, simple, noninvasive and inexpensive screening tools for OSA during wakefulness.
Conclusion
Studies show that tracheal sounds that are recorded with appropriate sensors, rather than simple microphones, can pick up breathing, snoring and intrathoracic pressure variations. These three parameters are important in the diagnosis and classification of sleep disordered breathing. Although they are not defined in the international coding manual for sleep studies [1], these parameters are currently used in diagnostic sleep studies in patients with suspected sleep disordered breathing. Some aspects, such as the recognition of respiratory events, are well confirmed in several studies using automatic algorithms based on spectral analysis. However, more studies are still required that use visual analysis of the tracheal flow sound signal in the time domain. Other aspects, such as the indirect evaluation of intrathoracic pressure changes, are currently being investigated; further validation studies are required that compare it to Poes recordings to determine their use and limitations in distinguishing obstructive and central respiratory events. The use of tracheal sound recording and analysis can be a good and validated substitute for respiratory flow according to SCOPER (sleep, cardiovascular, oximetry, position, effort and respiratory) criteria. SCOPER criteria also indicate that respiratory effort should be recorded. This is usually performed using RIP. The PneaVoX sensor provides a substitute for respiratory effort according to SCOPER criteria. However, further studies are needed to establish the validity of this surrogate.
Educational questions
- Which of the following signals is measured using tracheal sounds?
- a) Snoring sound
- b) Breathing sound
- c) Suprasternal pressure
- d) All of the above
- e) None of the above
- Tracheal sounds can easily be used for the visual detection of:
- a) Apnoeas
- b) Hypopneas
- c) Respiratory efforts
- d) All of the above
- e) None of the above
- Studies have shown that tracheal sounds could be used as:
- a) A tool for OSA diagnosis during sleep
- b) A tool for OSA diagnosis during wakefulness
- c) A tool for detection of oral breathing
- d) All of the above
- e) None of the above
- Apnoeas should be classified as central if:
- a) The tracheal sound signals are reduced to cardiogenic oscillations
- b) The tracheal sounds display choking noises
- c) The suprasternal pressure signal is decreased to 50% of the baseline
- d) All of the above
- e) None of the above
- Apnoeas should be classified as obstructive if:
- a) The suprasternal pressure fluctuates at respiratory frequency during the events
- b) The tracheal sounds detect choking noise
- c) The tracheal sounds detect snoring
- d) All of the above
- e) None of the above
Suggested answers
d.
a and c.
d.
a.
a and b.
Disclosures
T. Penzel EDU-0088-2017_Penzel (1.2MB, pdf)
A. Sabil EDU-0088-2017_Sabil (1.2MB, pdf)
Footnotes
Conflict of interest Disclosures can be found alongside this article at breathe.ersjournals.com
References
- 1.Berry RB, Brooks R, Gamaldo CE, et al. . The AASM Manual for the Scoring of Sleep and Associated Events: Rules, Terminology and technical specifications. Version 2.1. Darien, American Academy of Sleep Medicine, 2014. [Google Scholar]
- 2.Goodwin JL, Enright PL, Kaemingk KL, et al. . Feasibility of using unattended polysomnography in children for research – report of the Tucson Children’s Assessment of Sleep Apnea study (TuCASA). Sleep 2001; 24: 937–944. [DOI] [PubMed] [Google Scholar]
- 3.Redline S, Sanders MH, Lind BK, et al. . Methods for obtaining and analyzing unattended polysomnography data for a multicenter study. Sleep Heart Health Research Group. Sleep 1998; 21: 759–767. [PubMed] [Google Scholar]
- 4.Chervin RD, Aldrich MS. Effects of esophageal pressure monitoring on sleep architecture. Am J Respir Crit Care Med 1997; 156: 881–885. [DOI] [PubMed] [Google Scholar]
- 5.Solà-Soler J, Fiz JA, Morera J, et al. . Multiclass classification of subjects with sleep apnoea-hypopnoea syndrome through snoring analysis. Med Eng Phys 2012; 34: 1213–1220. [DOI] [PubMed] [Google Scholar]
- 6.Azarbarzin A, Moussavi Z. Snoring sounds variability as a signature of obstructive sleep apnea. Med Eng Phys 2013; 35: 479–485. [DOI] [PubMed] [Google Scholar]
- 7.Gavriely N, Cugell D. Airflow effects on amplitude and spectral content of normal breath sounds. J Appl Physiol 1996; 80: 5–13. [DOI] [PubMed] [Google Scholar]
- 8.Gavriely N. Breath Sounds Methodology. Boca Raton, CRC Press, 1995; pp. 31–33. [Google Scholar]
- 9.Meslier M, Simon I, Kouatchet I, et al. . Validation of a suprasternal pressure transducer for apnea classification during sleep. Sleep 2002; 25: 753–757. [DOI] [PubMed] [Google Scholar]
- 10.Amaddeo A, Fernandez-Bolanos M, Olmo Arroyo J, et al. . Validation of a suprasternal pressure sensor for sleep apnea classification in children. J Clin Sleep Med 2016; 12: 1641–1647. [DOI] [PMC free article] [PubMed] [Google Scholar]
- 11.Yadollahi A, Moussavi Z. Measuring minimum critical flow for normal breath sounds. Conf Proc IEEE Eng Med Biol Soc 2005; 3: 2726–2729. [DOI] [PubMed] [Google Scholar]
- 12.Ayappa I, Rappaport DM. The upper airway in sleep: physiology of the pharynx. Sleep Med Rev 2003; 7: 9–33. [DOI] [PubMed] [Google Scholar]
- 13.Sanchez I, Pasterkamp H. Tracheal sound spectra depend on body height. Am Rev Respir Dis 1993; 148: 1083–1087. [DOI] [PubMed] [Google Scholar]
- 14.Penzel T, Amend G, Meinzer K, et al. . MESAM: a heart rate and snoring recorder for detection of obstructive sleep apnea. Sleep 1990; 13: 175–182. [DOI] [PubMed] [Google Scholar]
- 15.Penzel T, Peter JH. Design of an ambulatory sleep apnea recorder In: Nagle HT, Tompkins WJ. Case Studies in Medical Instrument Design. Orlando, The Institute of Electrical and Electronics Engineers Inc., 1991; pp. 171–179. [Google Scholar]
- 16.Krumpe PE, Cummiskey JM. Use of laryngeal sound recordings to monitor apnea. Am Rev Respir Dis 1980; 122: 797–801. [DOI] [PubMed] [Google Scholar]
- 17.Cummiskey J, Williams TC, Krumpe PE, et al. . The detection and quantification of sleep apnea by tracheal sound recordings. Am Rev Respir Dis 1982; 126: 221–224. [DOI] [PubMed] [Google Scholar]
- 18.Van Surell C, Lemaigre D, Leroy M, et al. . Evaluation of an ambulatory device, CID 102, in the diagnosis of obstructive sleep apnoea syndrome. Eur Respir J 1995; 8: 795–800. [PubMed] [Google Scholar]
- 19.Penzel T, Amend G, Peter JH, et al. . Objective monitoring of therpeutical success in heavy snorers: a new technique In: Chouard CH, ed. Chronic Rhonchopathy. London, John Libbey Eurotext, 1988; pp. 273–278. [Google Scholar]
- 20.Meslier N, Racineux JL. Use of tracheal sound recordings to monitor airflow during sleep In: Peter JH, Podszus T, von Wichert P, eds. Sleep Related Disorders and Internal Diseases. Berlin, Springer, 1987; pp. 121–124. [Google Scholar]
- 21.Soufflet G, Charbonneau G, Polit M, et al. . Interaction between tracheal sound and flow rate: a comparison of some different flow evaluations from lung sounds. IEEE Trans Biomed Eng 1990; 37: 384–391. [DOI] [PubMed] [Google Scholar]
- 22.Nakano H, Hayashi M, Ohshima E, et al. . Validation of a new system of tracheal sound analysis for the diagnosis of sleep apnea-hypopnea syndrome. Sleep 2004; 27: 951–957. [DOI] [PubMed] [Google Scholar]
- 23.Yadollahi A, Giannouli E, Moussavi Z. Sleep apnea monitoring and diagnosis based on pulse oximetry and tracheal sound signals. J Med Biol Eng Comput 2010; 48: 1087–1097. [DOI] [PubMed] [Google Scholar]
- 24.Mlynczak M, Migacz E, Migacz M, et al. . Detecting breathing and snoring episodes using a wireless tracheal sensor – a feasibility study. IEEE J Biomed Health Inform 2016; in press [https://doi.org/10.1109/JBHI.2016.2632976]. [DOI] [PubMed] [Google Scholar]
- 25.Yadollahi A, Moussavi Z. Acoustic obstructive sleep apnea detection. Conf Proc IEEE Eng Med Biol Soc 2009; 2009: 7110–7113. [DOI] [PubMed] [Google Scholar]
- 26.Kulkas A, Rauhala E, Huupponen E, et al. . Detection of compressed tracheal sound patterns with large amplitude variation during sleep. Med Biol Eng Comput 2008; 46: 315–321. [DOI] [PubMed] [Google Scholar]
- 27.Azarbarzin A, Moussavi Z. A comparison between recording sites of snoring sounds in relation to upper airway obstruction. Conf Proc IEEE Eng Med Biol Soc 2012; 2012: 4246–4249. [DOI] [PubMed] [Google Scholar]
- 28.Rauhala E, Hasan J, Kulkas A, et al. . Compressed tracheal sound analysis in screening of sleep-disordered breathing. Clin Neurophysiol 2008; 119: 2037–2043. [DOI] [PubMed] [Google Scholar]
- 29.Recommandations pour la pratique clinique du syndrome d’apnées hypopnées obstructives du sommeil de l’adulte. Rev Mal Respir 2010; 27: S115–SS12. [DOI] [PubMed] [Google Scholar]
- 30.Heo JY, Kim JS. Correlation between severity of sleep apnea and upper airway morphology: cephalometry and MD-CT study during awake and sleep states. Acta Oto-Laringol 2011; 131: 84–90. [DOI] [PubMed] [Google Scholar]
- 31.Solà-Soler J, Fiz JA, Torres A, et al. . Identification of obstructive sleep apnea patients from tracheal breath sound analysis during wakefulness in polysomnographic studies. Conf Proc IEEE Eng Med Biol Soc 2014; 2014: 4232–4235. [DOI] [PubMed] [Google Scholar]
- 32.Montazeri A, Moussavi Z. Obstructive sleep apnea prediction during wakefulness. Conf Proc IEEE Eng Med Biol Soc 2011; 2011: 773–776. [DOI] [PubMed] [Google Scholar]
- 33.Elwali A, Moussavi Z. Obstructive sleep apnea screening and airway structure characterization during wakefulness using tracheal breathing sounds. Ann Biomed Eng 2017; 45: 839–850. [DOI] [PubMed] [Google Scholar]
Associated Data
This section collects any data citations, data availability statements, or supplementary materials included in this article.
Supplementary Materials
T. Penzel EDU-0088-2017_Penzel (1.2MB, pdf)
A. Sabil EDU-0088-2017_Sabil (1.2MB, pdf)