Abstract
The phase behavior of many conjugated polymers is rich with both crystalline and liquid crystalline phases. Recent computational efforts have identified the isotropic-to-nematic transition temperature for polymers such as poly(3-hexylthiophene-2,5-diyl) (P3HT). Herein, model predictions are combined with experimentally determined values of the equilibrium melting temperature as a function of chain length to provide the complete phase behavior for P3HT. Additionally, because a full description of the phase behavior requires proper accounting for the regioregularity of the chain, a thermodynamic relationship is derived to predict this behavior as a function of both chain length and regioregularity and the impact of regioregularity on the expected phase diagram is discussed.
The phase behavior of many conjugated polymers is rich but not yet fully explored. Stiff chain conformations and planar ring-like structures can promote both crystalline and liquid crystalline phases. For example, for poly(3-alkylthiophene-2,5-diyl)s, nematic phases have been predicted1,2 and observed3,4 in addition to crystalline phases5. The presence of a stable mobile liquid crystalline phase can have a great impact on device post processing for flexible and printed electronics. As a case in point, a stable liquid crystalline phase has been shown to enable “healing” of grain boundaries and correspondingly to improved field effect transistor charge mobility in semiconducting polymers after annealing in the mobile liquid crystalline phase below the isotropization temperature, i.e., clearing point.6,7
Recent computational efforts that rely on atomistic and field-theory simulations have identified the nematic coupling parameter for polymers such as poly(3-hexylthiophene-2,5-diyl) (P3HT) and as a consequence the isotropic-to-nematic transition temperature TIN as a function of chain length n up to 1000 repeat units.2 The simulation results were then fit to a Gibbs-Thomson functional form with the result being
| (1) |
Combining these values with measurements of the crystal melting temperature then provides the complete phase behavior for P3HT, if the equilibrium melting temperature can be extracted. A full description must account for the regioregularity of the chain, because regioregularity affects the crystal melting temperature although it is not expected to affect the isotropic to liquid crystal transition.
Recent work has demonstrated8 that for monodisperse oligomeric 3-hexylthiophene and P3HT fractions a good fit to crystal size versus melting temperature can be achieved through a thermodynamic relationship previously validated9 for paraffins and polyethylene fractions.
| (2) |
where Tm 0 is the equilibrium melting temperature of an infinitely thick crystal, and a and b are fitting constants that are approximately given by a ≈ ΔHe/ΔHu and b ≈ ΔSe/ΔSu with ΔHu and ΔSu the enthalpy and entropy of fusion per crystal repeat unit and ΔHe and ΔSe the enthalpic and entropic penalty due to the fold/end crystal-melt interfaces. For the Form I P3HT crystal (high molar mass form), values of Tm 0 = (545 ± 6) K (272 °C), a = (−5.4 ± 0.5), and b = (−1.6 ± 0.4) have been obtained.8
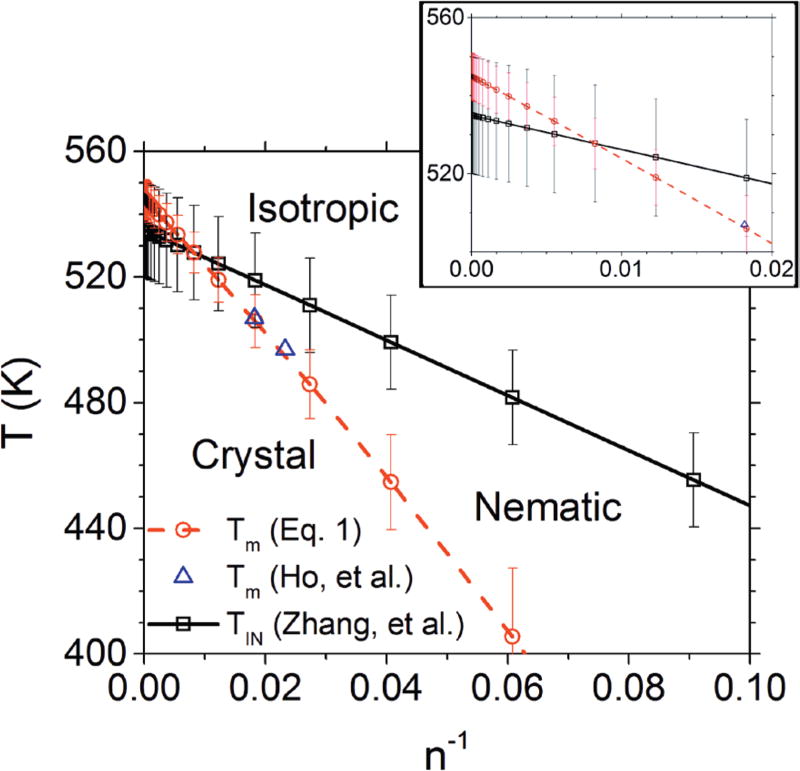
Figure 1 puts together the equilibrium melting temperatures with the predicted isotropic-to-nematic transition temperatures for P3HT as a function of molar mass. Denoting the equilibrium melting temperatures distinguishes Figure 1 in this work from Figure 10 of ref. 2. The Form II P3HT crystal, where the side chains interdigitate, becomes less stable10 than the Form I crystal at approximate n>14, so it has not been included in the phase diagram and only the Form I crystal melting line is shown. The phase diagram indicates that above about 20 kg/mol the nematic phase would not be observed because the crystalline phase is more thermodynamically stable; unfortunately, the error estimates associated with both TIN and Tm from Eq. 2 argue against a definitive determination of whether there exists a value of n above which the nematic phase will not be observed.
FIGURE 1.
(color online) P3HT phase diagram in terms of temperature T and number of repeat units n showing phase boundaries and stable thermodynamic states. The isotropic-nematic phase boundary was derived from Eq. 1. The Form I crystal melting data and line are from Eq. 2 with the parameters from Ref. 8. The error bars for TIN were taken from Ref. 2 and the error bars for Tm were obtained from the uncertainties in the fit parameters to Eq. 2. Triangles correspond to data from Ref. 3; the point for n=73 has been excluded because it is above the onset8 of chain folding. The inset shows an expanded view of the crossover region of the plot.
Nevertheless, the excellent agreement between the values obtained from Eq. 2 and the values of Ho, et al.3 suggest that the fit values of Tm are close to the true thermodynamic values. This observation leveraged against the fact that Ho, et al.3 also observed a nematic phase for n = 73 (not plotted for the melting temperature data due to the fact that this chain length is above the onset of chain folding), as well as the fact that to the best of our knowledge a nematic phase has not been reported for high molar mass, high (>98 %) regioregularity P3HT,7 strongly suggests that the TIN values are close to their thermodynamic equilibrium values as well. Furthermore, Ho, et al.3 observed a nematic phase for all their low molecular weight P3HT fractions above the crystal melting temperatures; unfortunately, the nematic phase was not stable due to thermal degradation at elevated temperatures and so TIN could not be determined for these materials. Alternatively, if the TIN values were close to the upper bounds on the error estimates, then the temperature window between Tm and TIN would be wide enough to observe the nematic phase in high molar mass, high regioregularity P3HT.
The phase diagram shown in Figure 1 was obtained for 100 % regioregular P3HT, but most available P3HT batches possess lower regioregularity. As such, we first consider the effects of regiodefects on the presence of an isotropic-nematic transition as a function of relative molar mass. The persistence length for P3HT is mostly a function of the backbone deflection angles, because the energetic differences between torsional angles are near kT and barriers in the torsional potentials are relatively small, circa a few kT (where k is Boltzmann’s constant and T is ambient temperature). As a consequence, the persistence length of P3HT can be accurately represented within 10 % using the freely-rotating chain model,2 suggesting a minimal effect of regioregularity. Furthermore, fitting the data of McCulloch et al.,11 with different functional forms suggests that the difference in persistence length between a 93 % and 98 % regioregular P3HT is quite small, i.e., ≈2.3 nm versus ≈2.9 nm, respectively, and hence it can be anticipated2 that TIN will be nearly the same for both regioregularities.
It has been shown, however, that regiodefects are excluded from P3HT crystals thereby reducing the equilibrium melting temperature.12 To examine this effect we derive a thermodynamic relationship that takes into account both relative molar mass as well as the presence of regiodefects. Equation 2 in its simplest interpretation is derived by assuming that the enthalpy ΔHf and entropy of fusion ΔSf are linear functions of n, i.e.,
| (3) |
| (4) |
Broadhurst9 explored the temperature dependence of these relationships; nevertheless, because the simple form of Eq. 2 fits the data well this temperature dependence will be ignored. We note also that Flory and Vrij13 derived a relationship for the entropy of fusion that included a logarithmic term as well; however, the resulting equation for the melting temperature seemed to only fit data up to lengths of n ≈ 100, so we will employ the simpler more tractable form of Eq. 2 that reproduced the equilibrium melting temperature of polyethylene.
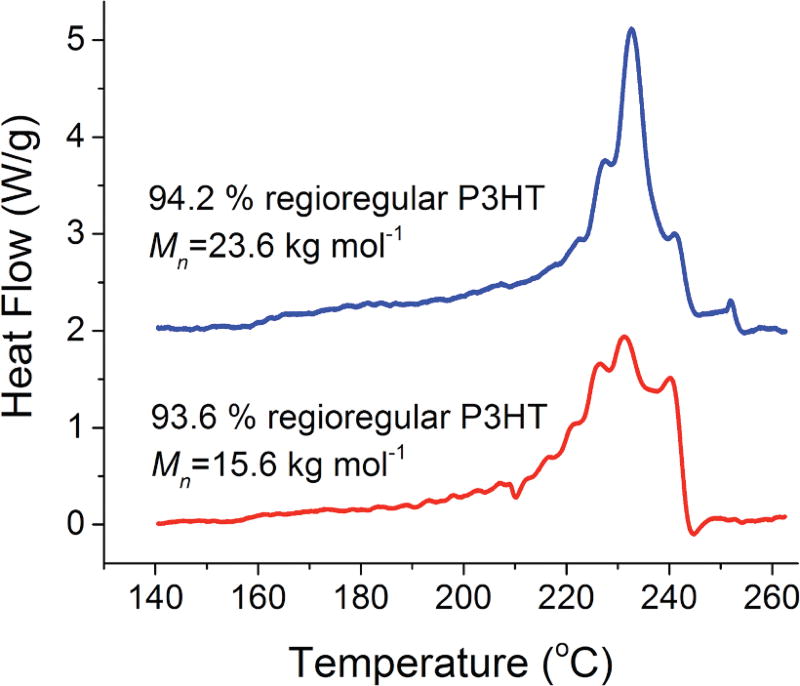
Our derivation loosely follows an approach by Sanchez and Eby;14 however, we assume complete exclusion of the regiodefects and obtain a form similar to Eq. 2 rather than a modification of the Gibbs-Thomson equation. As mentioned earlier, one justification for assuming complete exclusion of head-head regiodefects in P3HT is derived from previous work12 showing the excellent agreement between the results derived from Flory’s copolymer theory15 that assumes complete exclusion and experimental calorimetric data. Additional justification via successive self-nucleation and annealing (SSA) is provided in Fig. 2. SSA is a thermal analysis technique that creates “bins” of crystallizable sequence lengths. The binning is evidenced by a distribution of discrete peaks in the DSC trace, each of which corresponds to a certain range of crystallizable sequence lengths. It has been shown elsewhere8 that for 100 % regioregular fractions with Mn greater than approximately 11.5 kg mol−1 chain folding occurs and hence the resulting DSC traces from SSA lack the distinct peaks and rather appear like typical DSC melting traces. As both fractions are above the chain folding limit, the presence of the distinct peaks indicates that at least a large fraction of the regiodefects are being excluded from the crystal. Thus, because of the agreement with Flory’s copolymer theory and the SSA results, we use the full-exclusion assumption for P3HT.
FIGURE 2.
(color online) Typical differential scanning calorimetry (DSC) traces for 93.6 % and 94.2 % regioregular P3HT fractions obtained via successive self-nucleation and annealing (SSA).
The free energy difference ΔG between an infinitely thick crystal and an equivalent crystal containing a mole fraction (1−p) of monomers (or defects) that will be excluded from the crystal is given by
| (5) |
where ΔG0 = ΔHu − TΔSu. For P3HT, p is the regioregularity (mole fraction of head-tail couplings determined from 1H nuclear magnetic resonance (NMR) spectroscopy). If ΔG is set equal to zero, the equilibrium melting temperature of a crystal with (1−p) non-crystallizable segments is obtained. For a finite size crystal, melting occurs when the bulk crystal free energy ΔG is equal to the (negative) surface free energy ΔGe, or
| (6) |
| (7) |
This equation can then be rearranged to
| (8) |
recognizing that ΔSu can be written as ΔSu = ΔHu/Tm0 the final result is obtained
| (9) |
where, as in the Eq. 2, a≈ ΔHe/ΔHu and b≈ ΔSe/ΔSu. Therefore, the a and b parameters obtained from the 100 % regioregular P3HT can be applied to the regiodefective samples via the above equation. In the limit of n → ∞, Eq. 9 returns Flory’s equation for melting point depression as a function of p.
To demonstrate the validity of this new relationship, we compare the model predictions with melting temperature data obtained on samples of varying regioregularity. In Table 1, we show data from the literature12 on slow-cooled samples of P3HT combined with the SSA results from Fig. 2. The end melting temperature Tm,end, i.e., return to baseline when the last crystals have melted, is used for comparison rather than peak maximum as suggested by Crist16 because it is only the last crystals that melt into a melt with the proper composition of regioregular and regiodefective segments. There is good agreement between the observed and calculated melting temperatures, and differences are well within the estimated uncertainty of the calculated values.
TABLE 1.
Molecular characteristics and observed and calculated (Tm,calc using Eq. 9) melting temperatures for slow cooled regiodefective P3HT samples
| p |
Mn (kg/mol) |
Mw (kg/mol) |
n3σ,corrb |
Tm,end (°C) |
Tm,calcc (°C) |
Ref a |
|---|---|---|---|---|---|---|
| 0.936 | 15.6 | 31.3 | 145 | ≈241 | 245±7d | Fig 2 |
| 0.937 | 55.0 | 120.0 | 1085 | ≈247 | 251±7 | 12a |
| 0.942 | 23.6 | 54.2 | 482 | ≈253 | 250±7 | Fig 2 |
| 0.956 | 51.6 | 138.4 | 1167 | ≈252 | 257±7 | 12a |
Values for regioregularity p, number averaged molar mass Mn, mass averaged molar mass Mw, and Tm,end for indicated samples are taken from Ref. 12.
n3σ,corr is the maximum degree of polymerization defined as a 3σ deviation above Mn (Gaussian distribution assumed) determined from17 σ=Mn(Mw/Mn−1)1/2 and dividing by a factor of 1.3 to correct for the overestimate18 inherent in gel permeation chromatography of P3HT.
Error estimates are the best estimate of 1 standard deviation based on propagation of parameter uncertainties.
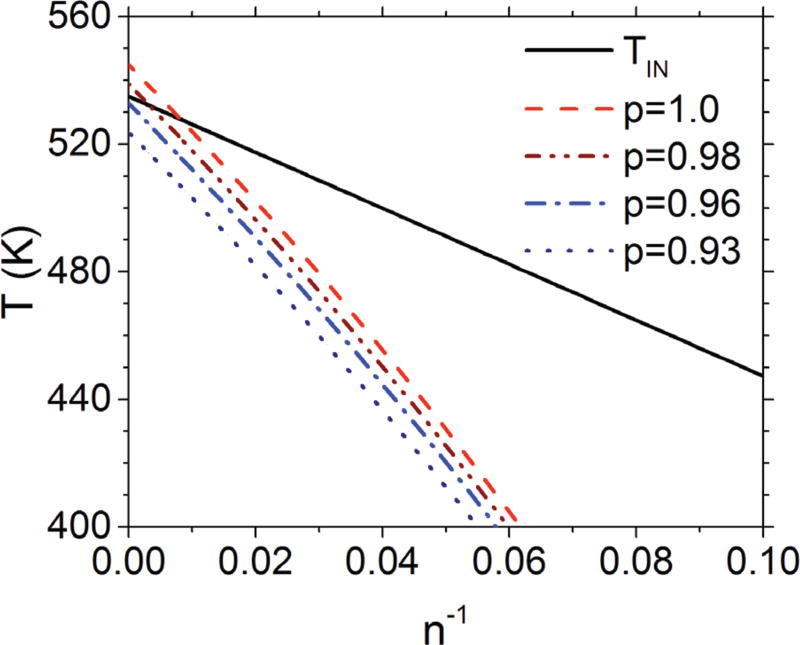
The effect of regioregularity on the crystal melting temperature as a function of molar mass is shown in Figure 3. It is apparent that increasing the regiodefect content increases the temperature range in which the nematic phase will be stable. This helps to reconcile some of the confusion in the literature over the presence of a nematic phase. Whereas, high molar mass, highly regioregular P3HT did not display clear nematic phases, high molar mass, lower regioregular samples seemed to strongly indicate their presence. For example, Hugger, et al.,19 on a sample with a reported relative molar mass of ≈87 kg/mol and a regioregularity of ≈93 %, argued based on X-ray diffraction data for the presence of a liquid crystalline phase at 523 K, consistent with the predictions of Fig. 3.
FIGURE 3.
(color online) Effect of regioregularity on the thermodynamic stability of the nematic-to-isotropic transition in P3HT. The solid line is the theoretical prediction of the nematic-toisotropic transition, the broken lines correspond to the predicted equilibrium crystal melting lines as a function of chain length n and mole fraction of regioregular couplings p determined from Eq. 9 using the values for the a and b parameters employed in Fig. 1. (Error estimates would be similar to that of Fig. 1.)
In closing, we point out that this framework shows the promise of generalization to most semiconducting homopolymers and copolymers exhibiting both liquid crystalline and crystalline phases by combining the tools developed for determining the nematic coupling parameter2 and the thermodynamic framework discussed in this work. Additionally, a similar analysis could be performed for predicting20 the presence of lyotropic liquid crystalline phases that might be encountered upon solution processing due to the melting point depression caused by the presence of a solvent at appropriate concentrations as has been proposed for P3HT.4
EXPERIMENTAL
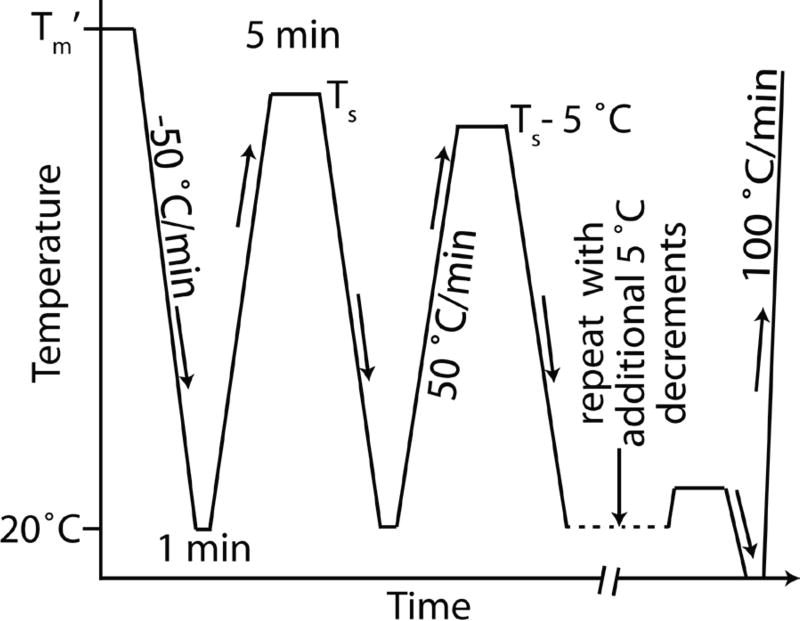
Fractions of regioregular P3HT were obtained from EMD Chemicals21 with molecular characteristics provided by the manufacturer and cited in Table 1. Differential scanning calorimetry (DSC) was performed under a helium purge in a Perkin Elmer DSC8500 equipped with a liquid nitrogen chiller. Temperature calibration was achieved with indium and lead. Measurements were performed in aluminum foil packets of ≈1.9 mg mass, with sample masses of ≈0.85 mg and ≈0.24 mg for the 93.6 % and 94.2 % regioregular fractions, respectively. SSA measurements were performed as described elsewhere8 to yield a maximized distribution of crystallizable sequences. Measurements (not shown) were performed to determine the initial optimal self-seeding temperature Ts.22 Much like polyethylene, due to P3HT’s high nucleation density, it appears that self-seeding is not that influential, so the temperature at which the annealing peak first disappeared was chosen, which was 230 °C for both fractions; the upper melting temperature Tm’ was 265 °C. The thermal analysis profile is given in Figure 4.
FIGURE 4.
Thermal profile for successive self-nucleation and annealing (SSA) process. As indicated in the figure all heating and cooling was performed at 50 °C/min excluding the final heating trace at 100 °C/min that was used to generate the data in Figure 2.
Acknowledgments
E.D.G. acknowledges support from the National Science Foundation under grant no. DMR-1056199.
REFERENCES AND NOTES
- 1.Gemünden P, Poelking C, Kremer K, Andrienko D, Daoulas KC. Macromolecules. 2013;46:5762–5774. [Google Scholar]
- 2.Zhang W, Gomez ED, Milner ST. Macromolecules. 2015;48:1454–1462. [Google Scholar]
- 3.Ho V, Boudouris BW, Segalman RA. Macromolecules. 2010;43:7895–7899. [Google Scholar]
- 4.Park MS, Aiyar A, Park JO, Reichmanis E, Srinivasarao M. J. Am. Chem. Soc. 2011;133:7244–7247. doi: 10.1021/ja110060m. [DOI] [PubMed] [Google Scholar]
- 5.Prosa TJ, Winokur MJ, Moulton J, Smith P, Heeger AJ. Macromolecules. 1992;25:4364–4372. [Google Scholar]
- 6.Pisula W, Zorn M, Chang JY, Mullen K, Zentel R. Macromol. Rapid Commun. 2009;30:1179–1202. doi: 10.1002/marc.200900251. [DOI] [PubMed] [Google Scholar]
- 7.Snyder CR, Kline RJ, DeLongchamp DM, Nieuwendaal RC, Richter LJ, Heeney M, McCulloch I. J. Polym. Sci. Part B Polym. Phys. 2015;53:1641–1653. [Google Scholar]
- 8.Snyder CR, Nieuwendaal RC, DeLongchamp DM, Luscombe CK, Sista P, Boyd SD. Macromolecules. 2014 [Google Scholar]
- 9.Broadhurst MG. J. Chem. Phys. 1962;36:2578–2582. [Google Scholar]
- 10.Koch FPV, Heeney M, Smith P. J. Am. Chem. Soc. 2013;135:13699–13709. doi: 10.1021/ja405792b. [DOI] [PubMed] [Google Scholar]
- 11.McCulloch B, Ho V, Hoarfrost M, Stanley C, Do C, Heller WT, Segalman RA. Macromolecules. 2013;46:1899–1907. [Google Scholar]
- 12.Snyder CR, Henry JS, DeLongchamp DM. Macromolecules. 2011;44:7088–7091. [Google Scholar]
- 13.Flory PJ, Vrij A. J. Am. Chem. Soc. 1963;85:3548–3553. [Google Scholar]
- 14.Sanchez IC, Eby RK. Macromolecules. 1975;8:638–641. [Google Scholar]
- 15.Flory PJ. Principles of Polymer Chemistry. Cornell University Press; Ithaca, New York: 1953. [Google Scholar]
- 16.Crist B. Polymer. 2003;44:4563–4572. [Google Scholar]
- 17.Hiemenz PC. Polymer Chemistry. Marcel Dekker; New York: 1984. [Google Scholar]
- 18.Wong M, Hollinger J, Kozycz LM, McCormick TM, Lu Y, Burns DC, Seferos DS. ACS Macro Lett. 2012;1:1266–1269. doi: 10.1021/mz300333f. [DOI] [PubMed] [Google Scholar]
- 19.Hugger S, Thomann R, Heinzel T, Thurn-Albrecht T. Colloid Polym. Sci. 2004;282:932–938. [Google Scholar]
- 20.Krigbaum WR, Ciferri A. J. Polym. Sci. Polym. Lett. Ed. 1980;18:253–258. [Google Scholar]
- 21.Certain commercial equipment, instruments, or materials are identified in this paper in order to specify the experimental procedure adequately. Such identification is not intended to imply recommendation or endorsement by the National Institute of Standards and Technology, nor is it intended to imply that the materials or equipment identified are necessarily the best available for the purpose.
- 22.Müller AJ, Arnal ML. Prog. Polym. Sci. 2005;30:559–603. [Google Scholar]


