Abstract
Semi- and selective permeability is a fundamentally important characteristic of the cell membrane. Membrane permeability can be determined by monitoring the volumetric change of cells following exposure to a non-isotonic environment. For this purpose, several microfluidic perfusion chambers have been developed recently. However, these devices only allow the observation of one single cell or a group of cells that may interact with one another in an uncontrolled way. Some of these devices have integrated on-chip temperature control to investigate the temperature-dependence of membrane permeability, but they inevitably require sophisticated fabrication and assembly, and delicate temperature and pressure calibration. Therefore, it is highly desirable to design a simple single-cell trapping device that allows parallel monitoring of multiple separate, individual cells subjected to non-isotonic exposure at various temperatures. In this study, we developed a pumpless, single-layer microarray with high trap occupancy of single cells. The benchmark performance of the device was conducted by targeting spherical particles of 18.8 μm in diameter as a model, yielding trap occupancy of up to 86.8% with a row-to-row shift of 10–30 μm. It was also revealed that in each array the particles larger than a corresponding critical size would be excluded by the traps in a deterministic lateral displacement mode. Demonstrating the utility of this approach, we used the single-cell trapping device to determine the membrane permeability of rat hepatocytes and patient-derived circulating tumor cells (Brx-142) at 4, 22 and 37°C. The membrane of rat hepatocytes was found to be highly permeable to water and small molecules such as DMSO and glycerol, via both lipid- and aquaporin-mediated pathways. Brx-142 cells, however, displayed lower membrane permeability than rat hepatocytes, which was associated with strong coupling of water and DMSO transport but less interaction between water and glycerol. The membrane permeability data reported here provide new insights into the biophysics of membrane transport such as aquaporin expression and coupling transport of water and solutes, as well as providing essential data for the ultimate goal of biobanking rare cells and precious tissues.
Graphical abstract
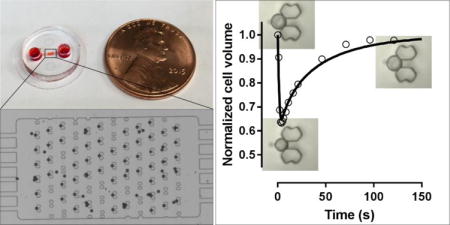
A passive pumping, single-cell trapping microarray was developed to monitor volumetric change of multiple, single cells following hypertonic exposure.
Introduction
The cell membrane regulates the traffic of most biological molecules into and out of the cell due to its semi- and selective permeability. For example, gases such as O2 and CO2 and small, polar but uncharged molecules such as H2O and dimethyl sulfoxide (DMSO) can freely diffuse across the plasma membrane. Compared with passive diffusion, a number of integral membrane pore proteins, known as aquaporins or water channels, can selectively conduct water molecules across the cell membrane even more rapidly.1 Certain aquaporins may also aid the transport of small solutes. For instance, artificially expressed aquaporin-3 in zebrafish (Danio rerio) embryos has been demonstrated to increase the membrane permeability to both water and propylene glycol.2 Ions such as K+ and Cl− and relatively large, polar but uncharged molecules such as glucose are unable to dissolve in the hydrophobic core of the phospholipid bilayer, thereby requiring channel proteins3, 4 and carrier proteins5, respectively, to facilitate the transport across the membrane.2 In contrast, macromolecules such as proteins and polysaccharides typically do not cross intact cell membranes. The rate of transport of molecules across the cell membrane depends on the pressure, concentration and temperature on either side, as well as the membrane permeability to the solvent and solute. Membrane permeability is also used to determine whether water and solute movement occurs through the aquaporins and/or phospholipid bilayers,6 providing valuable insights into the biophysics of transmembrane transport. In addition, membrane permeability is a key parameter for customizing cryopreservation protocols to achieve optimal outcomes for low-temperature preservation of living cells and tissues, given that the osmosis and solute diffusion have significant effects on the introduction of cryoprotective agents (CPAs), removal of CPAs, and the freezing and thawing processes.7–10
The cell membrane permeability is typically determined based on the volumetric change of the cells in response to a non-isotonic environment. For example, when exposed to a hypertonic solution of permeable solutes, cells initially lose and then uptake water due to the osmotic gradient. Simultaneously, there is a constant influx of solutes. The time course of volumetric change due to the water and solute transport can be used to determine the membrane permeability based on existing mathematical models such as the Kedem-Katchalsky (K-K) formalism11. A few methods and techniques have been used to monitor the volumetric change of cells and quantify the transport of water and solutes during the perfusion of non-isotonic solutions. Stopped-flow light scattering has been used to measure the osmotic water and solute transport in a variety of small cells and membrane vesicles.12, 13 The intensity of light scattered from the cells or vesicles provides a measure of volume following exposure of the cells to a gradient of a permeable solute. But such methods are complicated by the dependence of light scattering on non-volume factors including solution refractive index, cell motion, and membrane aggregation.14 Alternatively, an electronic particle counter was used to measure the volumetric change of human spermatozoa when they were transferred into isotonic media after the pre-loading of a permeable solute such as glycerol or DMSO.15 Devireddy et al.16 proposed another method based on differential scanning calorimetry to quantify water transport for human lymphocytes when they were subjected to freezing. The micropipette perfusion technique has been commonly used to determine the membrane permeability of animal and human oocytes to water and CPAs,17, 18 which may suffer from uncontrolled operation-to-operation variability.19
In recent years, several microfluidic perfusion chambers have been developed specifically for the measurement of membrane permeability.19–22 Microfluidic devices offer great advantages such as reduced reagent volume, shortened reaction time, and parallel operation.23 Chen et al.20 developed a microfluidic perfusion chamber to measure the volumetric change of rat basophilic leukemia cells following exposure to hypertonic solutions. As the cell suspension flowed through the chamber, the cells were trapped by a lowered ceiling in the middle of the channel, working as a road obstacle. The distance between the lowered ceiling and the chamber bottom was smaller than the radius of the cells, thereby only allowing the passage of solution. The morphology of immobilized cells was monitored as the perfusion solution was switched to a hypertonic one. A group of cells (usually 10-15) could be trapped along the obstacle edge, but they might interact with each other in an uncontrollable way, since the device was not intrinsically designed to keep trapped cells apart. Similarly, Zhao et al.19 designed a perfusion chamber based on the same principle of “road blocking” and further integrated it with a temperature-controlled stage to specifically measure the osmotic behavior of human oocytes at 4-25°C. The proposed device was not made of polydimethylsiloxane (PDMS), and therefore the fabrication did not require soft lithography and plasma treatment. However, the assembly of multiple components, including the perfusion chamber, temperature controlling element, sealing gasket, and thermocouple may still demand great care. Another integrated microfluidic platform with localized temperature control was also developed to determine the temperature dependence of membrane permeability of human acute lymphoblastic leukemia cells.21 A single cell was trapped in the velocity potential well, which was created by manipulating the stagnation point of the extensional flow. The measurements at 22-37°C were achieved with a wire-patterned microheater. But the fabrication of such a multi-layer PDMS microdevice is complicated and cost-ineffective. To achieve cell trapping and temperature stability, the pressure and temperature must be precisely regulated by additional sensing and controlling modules, which may also need careful assembly and calibration. Although the aforementioned devices made progress in on-chip temperature control, little has been done to improve the multiple, single-cell trapping performance. Indeed, it is highly desirable to design a simple single-cell trapping device that allows parallel monitoring of multiple separate, individual cells subjected to a non-isotonic condition at various temperatures. This necessitates cell immobilization, introduction and exchange of reagents, and live imaging of cell morphology.
In this study, we developed a passive pumping, single-layer microfluidic device for trapping single cells in an array and explored the fluid dynamics mechanism underlying the trapping phenomenon. We used the single-cell trapping device to determine the cell membrane permeability of rat hepatocytes and patient-derived circulating tumor cells (CTCs) on a cryomicroscope for a broad temperature range (i.e., 4, 22 and 37°C). The temperature-dependence of membrane permeability was investigated, shedding light on the roles of lipid- and aquaporin-mediated pathways in governing the transport of water and solutes across the cell membrane.
Materials and Methods
Design and fabrication of the microfluidic device
The single-cell trapping microfluidic device presented in this study features an array of 76-78 butterfly-shaped traps (Figure 1 A). The details of the geometry have been shown in Figure 1 B. The center-to-center distance (W) between the neighboring traps in the same row is 98 μm. The narrowest gap (G) between the neighboring traps in the same row is 48.2 μm. The distance (L) between the adjacent rows is 85 μm. Our preliminary study found that these distances between the neighboring traps were wide enough to prevent clogging caused by pre-formed cell clusters that may have a size of ~40 μm in diameter, while still small enough to allow 12 traps to be monitored in a single 20X microscope field for relatively high-throughput monitoring. Each row is shifted by d from the preceding one. The traps are symmetrical to ensure that in case of accidental backflow the formerly trapped cells will be captured by the nearest trap in the preceding row. Each trap has a 10-μm wide aperture that allows a stream of fluid to pass through, which is essential for immobilizing the trapped cells.
Figure 1.
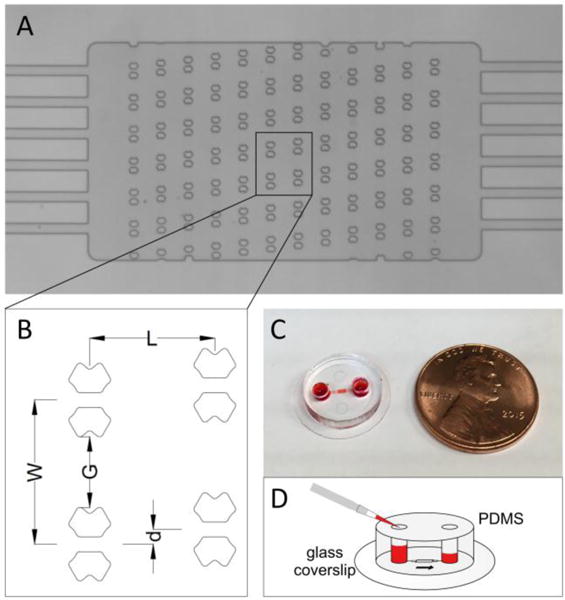
A microfluidic device for arraying single cells. (A) The microarray of the butterfly-shaped traps. Each trap has a central aperture of 10 μm wide. The scale bar is 200 μm. (B) The detailed geometry of the trapping array. (C) The cell trapping microfluidic device is bonded to a glass coverslip (15 mm in diameter). (D) The hydrodynamic pressure drives the fluid flow through the device, which is governed by the height difference between the two fluid columns.
The device was fabricated using standard PDMS soft lithography techniques. A single layer master was fabricated by spin-coating SU-8 negative photoresist (Microchem, Newton, MA) onto a silicon wafer. The coated wafer was patterned using UV photolithography to define the master for the device. The height of SU-8 features was measured to be approximately 33 μm using a surface profilometer (Dektak ST System Profilometer, Veeco Instruments Inc., Plainview, NY). The PDMS prepolymer was mixed with the crosslinker (Dow Corning, Midland, MI) at a ratio of 10∶1 (w/w). The mixture was then poured onto the silicon master mold, degassed, and cured at 65°C overnight. The cured PDMS replica was removed from the mold. Inlet and outlet throughholes were punched out for fluidic connection using a 2.5-mm Harris Uni-Core biopsy puncher (Ted Pella, Inc., Redding, CA). The entire device was punched out by a 12-mm biopsy puncher. The PDMS disc was treated by oxygen plasma at 300 mmTor oxygen at 50 W for 35 s, and then bonded to a 15 mm-diameter glass coverslip to assemble the final microfluidic device (Figure 1 C). The device was designed to fit a Linkam FDCS196 cryostage (Linkam Scientific Instruments Ltd., London, UK) the temperature of which can be controlled from −196 to 120°C with a precision of ±0.1°C.
Benchmark performance of the device to trap monodisperse polystyrene microspheres
Polystyrene microspheres of 18.8±1.2 μm in diameter (Polysciences, Inc., Warrington, PA) were used to evaluate the performance of the trapping device. The suspension of 400,000–500,000 microspheres/ml was made with 1% (v/v) Tween 20 to minimize the aggregation of microspheres. After the device was primed with 1% Tween 20 for 10 min, the two reservoirs were emptied by leaving a thin layer of liquid on the edges at the inlet to prevent the formation of air bubbles and backflow. The microsphere suspension (10 μl) was pipetted into one of the two reservoirs as the inlet, generating a water column of approximately 2 mm high. As illustrated in Figure 1 D, the hydrodynamic pressure generated by the height difference between the fluid columns on the reservoirs drives the fluid flow. The number of occupied traps was counted every minute. The fluid flow usually becomes insignificant after the microsphere suspension was loaded for 5 min based on the balance of hydrodynamic pressure applied at the inlet and outlet.
Isolated rat hepatocytes and Brx-142 cells
The freshly isolated rat hepatocytes used in this study were acquired from the Cell Resource Core at Massachusetts General Hospital. The cells were delivered to the lab within 30 min after isolation. The viability of the cells was determined to be 91-93% by the trypan blue exclusion method. The osmosis experiments were accomplished within 2.5 hr after isolation and the cells suspended in the C+H isolation media24 were kept on ice constantly before they were loaded into the device. Brx-142 cells are primary circulating tumor cells derived from the peripheral blood of a metastatic breast cancer patient at Massachusetts General Hospital. These cells were routinely passaged in tumorsphere medium under hypoxic conditions (5% O2 and 5% CO2) as described in the literature.25
Determination of membrane permeability of isolated rat hepatocytes and Brx-142 cells
When exposed to a hypertonic solution of a permeable CPA, cells initially lose and then uptake water due to the change in osmotic gradient, accompanied by a constant influx of CPA. Thus, cell morphology undergoes a shrink-and-swell behavior. The volumetric change as a function of time is used to determine the cell membrane permeability based on the K-K formalism.11, 26
| (1) |
| (2) |
In the above formalism, V is the cell volume, A the surface area and the content of intracellular CPA. is the hydraulic conductivity and the membrane permeability to CPA. is the reflection coefficient within a range of 0 to , where is the partial molar volume of CPA. is equal to when the CPA and water transport across membranes are via independent pathways, for example, water via aquaporins and CPA via lipid bilayer diffusion. R is the gas constant and T the absolute temperature. m is the osmolality, with the superscripts denoting intracellular (i) and extracellular (e) and the subscripts denoting non-permeating salts (s) and permeating CPA (c), respectively. and where is the isotonic cell volume, the osmotically inactive volume and the isotonic salt concentration. Both the isolated rat hepatocytes and Brx-142 cells are spherical and have a diameter of about 20 μm. Therefore, the cell volume was calculated based on the two-dimensional cross section area measured using ImageJ (National Institutes of Health, Bethesda, MD). Lp, Pc, and σ are the three parameters to be optimized, such that the simulation profile can best-fit the experimental shrink-and-swell curve. The nonlinear best-fitting procedure was conducted using Matlab (The MathWorks, Inc., Natick, MA).
In the osmosis experiments, the cells that had been trapped in the device were exposed to 10% (v/v) DMSO or 10% (v/v) glycerol solution, two of the most commonly used cryoprotective formulations. In detail, the cell suspension was filtered through a 30-μm pre-separation filter (Miltenyi Biotec Inc., San Diego, CA) to remove large cell clumps before it was loaded into the device. Most liquid (1X phosphate-buffered saline, PBS) in the two reservoirs had been removed after degassing. The cells were loaded into the device by adding 10 μl cell suspension (200,000–300,000 cells/ml) into one of the two reservoirs as the inlet. As soon as we could locate 6–10 single cells being trapped in a single 20X microscope field, the reservoirs were emptied by leaving a tiny amount of liquid on the edges at both reservoirs. The device was then placed onto the Linkam FDCS196 cryostage and equilibrated with the set temperature (4, 22, or 37°C) for 3–5 min. 10 μl CPA solution that had been equilibrated at the set temperature was added into the inlet reservoir. The volumetric change of the cells during the perfusion of the CPA solution was recorded at 2 fps using a PixeLINK PL-A662 camera (PixeLINK, Ottawa, Canada) coupled with the Linksys 32 software. The experiment was duplicated or triplicated, such that a total of 6–18 cells were analyzed for each condition.
To estimate the osmotically inactive volume ( ), the cells were equilibrated with a series of hypertonic solutions and the equilibrium volume was determined. The hypertonic solutions (350, 453, 574, 981, 1579, 2191 mOsm/kg) were prepared by dissolving appropriate amounts of non-permeable trehalose dihydrate in 1X PBS. The osmolality ( ) of the prepared solutions was measured by a vapor pressure osmometer (Model 5520, Wescor, Inc., Logan, UT). The cells were loaded into the device as described previously. The liquid in the two reservoirs was then removed and 10 μl hypertonic solution was added into the inlet to perfuse the chamber at 22°C. The equilibrium morphology of the cells in the hypertonic solution was captured after 2 min perfusion. The osmotically inactive volume fraction ( ) can be determined as the y-intercept based on the Boyle-van’t Hoff equation.
| (3) |
where is the isotonic osmolality and is the isotonic volume of water in the cell.
Results and Discussion
Benchmark trapping performance
Microspheres of 18.8±1.2 μm in diameter were used since they have a similar size to rat hepatocytes and Brx-142 cells investigated in this study. The microspheres were introduced into the array through a branching channel. A particle following a streamline that goes through the aperture of a trap will be immobilized, provided its diameter is greater than the trap aperture. Examples of trapped particles and particles that bypassed the traps are indicated by the black and white arrows, respectively, in Figure 2 A–C. In this study, we investigated the trapping performance with a range of row-to-row shifts from 3 to 49 μm. This shift is the transverse distance between a pair of traps, where the downstream in the pair is shifted to the left, when viewed in the direction of flow, as in a traditional deterministic lateral displacement (DLD) array. Here we attempt to optimize the occupancy of the traps rather than the trapping efficiency for each particle introduced into the array, as cells are rarely limiting for this application. Trap occupancy was calculated as the proportion of traps that were occupied by the microsphere(s). Overall, arrays of d=10-30 μm gave rise to the highest trap occupancy of approximately 85%, whereas those of d=3-7 μm and 49 μm resulted in significantly lower trap occupancy (Figure 2 D). For example, 86.8% of traps in the array of d=15 μm were filled with microspheres, compared with 12.7% in the array of d=3 μm. To improve the performance of single-particle trapping, the trap geometry and the chamber height (33 μm) were customized such that once the trap is occupied by a single particle of ~20 μm in diameter, any other particles of similar sizes cannot be accommodated. In addition, as the aperture of an occupied trap is occluded, the streamlines that go through the aperture are reduced, thereby decreasing the probability of particles entering the occupied trap. One may observe that some of the traps were occasionally filled with a particle cluster (Figure 2 B and C). These aggregations of particles were likely formed either before introduction into the array, or via non-specific binding following particle-particle interaction that occurred within the array.
Figure 2.
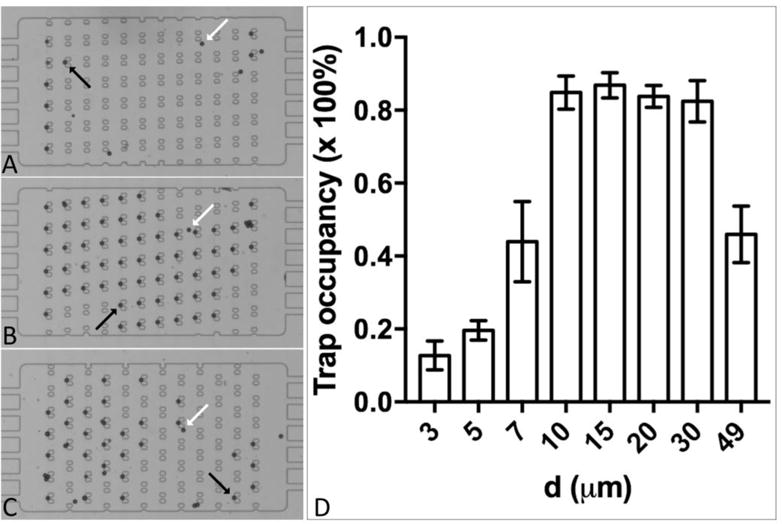
Immobilization of microspheres (18.8±1.2 μm in diameter) by the traps in the array. A: d=3 μm; B: d=10 μm; C: d=49 μm. Black arrows indicate trapped microspheres, and white arrows indicate those that pass by the traps. D. The occupancy rate of the traps in the arrays that vary in d from 3 to 49 μm.
To uncover the mechanism of particle trapping in the proposed array, we conducted a series of computational fluid dynamics (CFD) simulations using ANSYS Fluent (Ansys Inc., Canonsburg, PA). It is evident that any particles smaller than the aperture width ( ) cannot be trapped, regardless of whether the streamlines they follow go through the apertures. Simulation results indicate that a particle of D> (D is the diameter of the particle) will be successively deflected to the neighboring fluid stream once it contacts the edge of the trapping obstacle in a DLD mode (Figure 3 A).27, 28 Therefore, the traps in a given array only capture particles that are larger than but smaller than the corresponding , and the traps will not be filled by any particles larger than , except in the first row of traps where the bumping mechanism has yet to begin. Figure 3 B shows that the size of the microspheres investigated here (i.e., D=18.8±1.2 μm) are much larger than the critical diameters generated by the arrays of d=3-7 μm. Thus, the traps in these arrays cannot be occupied by the ~20 μm-diameter microspheres. Thus, the overall trap occupancy observed in the arrays of d=3-7 μm is expected to be low, in agreement with the range of 12.7%-43.9% observed (Figure 2 D). In these arrays, the microspheres were mainly trapped in the first or last row, or at locations close to the boundaries (Figure 2 A) where the DLD mode is compromised or the actual critical diameter in these locations may be larger than D due to the boundary effect. The arrays of d=10–30 μm have critical diameters that are close to or exceed the size range 17.6-20 μm (Figure 3 B), indicating that the traps in these arrays are capable of capturing the microspheres under investigation. As predicted, we observed high trap occupancy of ~85% for the arrays of d=10–30 μm (Figure 2 D). Nevertheless, filling a trap relies on the particle to follow the streamline that goes through the aperture, which requires that particles are well distributed across the width of the inlet flow, and that enough particles enter the array to avoid stochastic filling. As we loaded a limited amount particle suspension, and settling is a possibility, there is a chance that some of the traps will not be filled within a limited loading time even if they would ultimately be filled. In the array of d=49 μm, where the row-to-row shift factor ε(=d/W) is 0.5, there is no deterministic lateral displacement because the calculated is larger than the gap between two trapping obstacles (G). Instead, the occupancy of traps in this array is size-independent and simply governed by the probability of the particles following the streamlines that go through the trap apertures located in the first and second rows, thereby resulting in a significantly decreased trap occupancy for d=49 μm compared with d=10–30 μm (Figure 2 D).
Figure 3.
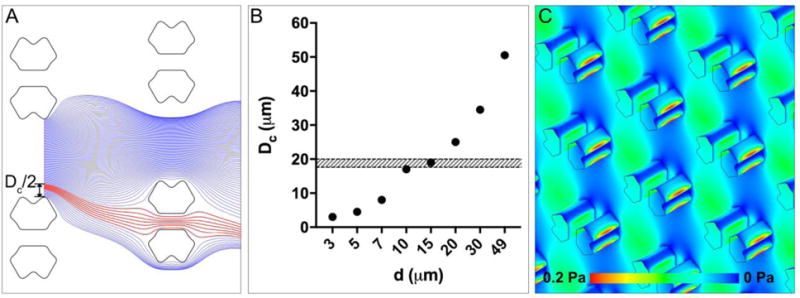
The streamline orientation, basic principle, and shear stress of the trapping-DLD hybrid. (A) Top view diagram of streamlines in flow between two trapping obstacles (d=10 μm), demonstrating that any particles having a radius larger than /2 must be deflected by the trapping obstacle once it contacts the obstacle edge. The blue streamlines pass by the trap whereas the red ones go through it. (B) The critical diameter corresponding to the trapping obstacle located in the center of the array increases as the row-to-row shift (d) increases. The shaded-belt represents the size range of the microspheres used in this study (i.e., 17.6–20 μm). (C) The shear stress distribution within the array of d=10 μm, demonstrating a minimal shear stress of ≤0.2 Pa.
Our simulation results also revealed that the shear stress under the hydrodynamic pressure is minimal. For example, the shear stress is no more than 0.2 Pa throughout the array of d=10 μm (Figure 3 C). Such minimal shear stress may make the device suitable for long-term on-chip culturing and/or analysis of living cells with precise positioning.
Membrane permeability to water and CPA
The rat hepatocyte is a valuable in vitro model for drug identification and investigating time-dependent drug metabolism, enzyme activity and drug-drug interactions.29 Circulating tumor cells (CTCs) present in the bloodstream of patients with cancer provide a non-invasive source for detection, characterization, and monitoring of non-hematological cancers.30 Determination of the osmotic properties of these cells is fundamentally important for research in related areas such as biobanking of hepatocytes for toxicity testing and drug screening and live circulating tumor cells for personalized medicine. The cells investigated in this study were equilibrated with a series of hypertonic solutions to determine the osmotically inactive volume fraction ( ). The normalized equilibrium cell volume ( ) was plotted as a function of (Figure 4). The is determined as the y-intercept of the Boyle-van’t Hoff plot. The osmotically inactive volume fraction of isolated rat hepatocytes was determined to be 0.41±0.02 and the Brx-142 cells have a of 0.36±0.02.
Figure 4.
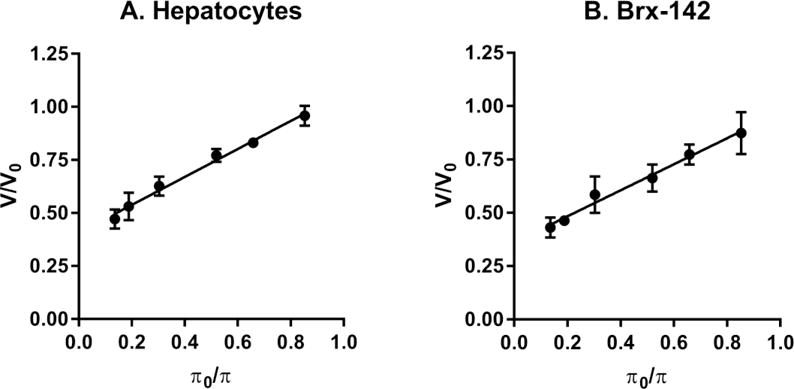
Normalized volume of isolated rat hepatocytes (A) and Brx-142 cells (B) when they are in equilibration with a series of hypertonic solutions. The function = is described by the Boyle-van’t Hoff relation to determine the osmotically inactive volume fraction. (A: =0.6587 +0.4061 ( =0.99) and B: =0.6103 +0.3611 ( =0.9853))
When the cells are exposed to a hypertonic solution of a permeable CPA such as DMSO or glycerol, the higher extracellular osmolality drives the efflux of intracellular water, resulting in the initial shrinkage of the cells. Meanwhile, there is a constant influx of CPA into the cells due to the CPA concentration gradient across the cell membrane. The water loss and CPA uptake by the cells will reverse the osmotic gradient across the cell membrane when the cells experience the maximum shrinkage. Then, the reversed osmotic gradient will lead to an influx of water into the cells, causing the cellular swelling. Overall, the cells undergo a shrink-and-swell behavior in response to the exposure to a hypertonic solution of a permeable solute. The shrink-and-swell behavior of the cells following exposure to the hypertonic CPA solution was analyzed to determine the membrane permeability parameters based on the K-K formalism. Figure 5 shows the representative morphologies of rat hepatocytes associated with the isotonic condition (A and D), the maximum shrinkage (B and E), and swelling towards the equilibrium volume (C and F) when the cells were exposed to 10% glycerol. The volumetric changes of rat hepatocytes when exposed to 10% DMSO and 10% glycerol at various temperatures is presented in Figure 6. Within the monitoring period (up to 200 seconds) the cells swelled to the equilibrium volume after a brief (only 2-8 seconds) but significant shrinkage (the maximum decrease in volume ranging from 20% to 45% of the isotonic volume). Generally, when hepatocytes were exposed to either DMSO or glycerol, increased temperatures led to less shrinkage, faster swelling, and more rapid equilibration. For example, the minimum normalized volume of hepatocytes when exposed to 10% DMSO was 67.2%, 72.4% and 78.7% at 4, 22 and 37°C, respectively. Correspondingly, the equilibration time to the hypertonic environment decreased from about 200 to 30 seconds as the temperature was elevated. But in the case of the transport of water and glycerol at 4°C, the cells had not reached equilibrium after approximately 2.5 min, which indicates a relatively slow permeation of glycerol across the membrane mainly due to the low temperature and the CPA type. We also investigated the volumetric changes of Brx-142 cells when they were exposed to 10% DMSO and 10% glycerol at various temperatures. Interestingly, these cells did not reach their equilibrium with the hypertonic condition within the monitoring period except for the 37°C exposure, in which the movement of water and solute molecules was accelerated due to the relatively high temperature. The prolonged equilibration time (Figure 7) suggests that the membrane of Brx-142 cells is less permeable to water and solute (DMSO or glycerol) than those of rat hepatocytes. However, the effect of temperature on the water and solute permeation was similar to that observed for rat hepatocytes: generally, for a given solute the elevated temperature contributed to less shrinkage and more rapid swelling.
Figure 5.
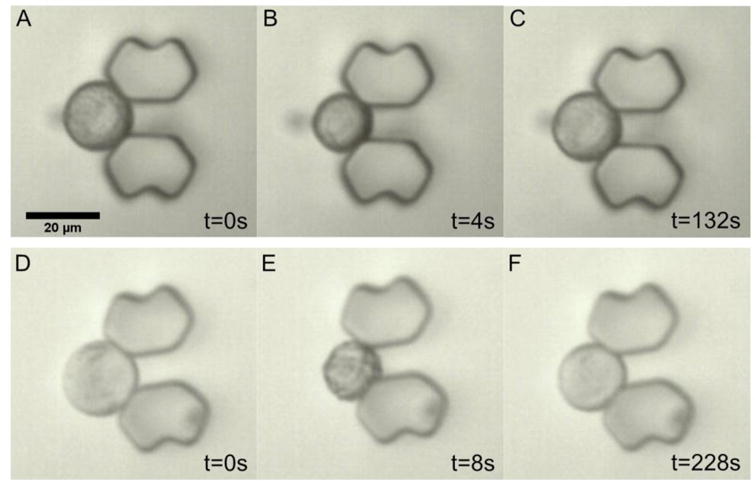
Shrink-and-swell behavior on exposure to glycerol. (A–C) The morphological change of a trapped hepatocyte cell when it is exposed to 10% glycerol at 22°C (A: isotonic condition, B: 4s after being exposed to 10% glycerol, and C: 132s after being exposed to 10% glycerol). (D–F) The morphological change of a trapped Brx-142 cell when is exposed to 10% glycerol at 22°C (D: isotonic condition, E: 8s after being exposed to 10% glycerol, and C: 228s after being exposed to 10% glycerol). Scale bar represents 20 μm.
Figure 6.
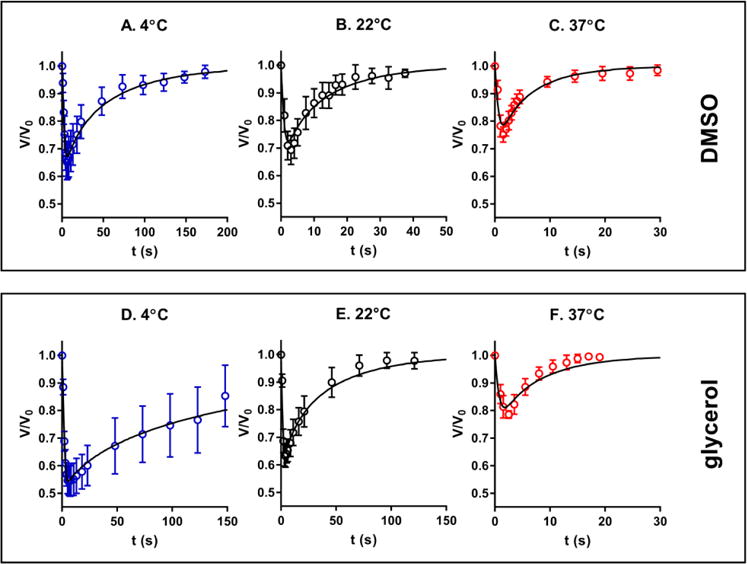
Volumetric changes of the isolated rat hepatocytes upon exposure to 10% DMSO (A–C) and 10% glycerol (D–F) at temperatures of 4, 22 and 37°C, respectively. (n=6–18)
Figure 7.
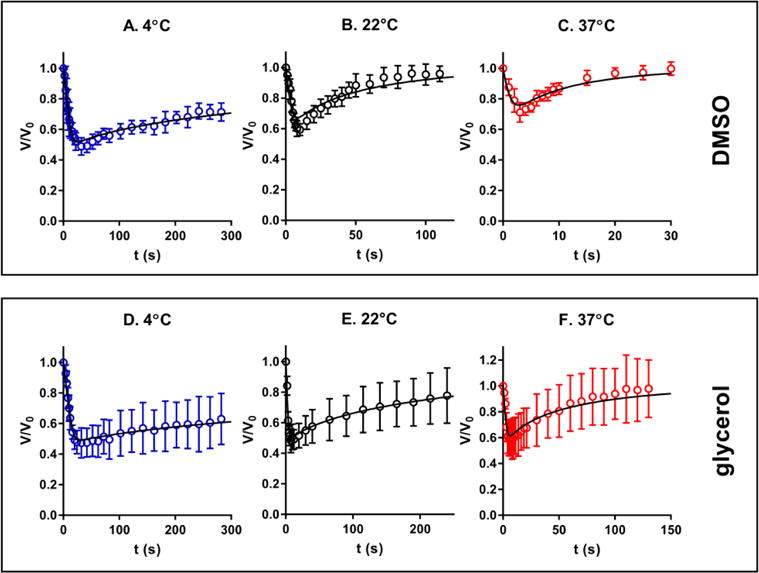
Volumetric changes of the Brx-142 cells upon exposure to 10% DMSO (A–C) and 10% glycerol (D–F) at temperatures of 4, 22 and 37°C, respectively. (n=6–18)
The values of and for isolated rat hepatocytes and Brx-142 cells are listed in Table 1 and 2, respectively. For certain conditions (i.e., 4°C for glycerol in Table 1 and 4°C for glycerol and DMSO and 22°C for glycerol in Table 2), the reflection coefficient obtained from the optimization algorithm was very close to 1, as a constraint of 0<σ<1 was set in our optimization procedure, implying that σ may have a value of . Therefore, we replaced the original constraint (0<σ<1) with = in the optimization procedure such that we only optimized the values of and in the aforementioned conditions. The corresponding simulation curves based on the optimized and and calculated agree well with the experimental data points with >0.97, suggesting our assumption is valid.
Table 1.
Membrane permeability of isolated rat hepatocytes to water ( ) and CPA ( ) at various temperatures
| CPA | T | (μm/atm/min) | (μm/min) |
|
|
||
|---|---|---|---|---|---|---|---|
| DMSO | 4°C | 1.11±0.23 | 7.70±0.05 | 0.581±0.081 | 0.979 | ||
| 22°C | 3.85±1.42 | 26.52±0.19 | 0.401±0.001 | 0.980 | |||
| 37°C | 6.45±1.94 | 50.24±12.97 | 0.272±0.017 | 0.979 | |||
| Glycerol | 4°C | 0.94±0.10 | 2.27±0.01 | 0.993 | 0.993 | ||
| 22°C | 1.55±0.57 | 11.27±0.18 | 0.686±0.151 | 0.979 | |||
| 37°C | 3.44±2.49 | 69.35±11.41 | 0.410±0.154 | 0.944 |
Table 2.
Membrane permeability of Brx-142 cells to water ( ) and CPA ( ) at various temperatures
| CPA | T | (μm/atm/min) | (μm/min) |
|
|
||
|---|---|---|---|---|---|---|---|
| DMSO | 4°C | 0.19±0.01 | 0.61±0.01 | 0.990 | 0.990 | ||
| 22°C | 0.87±0.30 | 6.14±0.03 | 0.487±0.104 | 0.980 | |||
| 37°C | 3.65±2.61 | 22.41±9.57 | 0.262±0.095 | 0.983 | |||
| Glycerol | 4°C | 0.18±0.02 | 0.24±0.01 | 0.996 | 0.996 | ||
| 22°C | 0.62±0.05 | 1.19±0.15 | 0.994 | 0.994 | |||
| 37°C | 0.82±0.22 | 6.94±0.16 | 0.763±0.142 | 0.976 |
Temperature dependence of membrane permeability
The temperature dependence of membrane permeability can be evaluated by the following Arrhenius equations. Table 3 shows the values of and , ranging from 6.6 to 18.7 kcal/mol, which agree with the typical values that were observed for other types of cells. For example, murine primary neural brain cells have a of 6.02 kcal/mol and of 26.45 kcal/mol associated with DMSO exposure.31 Human corneal endothelial cells have a of 16 kcal/mol and of 15.9 kcal/mol when they are exposed to DMSO.32
| (4) |
| (5) |
where and are the activation energies for water and CPA, respectively. and are permeability at the reference temperature .
Table 3.
Activation energy ( ) of and for rat hepatocytes and Brx-142 cells, respectively
| Cell | CPA | (kcal/mol) | (kcal/mol) |
|---|---|---|---|
| Hepatocyte | DMSO | 9.2±1.4 | 9.8±0.9 |
| Glycerol | 6.6±1.4 | 17.5±2.1 | |
| Brx-142 | DMSO | 15.2±0.9 | 18.7±1.4 |
| Glycerol | 8.1±2.2 | 17.3±1.9 |
Mechanisms of transport of water and CPA across the plasma membrane
For a given solute at a given temperature, the membrane permeability of isolated rat hepatocytes to water (in a range of 0.94-6.45 μm/atm/min) is about 2-5 times the of the Brx-142 membrane which was calculated to be within the range of 0.18-3.65 μm/atm/min in this study. The of the rat hepatocyte membrane was also found to be larger than the values reported for other types of cells when they were exposed to solutes of a similar molecular size. For example, the of human oocytes was estimated to increase from 0.41 μm/atm/min at 10°C to 1.92 μm/atm/min at 30°C in the presence of 1.5 M propylene glycol.33 The of human placental/umbilical cord blood CD34+ cells was only 0.15 μm/atm/min at 22°C in the presence of 1 M DMSO.34 The trans-plasma-membrane transport of water is conducted by diffusion through lipid bilayers and/or by penetration through aquaporin water channels. Aquaporins are a family of integral membrane proteins that facilitate rapid movement of water in response to osmotic gradients and thus increase the cell membrane permeability to water.1, 35 The high membrane water permeability of rat hepatocytes determined in our study suggests that aquaporins are involved in the water transport across the hepatocyte membrane. Our hypothesis is supported by the characterization of multiple types of aquaporins on the rat hepatocyte membrane. Huebert et al.36 found that the transcripts of three aquaporins (AQP0, AQP8 and AQP9) played an important role in bile secretion using reverse transcription-polymerase chain reaction and quantitative ribonuclease protection assays on rat hepatocytes. Marinelli et al.37 further demonstrated that the basolateral and canalicular water movement across the rat hepatocyte plasma membrane was regulated by both the phospholipid bilayer and aquaporins.
The values of activation energy shown in Table 3 provide us with further evidence for the role of aquaporins in water transport across the rat hepatocyte membrane. is generally ≥10 kcal/mol for water movement via a lipid solubility-diffusion mechanism, whereas an of less than 6 kcal/mol indicates water movement through aquaporins.37, 38 for rat hepatocytes in the presence of glycerol was found to be 6.6 kcal/mol in our study, indicating that the trans-plasma-membrane transport of water should at least be mediated by both the lipid bilayer and aquaporins, if not by aquaporins alone. However, it was observed that the for rat hepatocytes exposed to DMSO was 9.2 kcal/mol, close to the cut-off value of 10 kcal/mol. Previous studies have established a role for DMSO as a water channel blocker,39, 40 and DMSO was previously used to inhibit aquaporins on rat hepatocyte membranes.41, 42 DMSO may significantly inhibit the aquaporins present on the hepatocyte membrane in our study, thereby contributing to a relatively large which is apparently close to 10 kcal/mol.
The small (<< ) obtained for the transport of water and DMSO across the hepatocyte membrane (Table 1) indicates strong interactions between water and solute within the transport pathways. As the temperature was elevated, the transport of water and glycerol across the hepatocyte membrane became increasingly coupled, as indicated by the decrease of from 0.993 to 0.410 (Table 1). This suggests that the interactions between water and solute can occur in both the lipid matrix and water channels. In fact, AQP9, expressed in rat hepatocyte plasma membranes, has an unusually broad solute permeability and is permeable to glycerol and certain small, uncharged solutes.43 In part due to such facilitation by water channels, we observed relative high membrane permeability to DMSO and glycerol for rat hepatocytes (2.27-69.35 μm/min as seen in Table 1), which are actually comparable to those for human corneal cells (including endothelial, keratocyte, and epithelial cells). Human corneal cells were found to have within the range of 1.41-57.47 μm/min for DMSO and 1.57-92.63 μm/min for propylene glycol, respectively.32
The permeability of Brx-142 cell membranes to water and CPA was not significantly different from the values for other types of cells previously reported in the literature. For example, and of Brx-142 cells when exposed to 10% DMSO at 22°C were 0.87 μm/atm/min and 6.14 μm/min respectively, while Gilmore et al.15 reported that human spermatozoa had a of 0.84 μm/atm/min and of 8 μm/min when exposed to 1 M DMSO at the same temperature. However, the associated reflection coefficient for Brx-142 was 0.487, much larger than that calculated for human spermatozoa ( =0.98). This suggests that although the permeation rates of water and DMSO are similar, the transport mechanisms can be different, with Brx-142 cells significantly utilizing coupled transport of water and solute. When Brx-142 cells are exposed to 10% glycerol at 22°C, they have a of 0.62 μm/atm/min and of 1.19 μm/min. While the of Brx-142 is close to that of human spermatozoa (0.77 μm/atm/min)15, the permeability of Brx-142 cells to glycerol (1.19 μm/min) is significantly lower (compared with 21 μm/min for human spermatozoa)15. However, the corresponding reflection coefficients for both cell types are similar (0.994 versus 0.93), indicating no coupling of water and solute transport. Based on the values of the reflection coefficient shown in Table 2, there is little or no interaction between water and glycerol as they permeate the membranes of Brx-142 cells at the temperatures investigated, since is either equal to or close to . When Brx-142 cells were exposed to DMSO, the interaction became pronounced at elevated temperatures (22 and 30°C) though the transport of water and DMSO was not coupled at 4°C.
The associated with glycerol (8.1 kcal/mol) suggests that there might be a small number of water channels involved in the transport of water, as between 6 and 10 kcal/mol could be due to a relatively low number of water channels present in the lipid matrix, or water movement through narrow channels in which significant interactions can occur.37 The value associated with DMSO (15.2 kcal/mol), however, indicates that the transport of water and DMSO across the Brx-142 cell membrane occurs mainly through the lipid bilayer matrix. Similar to the observation for rat hepatocytes, this suggests that DMSO may inhibit aquaporins such that is apparently increased.
Biological characterization of rare CTCs has potential clinical value for non-invasive detection and clinical management of cancer.44 But the understanding of these rare cells is far from comprehensive. Exploration of the osmotic behavior of CTCs may provide valuable insights into the presence of aquaporins within their membranes and the interaction between aquaporins and chemicals, which may aid the discovery of aquaporin inhibitors as novel anti-cancer drugs.45, 46 Furthermore, the findings in this study will contribute to the development of cryopreservation protocols for the biobanking of patient-derived CTCs in a variety of precision medicine and drug screening applications.
Summary and Outlook
In this study, we developed a passive pumping, single-layer microarray for trapping separate, single cells with a minimal shear stress of ≤0.2 Pa and a loading volume of 10 μl. When targeting microspheres of 18.8±1.2 μm in diameter as a model, the row-to-row shift (d) of 10-30 μm was found to achieve trap occupancy of up to 86.8%. We used the developed device to determine the membrane permeability of rat hepatocytes and patient-derived circulating tumor cell lines (Brx-142) at 4-37°C. While the membranes of isolated rat hepatocytes were found to be highly permeable to water and small molecules such as DMSO and glycerol, our results suggested that water and solute were transported across membranes via both lipid layers and aquaporins. However, Brx-142 cells displayed lower membrane permeability than rat hepatocytes, which was associated with strong coupling of water and DMSO transport but less interaction between water and glycerol.
Compared to other microfluidic devices for membrane permeability determination, our device is relatively high throughput (i.e., simultaneously imaging 6-10 single cells in this study), less sophisticated in design and fabrication, and requires inexpensive materials and minimal experimental setup. Working as a trapping-DLD hybrid, our device can deflect any particles larger than the critical size while be occupied by particles that have a diameter smaller than but larger than . By adjusting d and , the device can be customized to accommodate cells of different sizes other than ~20 μm. Our device is also pumpless and driven by gentle hydrodynamic pressure, thereby exerting minimal stress on the cells, which makes it suitable for long-term on-chip culturing and/or analysis of living cells. Although the heterogeneity of membrane permeability among individual cells is not the primary focus of the current study, our single-cell trapping device, with proper scaling-up, has the potential to provide statistically rich single-cell data from many cells for calculating the distribution of the physical or chemical states that each cell may occupy.
Figure 8.
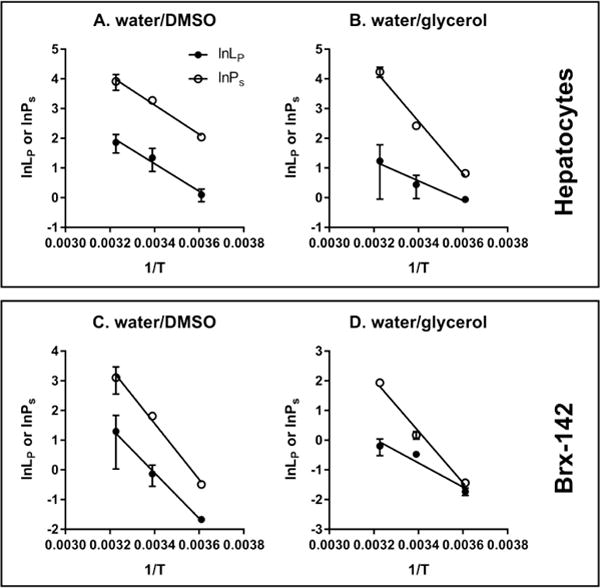
The temperature dependence of membrane permeability of isolated rat hepatocytes (A and B) and Brx-142 (C and D) to water and CPA.
Acknowledgments
We are grateful to Octavio Hurtado and Dr. Maedeh Heidarpour for microfabrication assistance. We thank Gloria Lee for providing guidance on using the osmometer. This work was financially supported by NIH P41 EB002503 (MT).
Footnotes
Conflicts of Interest
There are no conflicts of interest to declare.
References
- 1.Borgnia M, Nielsen S, Engel A, Agre P. Annu Rev Biochem. 1999;68:425–458. doi: 10.1146/annurev.biochem.68.1.425. [DOI] [PubMed] [Google Scholar]
- 2.Hagedorn M, Lance S, Fonseca D, Kleinhans F, Artimov D, Fleischer R, Hoque A, Hamilton M, Pukazhenthi B. Biol Reprod. 2002;67:961–966. doi: 10.1095/biolreprod.101.002915. [DOI] [PubMed] [Google Scholar]
- 3.Jiang Y, Lee A, Chen J, Ruta V, Cadene M, Chait BT, MacKinnon R. Nature. 2003;423:33–41. doi: 10.1038/nature01580. [DOI] [PubMed] [Google Scholar]
- 4.Dutzler R, Campbell EB, Cadene M, Chait BT, MacKinnon R. Nature. 2002;415:287–294. doi: 10.1038/415287a. [DOI] [PubMed] [Google Scholar]
- 5.Gould GW, Holman GD. Biochem J. 1993;295:329. doi: 10.1042/bj2950329. [DOI] [PMC free article] [PubMed] [Google Scholar]
- 6.Preston GM, Agre P. Science. 1992;256:385. doi: 10.1126/science.256.5055.385. [DOI] [PubMed] [Google Scholar]
- 7.Mazur P. J Gen Physiol. 1963;47:347–369. doi: 10.1085/jgp.47.2.347. [DOI] [PMC free article] [PubMed] [Google Scholar]
- 8.Mazur P. Am J Physiol Cell Physiol. 1984;247:C125–C142. [Google Scholar]
- 9.Weng L, Li W, Zuo J. Cryobiology. 2010;61:194–203. doi: 10.1016/j.cryobiol.2010.07.004. [DOI] [PubMed] [Google Scholar]
- 10.Weng L, Li W, Chen C, Zuo J. J Phys Chem B. 2011;115:14721–14731. doi: 10.1021/jp2054348. [DOI] [PubMed] [Google Scholar]
- 11.Kedem O, Katchalsky A. Biochim Biophys Acta. 1958;27:229–246. doi: 10.1016/0006-3002(58)90330-5. [DOI] [PubMed] [Google Scholar]
- 12.Verkman A, Ives HE. Am J Physiol Renal Physiol. 1986;250:F633–F643. doi: 10.1152/ajprenal.1986.250.4.F633. [DOI] [PubMed] [Google Scholar]
- 13.Worman HJ, Brasitus TA, Dudeja PK, Fozzard HA, Field M. Biochemistry. 1986;25:1549–1555. doi: 10.1021/bi00355a014. [DOI] [PubMed] [Google Scholar]
- 14.Chen PY, Pearce D, Verkman AS. Biochemistry. 1988;27:5713–5718. doi: 10.1021/bi00415a048. [DOI] [PubMed] [Google Scholar]
- 15.Gilmore J, McGann L, Liu J, Gao D, Peter A, Kleinhans F, Critser J. Biol Reprod. 1995;53:985–995. doi: 10.1095/biolreprod53.5.985. [DOI] [PubMed] [Google Scholar]
- 16.Devireddy RV, Raha D, Bischof JC. Cryobiology. 1998;36:124–155. doi: 10.1006/cryo.1997.2071. [DOI] [PubMed] [Google Scholar]
- 17.Gao D, McGrath J, Tao J, Benson C, Critser E, Critser J. J Reprod Fertil. 1994;102:385–392. doi: 10.1530/jrf.0.1020385. [DOI] [PubMed] [Google Scholar]
- 18.De Santis L, Coticchio G, Paynter S, Albertini D, Hutt K, Cino I, Iaccarino M, Gambardella A, Flamigni C, Borini A. Hum Reprod. 2007;22:2776–2783. doi: 10.1093/humrep/dem240. [DOI] [PubMed] [Google Scholar]
- 19.Zhao G, Zhang Z, Zhang Y, Chen Z, Niu D, Cao Y, He X. Lab Chip. 2017;17:1297–1305. doi: 10.1039/c6lc01532h. [DOI] [PMC free article] [PubMed] [Google Scholar]
- 20.Chen HH, Purtteman JJ, Heimfeld S, Folch A, Gao D. Cryobiology. 2007;55:200–209. doi: 10.1016/j.cryobiol.2007.08.001. [DOI] [PubMed] [Google Scholar]
- 21.Fang C, Ji F, Shu Z, Gao D. Lab Chip. 2017;17:951–960. doi: 10.1039/c6lc01523a. [DOI] [PubMed] [Google Scholar]
- 22.Lyu SR, Chen WJ, Hsieh WH. Sens Actuators B Chem. 2014;197:28–34. [Google Scholar]
- 23.Beebe DJ, Mensing GA, Walker GM. Annu Rev Biomed Eng. 2002;4:261–286. doi: 10.1146/annurev.bioeng.4.112601.125916. [DOI] [PubMed] [Google Scholar]
- 24.Puts C, Berendsen T, Bruinsma B, Ozer S, Luitje M, Usta OB, Yarmush M, Uygun K. Cryobiology. 2015;71:125–129. doi: 10.1016/j.cryobiol.2015.04.010. [DOI] [PMC free article] [PubMed] [Google Scholar]
- 25.Yu M, Bardia A, Aceto N, Bersani F, Madden MW, Donaldson MC, Desai R, Zhu H, Comaills V, Zheng Z. Science. 2014;345:216–220. doi: 10.1126/science.1253533. [DOI] [PMC free article] [PubMed] [Google Scholar]
- 26.Kleinhans F. Cryobiology. 1998;37:271–289. doi: 10.1006/cryo.1998.2135. [DOI] [PubMed] [Google Scholar]
- 27.Huang LR, Cox EC, Austin RH, Sturm JC. Science. 2004;304:987–990. doi: 10.1126/science.1094567. [DOI] [PubMed] [Google Scholar]
- 28.Inglis DW, Davis JA, Austin RH, Sturm JC. Lab Chip. 2006;6:655–658. doi: 10.1039/b515371a. [DOI] [PubMed] [Google Scholar]
- 29.Chesné C, Guillouzo A. Cryobiology. 1988;25:323–330. doi: 10.1016/0011-2240(88)90040-5. [DOI] [PubMed] [Google Scholar]
- 30.Stott SL, Hsu CH, Tsukrov DI, Yu M, Miyamoto DT, Waltman BA, Rothenberg SM, Shah AM, Smas ME, Korir GK. Proc Natl Acad Sci USA. 2010;107:18392–18397. doi: 10.1073/pnas.1012539107. [DOI] [PMC free article] [PubMed] [Google Scholar]
- 31.Paynter SJ, Andrews K, Vinh NN, Kelly C, Rosser AE, Amso NN, Dunnett SB. Cryobiology. 2009;58:308–314. doi: 10.1016/j.cryobiol.2009.02.008. [DOI] [PubMed] [Google Scholar]
- 32.Ebertz S, McGann L. Cryobiology. 2004;49:169–180. doi: 10.1016/j.cryobiol.2004.06.005. [DOI] [PubMed] [Google Scholar]
- 33.Paynter SJ, O’Neil L, Fuller BJ, Shaw RW. Fertil Steril. 2001;75:532–538. doi: 10.1016/s0015-0282(00)01757-x. [DOI] [PubMed] [Google Scholar]
- 34.Woods EJ, Liu J, Derrow CW, Smith FO, Williams DA, Critser JK. J Hematother Stem Cell Res. 2000;9:161–173. doi: 10.1089/152581600319379. [DOI] [PubMed] [Google Scholar]
- 35.Verkman A, Mitra AK. Am J Physiol Renal Physiol. 2000;278:F13–F28. doi: 10.1152/ajprenal.2000.278.1.F13. [DOI] [PubMed] [Google Scholar]
- 36.Huebert RC, Splinter PL, Garcia F, Marinelli RA, LaRusso NF. J Biol Chem. 2002;277:22710–22717. doi: 10.1074/jbc.M202394200. [DOI] [PubMed] [Google Scholar]
- 37.Marinelli RA, Tietz PS, Caride AJ, Huang BQ, LaRusso NF. J Biol Chem. 2003;278:43157–43162. doi: 10.1074/jbc.M305899200. [DOI] [PubMed] [Google Scholar]
- 38.Van Heeswijk M, Van Os C. J Membr Biol. 1986;92:183–193. doi: 10.1007/BF01870707. [DOI] [PubMed] [Google Scholar]
- 39.van Hoek AN, de Jong MD, van Os CH. Biochim Biophys Acta. 1990;1030:203–210. doi: 10.1016/0005-2736(90)90296-z. [DOI] [PubMed] [Google Scholar]
- 40.Ma T, Frigeri A, Tsai ST, Verbavatz J, Verkman A. J Biol Chem. 1993;268:22756–22764. [PubMed] [Google Scholar]
- 41.García F, Kierbel A, Larocca MC, Gradilone SA, Splinter P, LaRusso NF, Marinelli RA. J Biol Chem. 2001;276:12147–12152. doi: 10.1074/jbc.M009403200. [DOI] [PubMed] [Google Scholar]
- 42.Gradilone SA, Ochoa JE, García F, Larocca MC, Pellegrino JM, Marinelli RA. Anal Biochem. 2002;302:104–107. doi: 10.1006/abio.2001.5533. [DOI] [PubMed] [Google Scholar]
- 43.Carbrey JM, Gorelick-Feldman DA, Kozono D, Praetorius J, Nielsen S, Agre P. Proc Natl Acad Sci USA. 2003;100:2945–2950. doi: 10.1073/pnas.0437994100. [DOI] [PMC free article] [PubMed] [Google Scholar]
- 44.Plaks V, Koopman CD, Werb Z. Science. 2013;341:1186–1188. doi: 10.1126/science.1235226. [DOI] [PMC free article] [PubMed] [Google Scholar]
- 45.Verkman AS, Anderson MO, Papadopoulos MC. Nat Rev Drug Discov. 2014;13:259–277. doi: 10.1038/nrd4226. [DOI] [PMC free article] [PubMed] [Google Scholar]
- 46.Papadopoulos MC, Saadoun S. Biochim Biophys Acta. 2015;1848:2576–2583. doi: 10.1016/j.bbamem.2014.09.001. [DOI] [PubMed] [Google Scholar]


