

Abstract
Background
Cachexia is a wasting condition associated with cancer types and, at the same time, is a serious and dose‐limiting side effect of cancer chemotherapy. Skeletal muscle loss is one of the main characteristics of cachexia that significantly contributes to the functional muscle impairment. Calcium‐dependent signaling pathways are believed to play an important role in skeletal muscle decline observed in cachexia, but whether intracellular calcium homeostasis is affected in this situation remains uncertain. Growth hormone secretagogues (GHS), a family of synthetic agonists of ghrelin receptor (GHS‐R1a), are being developed as a therapeutic option for cancer cachexia syndrome; however, the exact mechanism by which GHS interfere with skeletal muscle is not fully understood.
Methods
By a multidisciplinary approach ranging from cytofluorometry and electrophysiology to gene expression and histology, we characterized the calcium homeostasis in fast‐twitch extensor digitorum longus (EDL) muscle of adult rats with cisplatin‐induced cachexia and established the potential beneficial effects of two GHS (hexarelin and JMV2894) at this level. Additionally, in vivo measures of grip strength and of ultrasonography recordings allowed us to evaluate the functional impact of GHS therapeutic intervention.
Results
Cisplatin‐treated EDL muscle fibres were characterized by a ~18% significant reduction of the muscle weight and fibre diameter together with an up‐regulation of atrogin1/Murf‐1 genes and a down‐regulation of Pgc1‐a gene, all indexes of muscle atrophy, and by a two‐fold increase in resting intracellular calcium, [Ca2+]i, compared with control rats. Moreover, the amplitude of the calcium transient induced by caffeine or depolarizing high potassium solution as well as the store‐operated calcium entry were ~50% significantly reduced in cisplatin‐treated rats. Calcium homeostasis dysregulation parallels with changes of functional ex vivo (excitability and resting macroscopic conductance) and in vivo (forelimb force and muscle volume) outcomes in cachectic animals. Administration of hexarelin or JMV2894 markedly reduced the cisplatin‐induced alteration of calcium homeostasis by both common as well as drug‐specific mechanisms of action. This effect correlated with muscle function preservation as well as amelioration of various atrophic indexes, thus supporting the functional impact of GHS activity on calcium homeostasis.
Conclusions
Our findings provide a direct evidence that a dysregulation of calcium homeostasis plays a key role in cisplatin‐induced model of cachexia gaining insight into the etiopathogenesis of this form of muscle wasting. Furthermore, our demonstration that GHS administration efficaciously prevents cisplatin‐induced calcium homeostasis alteration contributes to elucidate the mechanism of action through which GHS could potentially ameliorate chemotherapy‐associated cachexia.
Keywords: cachexia, growth hormone secretagogues, skeletal muscle, calcium homeostasis, gene expression, cisplatin
1. Introduction
Cachexia is a wasting condition associated with several cancer types and, at the same time, is a serious and dose‐limiting effect of cancer chemotherapy.1 The pathophysiology of cachexia is characterized by a negative protein and energy balance that is driven by a variable combination of reduced food intake and abnormal metabolism.2, 3 Skeletal muscle loss is one of the main characteristics of cachexia and contributes, with other causes, to the functional muscle impairment observed in cancer and in the complications associated with chemotherapy clinical delivery. Among the mechanisms underlying cancer or chemotherapy‐induced muscle atrophy, it has been proposed an increase in muscle proteolysis and a decrease in protein synthesis driven by activation of various enzymatic pathways such as the ubiquitin‐proteasome, mitogen‐activated protein (MAP) kinases or myostatin.2, 4 Skeletal muscle function is highly dependent on calcium signaling for contraction and myofiber protein processing.5, 6 It is known that abnormal intracellular free Ca2+ concentration causes disruption of normal excitation‐contraction (EC) coupling; it can also stimulate the activity of various enzymes, such as calpains, phospholipase A2 or protein kinase C7, 8 and can activate various transcription factors.5 Accordingly, a clear link has been found between calcium homeostasis alteration and muscle performance decline observed in various pathophysiological conditions affecting skeletal muscle such as ageing,9, 10 disuse,11, 12 hypertension,13 muscular dystrophy14 or in states of drug‐induced muscle toxicity.15, 16 It has been demonstrated that several genes that are decreased in extensor digitorum longus (EDL) muscle of cachectic rats encode for proteins that have the ability to bind Ca2+ and therefore to affect EC coupling.17 The alteration of the expression of this gene pattern could impair muscular performance and contribute to muscle loss in cachexia. Indeed, together with sarcoplasmic reticulum (SR) stress and altered protein translation, calcium dysregulation is listed among the key events leading to muscle wasting in cachectic patients.18 However, whether intracellular calcium homeostasis is really affected in this situation remains obscure.2, 18
In spite of its clinical relevance, there is currently no approved treatment for cachexia. Growth hormone secretagogues (GHS), ghrelin mimetics known to increase appetite, lean and fat mass, are being developed as a therapeutic option for cancer cachexia syndrome.19, 20 Although GHS mechanisms of action have not been fully elucidated, their proposed effects are multifaceted. These include, amongst others, an increase in food intake and a decrease in energy expenditure via hypothalamic mechanisms as well as a decrease in inflammation and a stimulation of growth hormone release.21 Additionally, a direct action at the level the adipose tissue22, 23 and skeletal muscle24, 25, 26 are thought to potentially mediate some GHS effects. In this regard, we have previously demonstrated that GHS can differently affect skeletal muscle functionality through regulation of intracellular calcium in dependence of their molecular structure.27, 28
Animal models of cachexia are usually obtained by cancer‐induced or chemotherapy‐induced muscle atrophy.29, 30 Cisplatin, a platinum‐based anticancer drug, is one of the most widely used and potent chemotherapeutic agent, effective against several solid tumours. Cachexia is often a dose‐limiting side effect of cisplatin, then the chance to treat or to prevent cachexia in this setting would allow the use of more appropriate and effective doses of cisplatin. In addition, recent studies allowed a better characterization of cisplatin‐treated animals as a highly useful animal model for elucidating the molecular mechanisms underlying cachexia as well as for establishing the potential beneficial effect of therapeutic agents.23, 26, 31, 32, 33
The aim of this study was to characterize the calcium homeostasis in fast‐twitch EDL muscle of adult rats with cisplatin‐induced cachexia and to establish the potential beneficial effects of two GHS (hexarelin and JMV2894). Particularly, we chose JMV2894, a novel peptidomimetic derivative and hexarelin, a well‐known synthetic hexapeptidic derivative. A multidisciplinary approach in vivo and ex vivo was used to better correlate molecular dysfunction with general cachexia. Our findings provide direct evidences of a calcium homeostasis dysregulation in an experimental model of cachexia gaining insight into the etiopathogenesis of this form of muscle wasting and demonstrate that GHS administration efficaciously prevents the cisplatin‐induced effects through common as well as specific intracellular mechanisms. Parallel in vivo measures of structural and functional parameters allow us also to correlate the calcium handling features with muscle functionality changes thus highlighting the possibility of GHS administration in therapy as useful countermeasure in chemotherapy‐associated cachexia.
2. Methods
2.1. Animals care and experimental protocol
Animal care and all experimental protocols involving animals were in accordance with the European Directive 2010/63/EU and were approved by the Italian Ministry of Health and by the Committee on Animal Experimentation of the University of Milano‐Bicocca. Adult male rats were purchased from Charles River Laboratories (Italy). Animals were housed in a temperature‐controlled, humidity‐controlled, and light‐controlled room. Animals were randomized to receive vehicle (saline), cisplatin, cisplatin + hexarelin, cisplatin + JMV2894. Each animal group was formed by 9–13 animals. Cisplatin (cis‐platinum II‐diammine dichloride) was purchased by Sigma‐Aldrich (St. Louis, MO, USA). Hexarelin and JMV2894 were synthetized by us as previously described.34, 35, 36 Hexarelin and JMV2894 as well as cisplatin (Sigma) were freshly dissolved in physiological saline immediately prior to administration. The dose of cisplatin was 1 mg/kg given daily for 3 days at 9 a.m. intraperitoneally (IP), and hexarelin (160 μg/kg) or JMV2894 (320 μg/kg) was injected IP twice daily at 8.30 a.m. (30 min before cisplatin) and 5 p.m. Cisplatin was administered on day 1 through 3; hexarelin or JMV2894 was administered from day 1 through 5 (Figure 1). At day 5, 2 h after hexarelin or JMV2894 injection, rats were sacrificed. This particular regimen was selected based on previous studies showing cisplatin‐induced weight loss without over‐toxicity32, 37, 38 and on the partial prevention of cisplatin‐induced weight loss mediated by hexarelin or JMV2894 beginning from day 5 during a preliminary study in which in vivo treatments with these GHS for 12 days have been performed.
Figure 1.
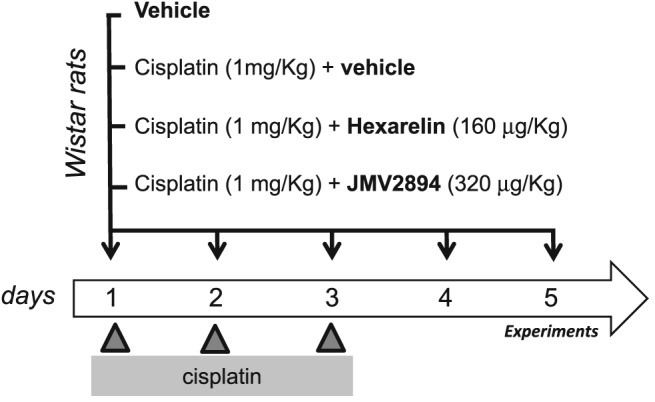
Schematic representation of the experimental protocol. Cisplatin cachexia was induced in adult male Wistar rats by intraperitoneal injection of cisplatin (1 mg/kg) once daily on day 1 through 3. Groups of animals were administered b.i.d either hexarelin (cisplatin + hexarelin), JMV2894 (cisplatin + JMV2894), or saline (cisplatin + vehicle) on day 1 through 5. On day 5, rats were sacrificed 2 h after hexarelin or JMV2894 injection.
Body weight and food intake were assessed daily by weighing the food and the animals before the AM injection. Body weight changes were expressed as change from baseline, and food intake was expressed in g/day.
Furthermore, four rats for each experimental group were used for the in vivo measurements of muscle function.
2.1.1. In vivo measurement of forelimb muscle force by grip strength metre
The forelimb muscle force of control and treated rats was evaluated by means of a grip strength metre (Columbus Instruments, USA), as previously described.39 Four rats for group were analysed. Briefly, the rats were gently lifted onto the stage and made to grab the pull‐gauge by holding them by the tail. The gauge was then pulled horizontally at a constant rate by the researcher. Grip strength was recorded when the rat released the gauge. Five sequential trials, each every 1 min to avoid fatigue, were performed for each rat. The average of the five trials was taken as the representative value for each animal. The test was performed on day 0 (D0) and on day 5 (D5), that is, before and at the end of the experimental protocol application.
2.1.2. In vivo ultrasonography recordings
Ultrasonography was performed using an UBM system (Vevo 2100; VisualSonics, Toronto, ON, Canada) as previously described.40 Briefly, for image acquisition, the rats were anaesthetized with isofluorane at a concentration of 1.5–2% and placed in the dorsal decubitus position. The hind limbs were shaved to avoid interference in the image and positioned at its maximum extension and strictly parallel to the rat body. Image acquisitions were performed operating at a frequency of 40 MHz for B‐Mode acquisition of flexor digitorum longus (FDL) muscle images. The B‐Mode images were generated with a 14 × 14 mm view field and at a frame of 15 Hz. Lateral and axial resolutions were 80 and 40 μm, respectively. The longitudinal image acquisition of the whole length of the FDL muscle was performed by fixing the probe parallel to the hind limb and by shifting the probe along the longitudinal axis. Because of the unfeasibility to acquire an ultrasound image of the whole muscles in their length, we virtually divided the FDL muscles in distal and proximal parts with approximately similar lengths by using as landmark a prominent blood vessel (vein) in our images (see Supporting Information, Figure S1 ). Ultrasound B‐Mode acquisitions of FDL muscle images were performed on day 0 (D0) and on day 5 (D5), that is, before and at the end of the experimental protocol application. Four rats for group were analysed. The FDL volumes were calculated by using the conventional truncated‐cone method previously reported.40, 41 This method consists in the calculation of the volumes of contiguous truncated cones drawn in the distal and proximal parts of FDL muscle (see Supporting Information, Figure S1 ). The volume of each truncated cone is calculated from the equation, [V = hπ/3 (r1 2 + r1r2 + r2 2)] in which r1 is the minor radius, r2 is the major radius, h is the height and π = 3.142. The rat FDL muscle was subdivided in eight contiguous truncated cones and the total volume is calculated as the sum of all truncated cones volumes.
2.2. Dissection of native muscle fibres
The EDL muscle was removed from each animal under deep urethane anaesthesia (1.2 g/kg body weight). Immediately after surgery, the rats were maintained under anaesthesia and euthanized with an anaesthetic overdose. EDL muscles were pinned in a dissecting dish containing 95% O2/5% CO2‐gassed normal physiological solution (whose composition is defined below) at room temperature (22°C) for further dissection. Small bundles of 10–15 fibres arranged in a single layer were dissected lengthwise (tendon‐to‐tendon) with the use of microscissors, as previously described.11
2.3. Fura‐2 fluorescence measurements in intact muscle fibres
Calcium measurements were performed using the membrane‐permeable Ca2+ indicator fura‐2 acetoxymethyl ester (fura‐2AM, Molecular Probes‐Invitrogen, Italy). Loading of muscle fibres was performed for 2 h at 25°C in normal physiological solution containing 5 μm fura‐2AM mixed to 0.05% (v/v) Pluronic F‐127 (Molecular Probes). After loading, muscle fibres were washed with normal physiological solution and mounted in a modified RC‐27NE experimental chamber (Warner Instrument Inc., Hamden, USA) on the stage of an inverted Eclipse TE300 microscope (Nikon, Japan) with a 40X Plan‐Fluor objective (Nikon, Japan). The mean sarcomere length was set to 2.5–2.7 μm. Fluorescence measurements were made using a QuantiCell 900 integrated imaging system (Visitech International Ltd., Sunderland, UK) as previously described.11, 14
During the experiments, pairs of background subtracted images of fura‐2 fluorescence (510 nm) emitted after excitation at 340 and 380 nm were acquired and ratiometric images (340/380 nm) were calculated for each muscle fibre of the preparation using QC2000 software. Subsequently, fluorescence ratio values were converted to the resting cytosolic calcium concentration, [Ca2+]i (nM), after a calibration procedure using the following equation: [Ca2+]i = (R‐Rmin)/(Rmax‐R)*KD*β where R is the ratio of the fluorescence emitted after excitation at 340 nm to the fluorescence after excitation at 380 nm; KD is the affinity constant of fura‐2 for calcium, which was taken as 145 nM (Molecular Probes); and β is a parameter according to Grynkiewicz et al.42 that was determined experimentally in situ in ionomycin‐permeabilized muscle fibres as previously described.11, 42 Rmin and Rmax were determined in muscle fibres incubated in Ca2+‐free normal physiological solution containing 10 mM ethylene glycol bis(β‐aminoethyl ether)‐N,N,N′,N′‐tetracetic acid (EGTA) and in normal physiological solution, respectively. Because calibration parameters of fura‐2 can depend on muscle type and experimental condition,11, 14 we determined the parameters of Grynkiewicz's equation in each muscle examined for accurate calculation of calcium concentration.
2.4. Store‐operated calcium entry (SOCE) measurements by Mn2+ quenching technique
The manganese quench technique was used to estimate the sarcolemmal permeability to divalent cations. Mn2+ enters via the same routes as Ca2+ but accumulates inside the cell. As Mn2+ quenches the fluorescence of fura‐2, the reduction of the intensity of fura‐2 fluorescence can be used as an indicator of the time integral of Mn2+ influx.11 Muscle preparations were perfused for 2 min with normal physiological solution containing 0.5 mM Mn2+ as a surrogate of CaCl2 (quenching solution). To measure the Mn2+ influx through the store‐operated Ca2+ channels (SOC), a proper protocol for SOCE activation was used.43 Particularly, the fibres were perfused with 10 μm thapsigargin and 40 mM caffeine for 15 min in zero Ca2+ extracellular solution to induce sarcoplasmic reticulum Ca2+ depletion; thereafter, 0.5 mM Mn2+ was added to extracellular solution. During the quenching protocol, the fluorescence emission of fura‐2 excited at 360 nm was acquired at 1 Hz.
2.5. Electrophysiological recordings by intracellular microelectrodes
Soon after removal, EDL muscles were tied at each tendon on a glass rod in a 25‐ml chamber and perfused with the normal physiological solution at 30°C gassed with 95% O2/5% CO2. The resting total membrane conductance (gm) was determined using the two intracellular microelectrodes technique in current‐clamp mode as detailed elsewhere.44 Briefly, fibre diameter and membrane resistance (Rm) was calculated applying a hyperpolarizing square current pulse into the muscle fibre through one microelectrode and recording the resulting voltage deflection with a second microelectrode inserted at two different distances from the current electrode. The current stimulation and data acquisition and analysis were carried out under computer control. The value of gm was 1/Rm in the normal physiological solution. To measure the excitability characteristics of sampled fibres the membrane potential was set by a steady holding current to −80 mV before passing the depolarizing pulses. By increasing the amplitude of the pulse, a single action potential was elicited. The excitability parameters, determined off‐line on digital action potential recordings, were the current threshold to elicit the first action potential (Ith) and the latency of action potential (Lat), which is the delay from the start of the current pulse to the onset of an action potential at threshold and is an excitability parameter inversely correlated to the gm.
2.6. Solution and chemical compounds
The normal physiological solution was composed of 148 mM NaCl, 4.5 mM KCl, 2.5 mM CaCl2, 1 mM MgCl2, 0.44 mM NaH2PO4, 12 mM NaHCO3 and 5.5 mM glucose. The pH of all solutions was adjusted to 7.3–7.4 by bubbling them with 95% O2/5% CO2. 45 The calcium free‐solution has the same composition of the normal physiological solution except that CaCl2 was omitted and 10 mM ethylene glycol bis(β‐aminoethyl ether)‐N,N,N′,N′‐tetracetic acid was added. The quenching solution had the same composition of normal physiological solution except that 0.5 mM MnCl2 was substituted for CaCl2. All chemicals cited earlier as well as ionomycin, caffeine and thapsigargin were purchased from Sigma (St. Louis, MO, USA).
2.7. Isolation of total RNA, reverse transcription and real‐time PCR
EDL muscles were snap frozen in liquid nitrogen soon after removal and stored at −80°C until use. For each muscle sample, total RNA was isolated with TRIzol (Life Technologies C.A. 10296028) and quantified by using a spectrophotometer (ND‐1000 Nano‐Drop, Thermo Scientific). To perform reverse transcription, for each sample, 400 ng of total RNA was added to 1 μl dNTP mix 10 mM each, (Roche N.C. 11277049001), 1 μl Random Hexamers 50 μm (Life Technologies C.N. n808–0127) and incubated at 65°C for 5 min. Afterward, 4 μl 5X First Standard Buffer (Life Technologies C.N. Y02321), 2 μl 0,1 M DTT (Life Technologies C.N. Y00147) and 1 μl Recombinant RNasin Ribonuclease Inhibitor 40 U/μl (Promega C.N. N2511) were added and incubated at 42°C for 2 min. To each solution 1 μl Super Script II Reverse Transcriptase 200 U/μl (Life Technologies C.N. 18064–014) was added and incubated at 25°C for 10 min, at 42°C for 50 min and at 70°C for 15 min. Real‐time PCR was performed in triplicate using the Applied Biosystems Real‐time PCR 7500 Fast system, MicroAmp Fast Optical 96‐Well Reaction Plate 0.1 mL (Life Technologies C.N. 4346906) and MicroAmp Optical Adhesive Film (Life Technologies C.N. 4311971). Each reaction was carried in triplicate on a single plex reaction. The setup of reactions consisted 8 ng of cDNA, 0,5 μl of TaqMan Gene Expression Assays, (Life Technologies), 5 μl of TaqMan Universal PCR master mix No AmpErase UNG (2×) (Life Technologies C.N. 4324018) and Nuclease‐Free Water not DEPC‐Treated (Life Technologies C.N. AM9930) for a final volume of 10 μl. Under the working RT‐TaqMan‐PCR conditions: step 1: 95°C for 20 s; step 2: 95°C for 3 s; and step 3: 60°C for 30 s; steps 2 and 3 were repeated 40 times. The results were compared with relative standard curve obtained by five points of 1:4 serial dilutions. TaqMan Hydrolysis primer and probe gene expression assays were ordered by Life Technologies with the assay IDs reported in Supporting Information Table S1. The mRNA expression of the genes was normalized with Actinb. For Orai1, a gene poorly expressed, a pre‐amplification by TaqMan PreAmp Master Mix (Life Technologies C.N. 4391128) was made before the real‐time PCR experiments. The set‐up of pre‐amplification consisted by 250 ng of reverse‐transcribed (in 12.5 μl volume), 25 μl of TaqMan PreAmp Master Mix (2×) and 12.5 μl of pool assay 0.2× (containing Orai1 and Actinb). The solution was incubated at 50°C for 2 min, 95°C for 10 min and for 40 cycles of 95°C for 15 s and 60°C for 1 min. The methods of gene expression analysis are the same as those previously used.13, 44 The RT‐PCR experiments were performed in agreement with the MIQE guidelines for qPCR.46
2.8. Histology
For histological studies, EDL muscles were dissected by surrounding tissue, then covered with tissue‐tek O.C.T. (Bio‐Optica) and frozen in isopentane cooled by liquid nitrogen. Samples were stored at −80°C until processing. Serial cross sections (7–8 μm thick) were cut in a cryostat microtome set a −20°C (HM525 NX, Thermo Scientific). Haematoxylin–eosin (HE) staining was performed on transverse muscle sections to examine the general morphology. Sections were examined using Olympus CX41 microscope. Morphometric analysis was performed by using the Image J analysis software semi‐automatic method. The percentage of total damage (necrosis + inflammatory infiltration + non‐muscle area) was calculated on 6–7 fields at 10× covering more than the 80% of the entire muscle section. Furthermore, cross‐sectional area (CSA) of individual fibres was measured as the internal H&E‐stained area.
2.9. Analytical methods
Spontaneously voided urine was collected from rats placed individually in metabolic cages. Trunk blood was collected into a tube and then processed to obtain serum. Serum and urinary electrolytes and the other parameters were assayed by using standard techniques (Analyzer Dimension EXL, Siemens Healthineers). Serum and urinary cortisol were measured with a radioimmunoassay kit.
2.10. Statistical analysis
The data are presented as the mean ± SEM. One‐way analysis of variance (ANOVA) followed by Bonferroni's t‐test, or Kruskal–Wallis test followed by Mann–Whitney U test was used to evaluate multiple statistical differences between groups. P < 0.05 was considered to be statistically significant.
3. Results
3.1. Effects of GHS on body weight, muscle atrophy indexes and morphology changes caused by cisplatin
Administration of cisplatin significantly reduced body weight already from the first day after the administration and along all days of the experimental protocol (Figure 1 and 2A). This effect was associated with a significant decrease in cumulative food intake (Figure 2B). A similar trend was also observed when cumulative food intake was normalized to body weight (see Supporting Information, Figure S2 ). All these effects were partially prevented by GHS treatments, thus indicating that both GHS were able to partially counteract anorexia (Figure 2A and 2B, see Supporting Information, Figure S2 ).
Figure 2.
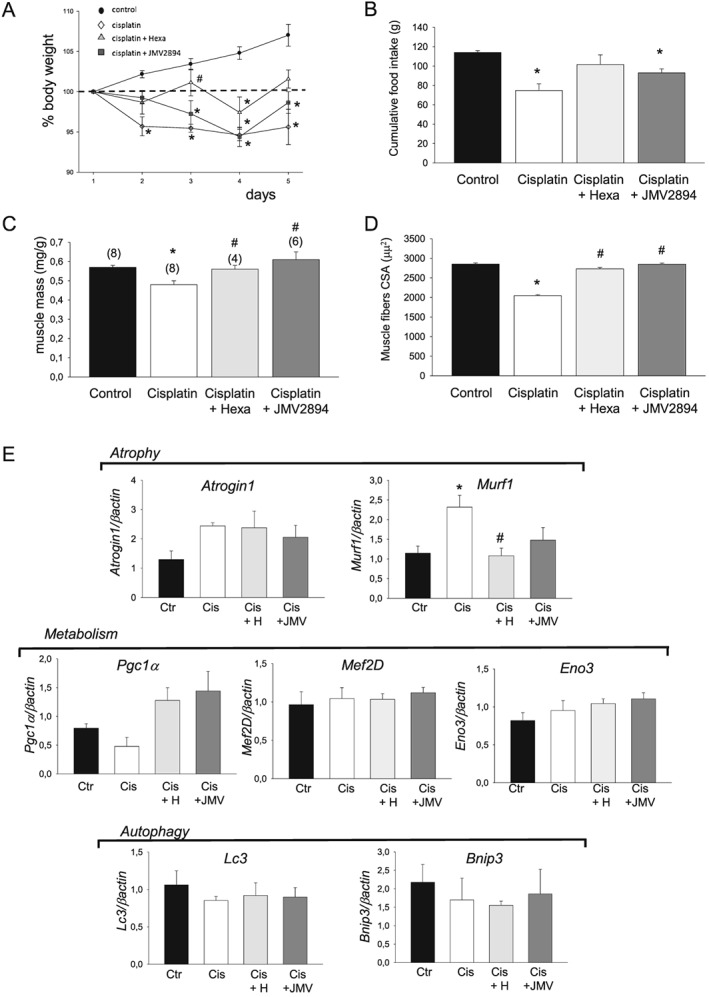
Effects of GHS on cisplatin‐induced changes in body weight, food intake and muscle atrophy indexes. (A) Changes in body weight in control, cisplatin, cisplatin + hexarelin, cisplatin + JMV2894 treated rats. The change is expressed as per cent from day 1. Each point is the mean ± SEM from six to eight rats. On each experimental day, significant differences between groups were evaluated using ANOVA test and Bonferroni's t‐test. Significant differences found with P < 0.05 are expressed with respect to * control rats and # cisplatin treated rats. (B) Cumulative food intake from day 0–1 (prior to beginning of the treatments) to day 4–5. Each bar is the mean ± SEM from six to eight rats. Statistical analysis by Kruskal–Wallis test showed significant difference in cumulative food intake (Kruskal‐Wallis statistic = 13.7, P < 0.05). Significantly different by Mann–Whitney U test with respect to * control rats (P < 0.01). (C) Values of muscle mass are expressed as mean ± SEM of n muscle (n is indicated in the brackets). Statistical analysis by Kruskal–Wallis test showed significant difference in muscle mass (Kruskal–Wallis statistic = 15.9, P < 0.01). Significantly different by Mann–Whitney U test with respect to * control rats (P < 0.01) and # cisplatin treated rats (P < 0.02 or less). (D) Values of muscle fibre cross‐sectional area (CSA) are expressed as mean ± SEM of 1255–1407 muscle fibres. Statistical analysis by ANOVA showed significant differences in muscle mass (F = 7, df = 3/22, P < 0.001) and in fibre CSA (F = 159, df = 3/5335, P < 0.01). Significantly different by Bonferroni's t‐test with respect to * control rats and # cisplatin treated rats (P < 0.05 or less). E) Expression profile of genes related to atrophy/metabolism and autophagy. Bars show quantification of transcript levels with qPCR for Atrogin 1 and Murf 1 (atrophy), Pgc‐1a, Eno3 and Mef2D (metabolism), Lc3 and Bnip3 (autophagy) genes normalized by the β‐actin gene in EDL muscle from control rats, cisplatin, cisplatin + hexarelin and cisplatin + JMV2894 treated rats. For each gene, transcript levels were determined in EDL muscle of at least five animals for each group of rat. Significant differences between groups were evaluated using Kruskal–Wallis test and Mann–Whitney U test. Significant differences found with P < 0.05 or less are expressed with respect to * control rats, and # cisplatin treated rats. Ctr, control rats; Cis, cisplatin treated rats; Cis + H, cisplatin + hexarelin tretated rats; Cis + JMV, cisplatin + JMV2894 treated rats.
As an index of muscle atrophy, we determined the muscle mass expressed as muscle weight normalized to body weight. Atrophy was evident in EDL muscle of cisplatin treated rats, with a significant 13% reduction of muscle‐to‐body weight ratio with respect to control rats (Figure 2C). Analysis of CSA of individual muscle fibre confirms cisplatin‐induced muscular atrophy (Figure 2D). To determine whether the changes of muscle fibres CSA were homogeneous within the whole EDL muscles, we plotted the distribution of single fibre as a function of muscle fibres CSA, using a sampling value of 500 μm2 (Figure 3A). In EDL muscle from control rats (Figure 3A), fibres are normally distributed around a mean value similar to the arithmetic mean reported in Figure 2D. Cisplatin produced a shift of the muscle fibres distribution toward more low CSA values. Both GHS completely prevented cisplatin‐induced changes of the muscle‐to‐body weight ratio and of the muscle fibre CSA (Figure 2C, 2D and 3A). In line with the atrophic muscle condition, and as it was also observed in other animal models of muscle atrophy,47, 48 real‐time PCR analysis revealed that in cisplatin muscles, Murf‐1 and atrogin‐1 transcripts associated with the ubiquitin‐proteasome system were increased compared with controls (Figure 2E). Cisplatin treatment also induced a down‐regulation of the transcriptional coactivator peroxisome proliferator‐activated receptor‐γ coactivator‐1α (Pgc‐1α), a marker of muscle oxidative phenotype, while it did not alter the expression of the glycolytic enzyme beta‐enolase (Eno3), another muscle metabolism‐related gene, and of Myocyte‐enhancer factor 2D (Mef2D), another muscle phenotype related‐gene (Figure 2E). Furthermore, no changes in gene expression of some muscle autophagy‐related proteins such as microtubule‐associated protein 1 light chain 3 alpha (Lc3) and BCL2/adenovirus E1B 19 kDa protein interacting protein 3 (Bnip3) were observed (Figure 2E). Hexarelin and JMV2894 treatment fully and partially restored, respectively, the gene expression of Murf‐1, whereas both GHS failed to restore atrogin‐1 gene level. Importantly, both drugs effectively rescued the altered expression of Pgc‐1α (Figure 2E).
Figure 3.
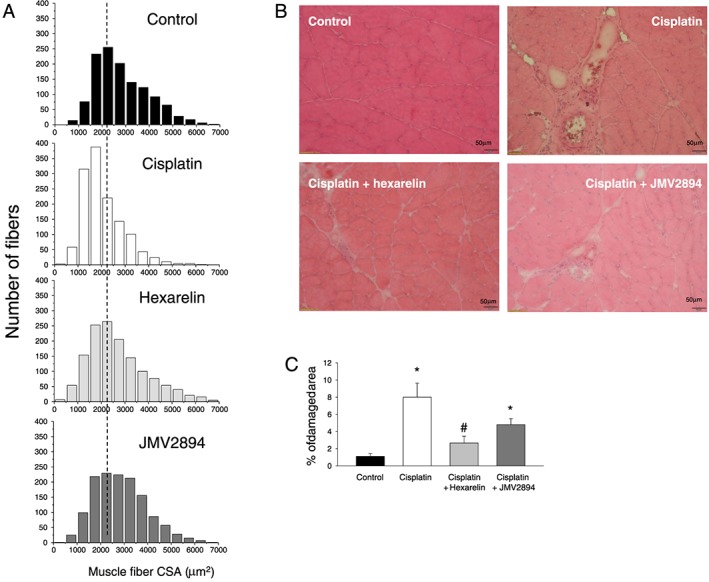
Hexarelin and JMV2894 partially prevent cisplatin‐induced muscle damage. (A) Fibres distribution as a function of muscle fibres cross‐sectional area (CSA) in rat muscles. Muscle fibre CSA was measured on muscle cross section stained with haematoxylin–eosin. Histograms were constructed using a sampling interval of 500 μm2. (B) Transverse histological section of skeletal muscle stained with haematoxylin–eosin of control rats, cisplatin, cisplatin + hexarelin and cisplatin + JMV2894 treated rats. (C) Percent of damaged area. Each bar is the mean ± SEM from four to eight muscles. Statistical analysis by Kruskal–Wallis test showed significant difference in percent of damaged area (Kruskal‐Wallis statistic = 15.5, P < 0.02). Significantly different by Mann–Whitney U test with respect to * control rats and # cisplatin treated rats (P < 0.02 or less).
Histology analysis further evidenced some features of cisplatin‐induced muscle wasting. As shown in Figure 3B, control muscles did not show any sign of damage, as indicated by the absence of inflammatory cell infiltration into the interstitial space or within the cells. The muscle fibres were relatively uniform size and shape, with nuclei located at the periphery fitting together in a mosaic pattern. Cisplatin treated rats presented an alteration of the muscle architecture, characterized by the presence of areas of necrosis and infiltrates as well as of a large areas, characterized by deposition of compact wasting material and debris (non muscle area) which replaces muscle tissue and reminds drug‐induced necrotizing myopathies. Accordingly, quantitative morphometric analysis of total damaged area, expressed as the sum of necrosis, infiltration and non‐muscle area, was significantly higher in cisplatin treated muscle with respect to control muscle (Figure 3C). Both hexarelin and JMV2894 caused a significant protective effect, showing a 60% and 40% decrease of the area of total damage, respectively, compared with cisplatin treated muscles (Figure 3B and 3C). Furthermore, the lack of significant difference in the mRNA expression of MyoD and Pax7, two genes involved in muscle regeneration during cachexia26, 49 among the four animal groups under investigation (see Supporting Information, Figure S3 ), likely minimizes the occurrence of any relevant regenerative programme activation induced by cisplatin treatment as well as of any GHS interference in this context.
All these features characterizing our cisplatin‐induced model of cachexia did not seem to be associated with an acute renal failure. Indeed, no significant electrolyte abnormality was observed in serum and urine of cisplatin treated rats with respect to control animals (see Supporting Informations, Table S2 and S3). It is known that cisplatin could produce nausea with associated stress‐induced hyperglycemia and hypercorticosteronemia. However, no significant difference was observed in serum glucose as well as in serum and urinary cortisol levels among the four animal groups (see Supporting Informations, Table S2 and S3).
3.2. Effects of GHS on calcium homeostasis alteration caused by cisplatin
3.2.1. Resting cytosolic calcium
In line with previous studies,11, 13 EDL fast‐twitch skeletal muscle fibres of adult control rats showed a value of resting [Ca2+]i of 29.7 ± 1.9 nM. Cisplatin administration was associated with a significant alteration of resting [Ca2+]i. Indeed, the resting [Ca2+]i was about two‐fold higher in cachectic EDL muscle fibres of cisplatin treated rats compared with control rats (Figure 4A). This cisplatin‐induced effect was efficaciously prevented by both GHS. In fact, cisplatin + hexarelin and cisplatin + JMV2894 treated rats had a resting [Ca2+]i value overlapping that of control animals and significantly lower than that of cisplatin treated animals (Figure 4A).
Figure 4.
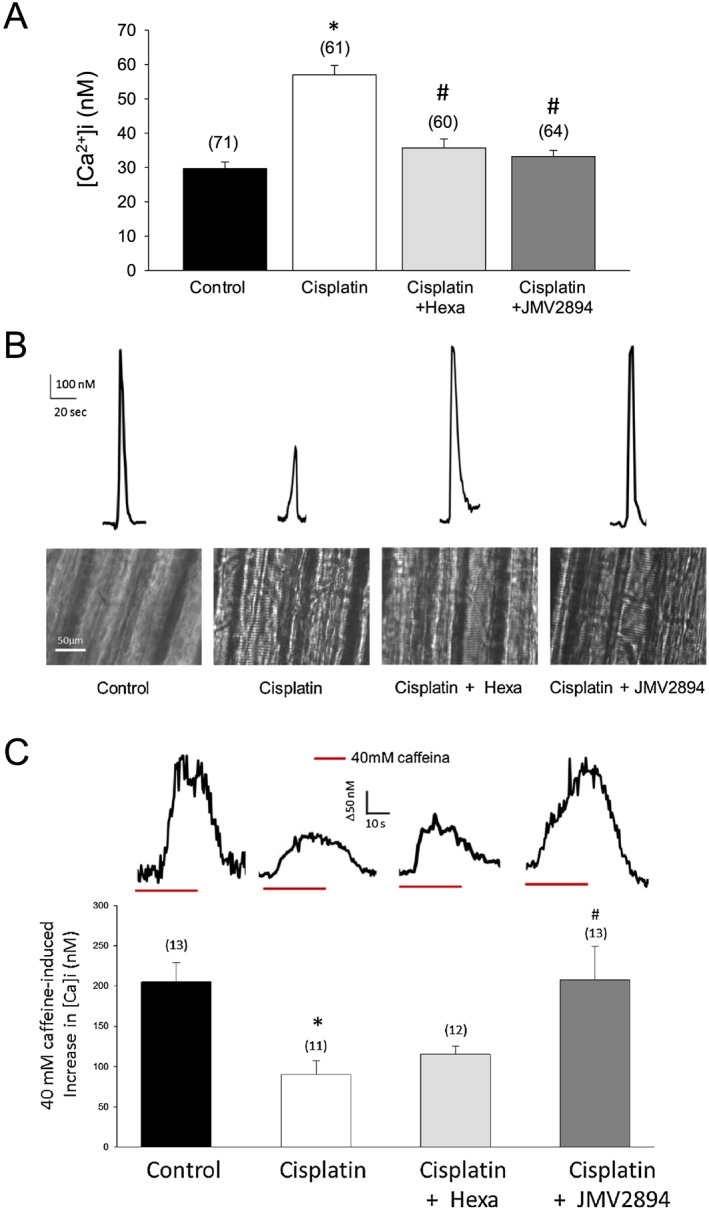
Effects of cisplatin and GHS treatments on resting [Ca2+]i, excitation‐calcium release coupling and SR properties. (A) Resting [Ca2+]i measured in EDL muscle fibres from rats treated with cisplatin, cisplatin + hexarelin, cisplatin + JMV2894 and from control rats. Each bar represents the mean ± SEM of resting [Ca2+]i measured in n myofibers (n is indicated in the brackets) of at least four rats. Statistical analysis by ANOVA showed significant differences (F = 29, df = 3 /252, P < 0.0001). Significantly different by Bonferroni's t‐test with respect to * control rats and # cisplatin treated rats (P < 0.05 or less). (B) Upper: representative traces for each indicated group of rats showing the Ca2+ transient induced by the application of depolarizing 100 mM K+ solution; Bottom: visible light microscopic representative images of skeletal muscle fibres samples for each indicated group of rats. (C) JMV2894 but not hexarelin prevents caffeine responsiveness alterations induced by cisplatin administration. Upper: Representative traces of the [Ca2+]i increase observed after 40 mM caffeine application for each indicated group of rats. Bottom: Amplitude values of calcium transient recorded during application of 40 mM caffeine. Each bar represents the mean ± SEM of calcium transient measured in n myofibers (n is indicated in the brackets) obtained from at least four rats. Statistical analysis by ANOVA showed significant differences (F = 5, df = 3/45, P < 0.005). Significantly different by Bonferroni's t‐test with respect to * control rats and # cisplatin treated rats (P < 0.05 or less).
3.2.2. Voltage‐dependent calcium release
To assess the impact of the alteration of resting [Ca2+]i in the excitation‐calcium release coupling features in cachectic rats, we exposed skeletal muscle fibres to a depolarizing high potassium solution. As illustrated in Figure 4B (upper panel), cisplatin treated rats showed a marked alteration of the voltage‐dependent Ca2+ release. Indeed, the amplitude of the Ca2+ transient induced by 100 mM K+ depolarizing solution showed by this group of animals was reduced by about 50% with respect to the control rats. No difference was observed between GHS treated rats and control rats, indicating that both hexarelin and JMV2894 prevented cisplatin‐induced dysfunction of excitation‐calcium release coupling. In accordance to the changes in excitation‐calcium release coupling, the gross morphology of muscle fibres of cisplatin treated rats was characterized by a remarkable collapse and disarray of sarcomeres, and these changes were also prevented both by hexarelin and JMV2894 (Figure 4B, bottom panel).
3.2.3. Caffeine‐induced calcium release
To further analyse calcium‐handling mechanisms specifically correlated to the SR properties in the different muscle groups, we investigated the response to caffeine, a modulator of the ryanodine receptor (RyR) which generates a calcium transient by directly gating RyR.11 We determined the caffeine responsiveness at 40 mM because the maximal amplitude value of caffeine‐induced calcium transient in rat EDL intact muscle fibres was obtained at this dose.11 As shown in Figure 4C (upper panel), the responsiveness to caffeine was significantly reduced (about 50%) in cisplatin treated rats compared with control animals and this change was completely prevented by JMV2894 administration. In contrast, hexarelin administration failed to ameliorate this parameter, because the caffeine‐induced calcium transient of cisplatin + hexarelin treated rats was not significantly different from that of the cisplatin group (Figure 4A, lower panel).
3.2.4. Store‐operated calcium entry
Store‐operated calcium entry is essential for maintenance of Ca2+ homeostasis by ensuring the SR refilling.43 Physiological SOCE is required for proper muscle function. Thus, an alteration of SOCE activity could contribute to the calcium homeostasis dysregulation observed in cachectic muscles. To test the functional status of SOCE in muscles of the different animal groups, we used Mn2+ quenching of Fura‐2 fluorescence after SOCE activation. To this end, SR Ca2+ stores of muscle fibres were depleted with thapsigargin and caffeine.13, 43 As shown in Figure 5A and 5B, EDL muscle of cisplatin treated rats displays a significantly reduced Mn2+ entry rate compared with that of control animal, indicating that SOCE induced by SR Ca2+ depletion is compromised in cachectic muscle. Both GHS fully prevented the SOCE decrease (Figure 5B).
Figure 5.
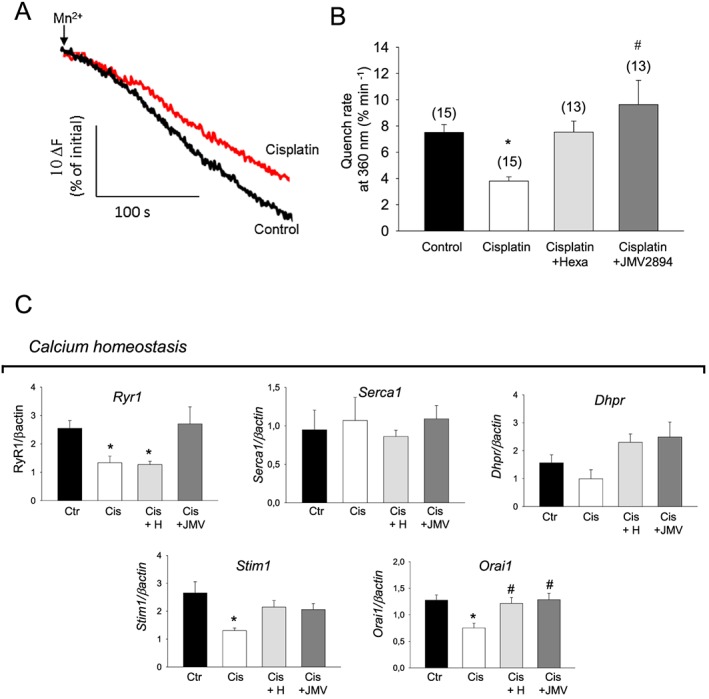
Effects of cisplatin and GHS treatments on SOCE properties and expression profile of genes related to calcium homeostasis. (A) Representative traces of fura‐2 fluorescence quenching associated with Mn2+ influx in skeletal muscle fibres following depletion of SR Ca2+ stores induced by thapsigargin and caffeine (see Methods). Arrows indicate the start of perfusion of muscle fibres with MnCl2 after fibres treatment with thapsigargin/caffeine in zero calcium. Black trace indicates muscle fibres from control rats and red trace from cisplatin treated rats; (B) mean quench rates after SOCE activation. Each bar represents the mean ± SEM of quench rates measured in n myofibers (n is indicated in the brackets) for each indicated group of rats from at least four animals. Statistical analysis by ANOVA showed significant differences (F = 6, df = 3/52 P < 0.02). Significantly different by Bonferroni's t‐test with respect to * control rats and # cisplatin treated rats (P < 0.05 or less). (C) Bars show quantification of transcript levels with qPCR for RyR1, Dhpr, ATP2A1, Stim1, Orai1 genes normalized by the β‐actin gene in EDL muscle from control rats, cisplatin, cisplatin + hexarelin and cisplatin + JMV2894 treated rats. For each gene, transcript levels were determined in EDL muscle of at least five animals for each group of rat. Significant differences between groups were evaluated using Kruskal–Wallis test and Mann–Whitney U test. Significant differences found with P < 0.05 or less are expressed with respect to * control rats, and # cisplatin treated rats. Ctr, control rats; Cis, cisplatin treated rats; Cis + H, cisplatin + hexarelin tretated rats; Cis + JMV, cisplatin + JMV2894 treated rats.
3.2.5. Expression profile of genes related to calcium homeostasis machinery
Consistent with the altered voltage‐dependent and caffeine‐dependent calcium release and the reduced SOCE, the expression of the ryanodine receptor 1 (RyR1), the voltage‐sensitive calcium channel Cav1.1 (Cacn1s or Dhpr), the stromal interaction molecule (Stim1) and its main target, the calcium release‐activated calcium modulator 1 (Orai1) was down‐regulated in cisplatin treated rats compared with controls (Figure 5C). The two GHS caused differential effects on the gene expression profile. Indeed, hexarelin treatment fully or partially restored the gene expression of Dhpr, Stim1 and Orai1 but not of RyR1, whereas JMV2894 treatment resulted effective in recovering the altered expression of all these genes (Figure 5C).
3.3. Effects of GHS on ex vivo muscle function alterations caused by cisplatin
Resting ionic conductances and muscle excitability are considered ex vivo functional outcomes in conditions of muscle calcium dysregulation.50, 51 Thus, to verify the relevance of the changes in calcium homeostasis observed in cachectic skeletal muscle fibres, we determined these electrophysiological parameters by using the two intracellular microelectrodes technique. Importantly, EDL muscle of cisplatin treated rats showed a significant 20% decrease of resting membrane conductance (gm) (Figure 6A) and an increase of the latency of action potential (Lat) (Figure 6B and 6C), thus indicating that the cachexia‐induced alteration of calcium homeostasis influences ex vivo muscle function. Administration of hexarelin or JMV2894 prevented, to different degree, cisplatin‐induced alteration of both electrophysiological parameters (Figure 6A–6C).
Figure 6.
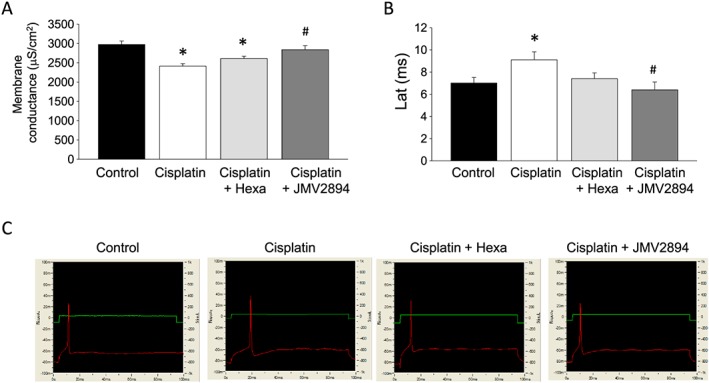
Cisplatin‐induced alteration of ex vivo functional parameters and effects of GHS treatments. (A) Total membrane conductance (gm). Each value represents the mean ± SEM of gm measured in 23–41 myofibers from at least three rats for each indicated animal group. Statistical analysis by ANOVA showed significant differences (F = 9, df = 3/111, P < 0.0001). Significantly different by Bonferroni's t‐test with respect to * control rats and # cisplatin treated rats (P < 0.05 or less). (B) Excitability characteristics. Upper: Representative intracellular microelectrodes recordings of excitability characteristics in EDL muscle fibres of each indicated group of rats. Bottom: Each bar represents the mean ± SEM of the excitability parameter Lat (latency of action potential) measured in 10–17 myofibers from at least three rats for each indicated animal group. Statistical analysis by ANOVA showed significant differences (F = 3, df = 3/54, P < 0.05). Significantly different by Bonferroni's t‐test with respect to * control rats and # cisplatin treated rats (P < 0.05 or less).
3.4. Effects of GHS on in vivo muscle function alterations caused by cisplatin
In order to evaluate whether the cisplatin‐induced calcium homeostasis alteration and the protective effects mediated by GHS are linked with changes in muscle functionality in vivo, we assessed in vivo several structural and functional parameters by using the grip strength metre and the non‐invasive ultrasonography method. All these measures were performed on day 0 (D0) and on day 5 (D5), that is, before and at the end of the experimental protocol application.
3.4.1. Grip strength
As shown in Figure 7, similar values of forelimb force were measured in the four groups of animal at D0. At D5, the forelimb force value of cisplatin treated rats was significantly decreased in comparison with those measured at D0 and also with those of the vehicle treated group at D5. GHS treatments partially prevented cisplatin‐induced effects, because hexarelin and JMV2894 treated rats showed greater force values compared with cisplatin treated rats (Figure 7). A similar trend of results was also obtained when the absolute forelimb forces values were normalized for body weight (data not shown).
Figure 7.
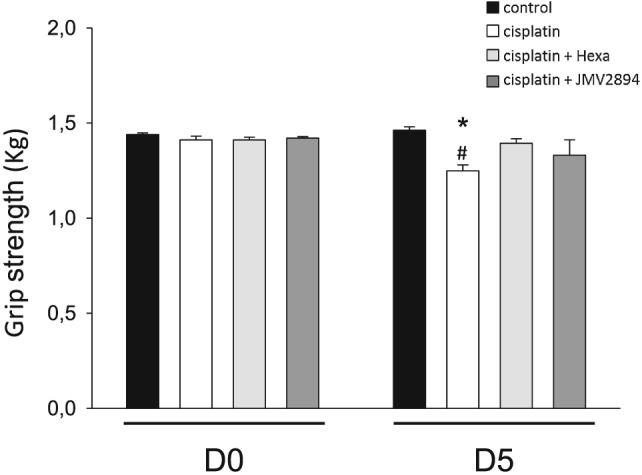
Effects of cisplatin and GHS on force in vivo. The grip strengths of the rats were measured on D0 (before the treatment) and on D5 (at the end of the treatment). Each bar represents the mean ± SEM of force from four rats for each indicated animal group. Statistical analysis by ANOVA showed significant differences (F = 4, df = 7/24, P < 0.01). Significantly different by Bonferroni's t‐test with respect to * control rats at D5 and # cisplatin treated rats at D0 (P < 0.05 or less).
3.4.2. Ultrasonography
We assessed ultrasonographic features of FDL, a hindlimb muscle very similar to EDL in fibres composition and function.52 Representative FDL muscle images, virtually divided in distal and proximal parts and used for volume analysis by using the truncated‐cone method, are reported in Figure 8. No significant changes of FDL muscle ultrasonographic volumes were observed in the four groups of animals at D0 (Figure 9). Cisplatin treatment caused a significant reduction of the FDL muscle volume, showing at D5 a volume reduction of about 35% with respect to volumes of the related animal group at D0 as well as compared with the control group at D5 (Figure 9). Interestingly, GHS treatment prevented cisplatin‐induced muscle volume reduction because no significant change of FDL muscle ultrasonographic volumes were observed in hexarelin and JMV2894 treated rats at D5 with respect to both the related animal groups at D0 and control animals at D5 (Figure 9).
Figure 8.
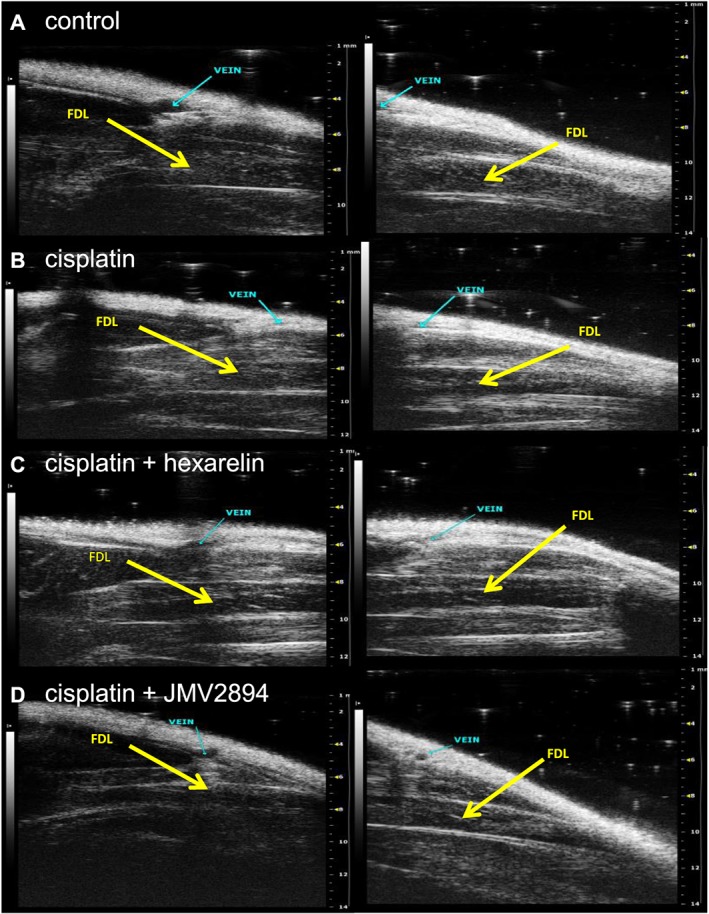
In vivo ultrasonographic study. Representative images of ultrasonographic acquisitions of FDL muscle at D5 (day at the end of the treatment) in control (A), cisplatin (B), cisplatin + hexarelin (C) and cisplatin + JMV2894 (D) treated rats. The images were acquired from proximal position (panel on left) and distal position (panel on right). The FDL muscles are indicated by arrows.
Figure 9.
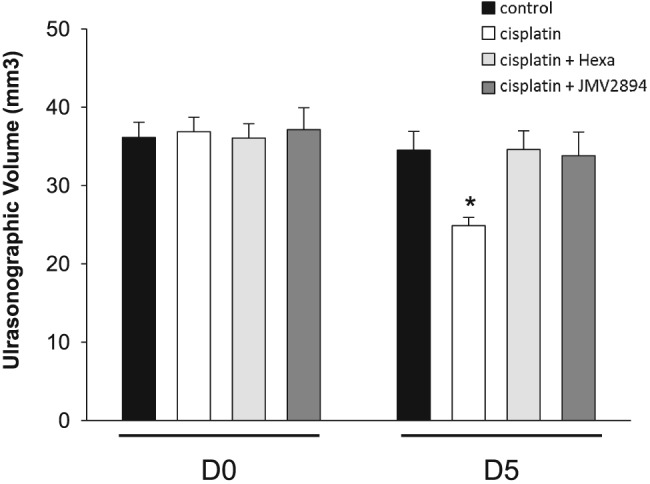
Cisplatin‐induced changes in FDL ultrasonographic muscle volume and effects of GHS treatments. Ultrasonographic FDL volume was determined at D0 (before the treatment) and on D5 (at the end of the treatment) for each experimental group. Each bar is the mean ± SEM from four rats. Because no significant difference was found between the two hind limbs of each rat, the single rat value was calculated as the mean of the ultrasonographic volume of left and right FDL muscles. Statistical analysis by ANOVA showed significant differences (F = 3.4, df = 7/23, P < 0.02). Significantly different by Bonferroni's t‐test with respect to * cisplatin treated rats at D0 (P < 0.02).
4. Discussion
Cachexia occurs in up to 80% of patients at the later stage of cancer and is often associated with decreased response to therapy, quality of life and survival.1, 53 There is currently no approved therapy for cachexia.20 In consideration of the clinical relevance of this problem, the definition of the molecular mechanism underlying cachexia and development of new therapy are highly desirable.
4.1.
4.1.1. Characterization of cisplatin‐induced muscle damage and calcium homeostasis alteration.
The first aim of this study was to characterize the effects of the commonly used chemotherapic agent cisplatin on skeletal muscle calcium homeostasis. We showed that, besides a significant reduction of the muscle weight and muscle fibre CSA, EDL muscles of cisplatin treated rats showed an up‐regulation of atrogin1 and Murf‐1 genes, compared with control animals. Furthermore, as observed in other cachectic animal models,54, 55 Pgc1‐α expression is decreased, although not significantly. All these data, which are indexes of overt muscle atrophy, together with the histological analysis showing a significant cisplatin‐induced muscle wasting, confirm that cisplatin treated rats can be considered a suitable and easily reproducible preclinical animal model of chemotherapy‐induced cachexia, as previously reported.23, 26, 31, 32, 33 Additionally, here we showed that the resting [Ca2+]i of EDL muscle after cisplatin administration was two‐fold increased in comparison with control rats. This finding represents a direct evidence of an altered calcium homeostasis condition associated to a cachectic state. The cisplatin‐induced dysfunction of skeletal muscle calcium homeostasis was characterized by a reduced response to the application of depolarizing solution or of caffeine as well as by a reduced SOCE. All these cisplatin‐induced effects can contribute to Ca2+ overloading in the cytoplasm of muscle cells ultimately detrimentally interfering with muscle maintenance and function. Indeed, the disruption of calcium homeostasis can cause inappropriate functionality of Ca2+‐dependent protease and phospholipases essential for various muscle functions. In this regard, it should be underlined that cancer cachexia patients have high plasma Ca2+ levels, and this increase is related to neuromuscular complications.56 Moreover, chemotherapy contributes to hypercalcaemia and leads to fatigue and impaired muscle function, as shown in tumour‐bearing mice treated with doxorubicin.57
Particularly, our results indicate an inadequate release of SR Ca2+ upon stimulation. Disrupted SR calcium homeostasis can induce SR stress in skeletal muscle cells because SR chaperons, important for maintaining SR calcium homeostasis, are Ca2+‐dependent. However, disrupted SR calcium signaling can also be a result of SR stress due to accumulation of unfolded proteins which perturb calcium ion gradients. SR calcium homeostasis is maintained by the SR calcium chaperons. For example, calsequestrin serves as the main calcium buffer in the SR of skeletal muscle cells and is therefore important for maintaining SR calcium‐storage.58 A down‐regulation of CALM genes encoding calmodulin isoforms have been reported in cachectic muscles.17 Further studies are needed to define the effect of cachexia on calcium chaperons to better understand the interplay between SR calcium signaling and SR stress to finally determine the early event responsible of the SR calcium disruption observed in cachectic muscles. Importantly, in various pathophysiological conditions such as ageing or muscular dystrophy, oxidation‐dependent modifications of RyR1 can increase SR Ca2+ leak, leading to an impaired SR Ca2+ release and a compromised muscle function.59, 60 Because cachexia is a pathological state characterized by a significantly increased oxidative stress,61, 62 we cannot rule‐out that RyR1 post‐translational modifications such as oxidation could take place also in our cachectic animal model, thus contributing to the observed compromised caffeine response, along with change in expression. The reduced Pgc1‐α gene expression in muscles of cisplatin treated animals could support this hypothesis.
Compared with control muscle, cachectic cisplatin treated muscle showed also a reduced SOCE. It is now ascertained that SOCE is fundamental for store repletion because it is a pivotal mechanism linking extracellular calcium entry and intracellular Ca2+ storage, especially for maintaining of SR Ca2+ store during the repetitive cycles of EC coupling.43 Thus, other than to a down‐regulation of RyR1 and Dhpr genes, the reduced voltage‐dependent and caffeine‐induced calcium release that we observed in cisplatin treated muscles, could be attributed to a SOCE reduction that could directly modulate Ca2+ storage leading to compromised SR Ca2+ release. Furthermore, in consideration of the interaction of Dhpr and RyRs, the observed alterations of SR response and of SOCE activity as well as of the related gene expression pattern (Dhpr, RyR1, Orai1 and Stim1), could compromise the EC coupling, thus leading to the typical impairment of muscle maintenance observed in cachexia. Accordingly, paralleling the changes in calcium homeostasis, some calcium‐dependent ex vivo functional outcomes such as Lat and gm were significantly altered. The dependence of these parameters on calcium homeostasis is due to the fact that the gm, which is critical for the maintenance of membrane stability at resting potential and consequently is a key determinant of muscle excitability, contains the macroscopic chloride conductance (gCl) as the largest component. Importantly, gCl is the electrical parameter sustained by the voltage‐gated chloride channel CLC‐1, which in turn is negatively regulated by the Ca2+‐dependent protein kinase C (PKC).63, 64 As it has been proposed for several conditions of muscle wasting,13, 44, 50, 51 the alteration of sarcolemma excitability may contribute to the mechanisms responsible for muscle tiredness and fatigue observed in patients undergoing chemotherapy,65 further corroborating the hypothesis that calcium dysfunction could be strictly related to cachectic muscle impairment.
Accordingly with the doses and regimen of cisplatin administration,37, 38 cisplatin treated rats did not show overt nephrotoxicity nor alteration of glycaemia and cortisolemia compared with control animals. Thus, we ruled out that potential electrolyte abnormalities or hyperglycemia and hypercortisolemia, usually associated with higher doses of cisplatin,37, 38 could affect muscle metabolism and function in our cachectic animal model.
4.1.2. Effects of GHS administration in preventing cisplatin‐induced muscle wasting
As summarized in Figure 10, here we also provide evidences that GHS treatments effectively prevent most of changes in parameters we determined in the cisplatin‐related muscle wasting model. Hexarelin or JMV2894 administration prevents cisplatin‐induced atrophy as indicated by the attenuated loss of body and muscle weight as well as of fibre CSA with respect to control animals. It seems that muscle wasting was strongly reduced under GHS treatment as indicated by histological analysis showing significant reduced damaged area for muscles of hexarelin or JMV2894 treated rats with respect to cisplatin treated animals. Because cachexia in our animal model was associated with a decrease in cumulative food intake that was partially prevented by GHS, it should be suggested that one of the mechanisms mediating the effects of hexarelin or JMV2894 is by decreasing anorexia. Nevertheless, the several effects mediated by GHS administration on gene expression and calcium homeostasis led to hypothesize that GHS could cause a plethora of effects probably due to a direct interference with skeletal muscle. Particularly, while JMV2894 efficaciously prevents all cisplatin‐induced calcium homeostasis alterations, both in terms of calcium movements and gene expression of some calcium‐related proteins, hexarelin failed to restore caffeine responsiveness both as calcium transient upon stimulation and RyR1 gene expression. Such differences in the effects of JMV2894 and hexarelin were unexpected but not surprising. We have previously reported that minor modifications in the chemical structure of synthetic GHS could dramatically affect their ability to stimulate GH secretion and food intake. In particular, several in vivo experiments clearly demonstrated that the stimulation of GH secretion could divorce from the stimulation of appetite.66, 67 Indeed, these results could be explained by postulating the ability of synthetic GHS to interact not only with the GHS‐R1a but also with some other still unknown receptors. Nevertheless, the different molecular structure of the GHS under investigation in our study could account for the different efficacy on caffeine responsiveness, because, as we previously reported,28 GHS differently affect skeletal muscle calcium homeostasis in dependence on their peptidyl or non‐peptidyl structure. In contrast to the peptidyl structure of hexarelin, JMV2894 is a peptidomimetic compound containing the 1,2,4‐triazole scaffold as mimetic of the cis‐configuration of amide.35, 36 Given the smaller molecular size of JMV2894, a direct interference with RyR1 protein could be plausible. In this regard, novel drugs called Rycals that are capable of inhibiting the SR Ca2+ leak due to oxidation are proposed in therapy to improve muscle function in pathological intracellular Ca2+ leak conditions,59, 60 including muscle weakness associated with bone metastasis in mice.68 A RyR stabilizers‐like activity could be hypothesized for JMV2894, thus justifying the beneficial effect on SR responsiveness to caffeine observed in JMV2894 treated rats.
Figure 10.
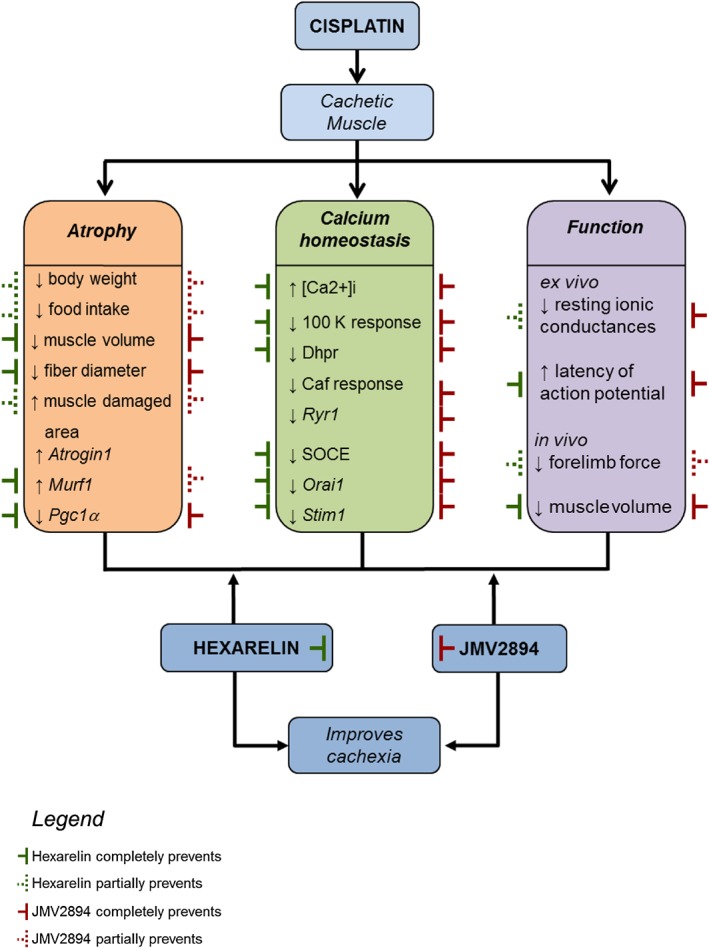
Schematic overview of the cisplatin‐induced skeletal muscle alterations and of GHS mediated countermeasure effects. The cachectic cisplatin muscle fibres are characterized by the alteration (↑ increase, ↓ decrease) of various parameters regarding atrophy, calcium homeostasis and function. Hexarelin ( ) or JMV2894 (
 ) partially (dashed line) or fully (continuous line) prevents cisplatin‐induced effects.
As far as the expression of atrogenes is concerned, we find that both GHS failed to prevent cisplatin‐induced up‐regulation of atrogin1, while they resulted completely or partially efficacious in preventing any modification of Murf1 expression. These findings suggest that the improved cachectic condition induced by GHS is not solely dependent on Murf1 but could involve other proteins. In this regard, PGC‐1α can play a key role. The PGC‐1α/PPAR signaling pathway has been shown to be a key regulator pathway controlling muscle oxidative phenotype.69 Loss of skeletal muscle oxidative phenotype is observed in many disease associated with chronic low‐grade systemic inflammation including chronic obstructive pulmonary disease and chronic heart failure. Although the exact mechanism underlying reductions in Pgc‐1α expression induced by cisplatin remain to be elucidated, the capability of GHS to restore the Pgc‐1α level also over the control value could provide a potential GHS mediated mechanism leading to the prevention of muscle atrophy. Activated PGC‐1α controls the expression of genes encoding proteins involved in mitochondrial biogenesis, oxidative phosphorylation and other features of oxidative muscle fibres.70 Furthermore, it has been recently reported that PGC‐1α molecule inhibit activation of the classical NF‐κB pathway.71 The increase of PGC‐1α expression translate into improvement of symptoms in different muscle wasting condition as shown for Duchenne muscular dystrophy, sarcopenia, statins‐induced fibre atrophy.72, 73, 74 Moreover, it has also been shown a functional role of PGC‐1α in protection against catabolic muscle wasting in cardiac cachexia.75 Based on the notion that cachexia is a multifactorial pathological condition often characterized by inflammation,76 the activation of the PGC‐1α signaling cascade induced by GHS could not only improve muscle oxidative phenotype but also alleviate muscle inflammatory status, thus finally preventing the atrophy‐associated damage characterizing the cisplatin treated cachectic rats. Of note, although we did not reveal any significant difference in the expression of Eno3 and Mef2D among animal groups, it not should be excluded also the involvement of other phenotype and metabolism‐related genes in GHS mediated effects.
Autophagy was listed among the molecular mechanisms leading to cachexia.61, 62 Our findings regarding the two hallmarks of autophagy such as LC3 and BNIP3, showed no significant gene expression alteration between animal groups thus indicating no significant involvement of these pathways in cisplatin‐induced muscle damage or GHS mechanism of action.
At last, hexarelin or JMV2894 treatment, with different degree, was also associated with the improvement of two calcium‐dependent ex vivo functional outcomes such as gm and Lat. The beneficial effects on gm and Lat could be mainly due to the capability of both GHS to counteract the increase in resting [Ca2+]i induced by cisplatin treatment.
4.1.3. Impact of GHS‐mediated effects on muscle function
The differential effects mediated by the two GHS on the gene expression profile and on the calcium homeostasis biomarkers suggest that they could produce beneficial effects on muscle wasting through common as well as specific mechanism of action (summarized Figure 10). In vivo investigation of some structural and functional muscle outcomes allowed us to correlate the calcium homeostasis impairment induced by cisplatin with muscle function performance alteration, and to evaluate the functional impact of GHS therapeutic intervention. Indeed, rats treated with cisplatin showed a reduced forelimb force thus indicating a tiredness‐related decrease in muscle function of this animal group. Both GHS partially prevented the muscle force reduction, highlighting the idea that the prevention of calcium homeostasis alteration mediated by GHS could contribute to preserve in vivo muscle function in cachectic patients. Furthermore, non‐invasive ultrasonographic investigation showed an in vivo reduction of the volume of the hindlimb muscles in cisplatin treated rats, further suggesting the occurrence of the skeletal muscle atrophy in our animal model of cachexia and further supporting the beneficial GHS effects at this level.
5. Conclusions
Our findings support the notion that calcium homeostasis dysfunction could be listed among the pathological features of chemotherapy‐induced cachexia. Further studies are needed to assess whether this observed calcium homeostasis dysregulation is a cause or a downstream consequence of the pathological processes involved in cachexia. Finally, according with the multi‐actions recently proposed for ghrelin and GHS,26, 77, 78 our demonstration that GHS administration efficaciously prevents cisplatin‐induced calcium homeostasis alteration in skeletal muscle point out to a new molecular mechanism to counteract chemotherapy‐associated cachexia finally contributing to gain insight into the therapeutic mechanisms mediated by GHS.
Conflict of interest
Elena Conte, Giulia Maria Camerino, Antonietta Mele, Michela De Bellis, Sabata Pierno, Francesco Rana, Adriano Fonzino, Roberta Caloiero, Arcangela Giustino, Laura Rizzi, Elena Bresciani, Khoubaib Ben Haj Salah, Jean‐Alain Fehrentz, Jean Martinez, Mara Addolorata Mariggiò, Mauro Coluccia, Domenico Tricarico, Marcello Diego Lograno, Annamaria De Luca, Antonio Torsello, Diana Conte and Antonella Liantonio declare that they have no conflict of interest.
Supporting information
Figure S1. Representative ultrasonographic images of truncated cone calculation method of FDL muscle volumes. Proximal (A) and distal (B) acquisitions of the FDL muscle are reported. In cyan are visualized the blood vessel (vein) used as marker to divide the FDL muscle in distal and proximal parts and the measurement lines used to calculate the FDL muscle volume using the truncated‐cone formula. Images were acquired by B‐mode. Probe: MS550D (VisualSonics, Fujifilm, Toronto).
Figure S2. Cumulative food intake normalized to body weight. Cumulative food intake normalized to individual rat body weight from day 0–1 (prior to beginning of the treatments) to day 4–5. Each bar is the mean ± SEM from six to eight rats. Statistical analysis by Kruskal–Wallis test showed no significant difference in cumulative food intake.
Figure S3. Expression of genes related to muscle regeneration process. Bars show quantification of transcript levels with qPCR for MyoD and Pax7 genes normalized by the β‐actin gene in EDL muscle from control rats, cisplatin, cisplatin + hexarelin and cisplatin + JMV2894 treated rats. For each gene, transcript levels were determined in EDL muscle of at least five animals for each group of rat. Statistical analysis by ANOVA showed no significant difference. Ctr, control rats; Cis, cisplatin treated rats; Cis + H, cisplatin + hexarelin tretated rats; Cis + JMV, cisplatin + JMV2894 treated rats.
Supplemental Table 1. List of gene expression assay
Supplemental Table 2. Serum biochemical parameters
Supplemental Table 3. Urinary biochemical parameters
Acknowledgements
This work was supported by Università degli Studi di Bari “Aldo Moro” (Project “Fondi Ateneo 2012” to AL) and by Duchenne Parent Project NL (Project 2015 to ADL).
The authors certify that they comply with the ethical guidelines for authorship and publishing of the Journal of Cachexia, Sarcopenia and Muscle.79
Conte, E. , Camerino, G. M. , Mele, A. , De Bellis, M. , Pierno, S. , Rana, F. , Fonzino, A. , Caloiero, R. , Rizzi, L. , Bresciani, E. , Ben Haj Salah, K. , Fehrentz, J.‐A. , Martinez, J. , Giustino, A. , Mariggiò, M. A. , Coluccia, M. , Tricarico, D. , Lograno, M. D. , De Luca, A. , Torsello, A. , Conte, D. , and Liantonio, A. (2017) Growth hormone secretagogues prevent dysregulation of skeletal muscle calcium homeostasis in a rat model of cisplatin‐induced cachexia. Journal of Cachexia, Sarcopenia and Muscle, 8: 386–404. doi: 10.1002/jcsm.12185.
References
- 1. Fearon K, Strasser F, Anker SD, Bosaeus I, Bruera E, Fainsinger RL, et al. Definition and classification of cancer cachexia: an international consensus. Lancet Oncol 2011;12:489–495. [DOI] [PubMed] [Google Scholar]
- 2. Argilés JM, Busquets S, Stemmler B, López‐Soriano FJ. Cancer cachexia: understanding the molecular basis. Nat Rev Cancer 2014;14:754–762. [DOI] [PubMed] [Google Scholar]
- 3. Argilés JM, Fontes‐Oliveira CC, Toledo M, López‐Soriano FJ, Busquets S. Cachexia: a problem of energetic inefficiency. J Cachexia Sarcopenia Muscle 2014;5:279–286. [DOI] [PMC free article] [PubMed] [Google Scholar]
- 4. Fearon KC, Glass DJ, Guttridge DC. Cancer cachexia: mediators, signaling, and metabolic pathways. Cell Metab 2012;16:153–166. [DOI] [PubMed] [Google Scholar]
- 5. Berchtold MW, Brinkmeier H, Müntener M. Calcium ion in skeletal muscle: its crucial role for muscle function, plasticity, and disease. Physiol Rev 2000;80:1215–1265. [DOI] [PubMed] [Google Scholar]
- 6. Tu MK, Levin JB, Hamilton AM, Borodinsky LN. Calcium signaling in skeletal muscle development, maintenance and regeneration. Cell Calcium 2016;59:91–97. [DOI] [PMC free article] [PubMed] [Google Scholar]
- 7. Costelli P, Reffo P, Penna F, Autelli R, Bonelli G, Baccino FM. Ca(2+)‐dependent proteolysis in muscle wasting. Int J Biochem Cell Biol 2005;37:2134–2146. [DOI] [PubMed] [Google Scholar]
- 8. Sorimachi H, Ono Y. Regulation and physiological roles of the calpain system in muscular disorders. Cardiovasc Res 2012;96:11–22. [DOI] [PMC free article] [PubMed] [Google Scholar]
- 9. Fraysse B, Desaphy JF, Rolland JF, Pierno S, Liantonio A, Giannuzzi V, et al. Fiber type‐related changes in rat skeletal muscle calcium homeostasis during aging and restoration by growth hormone. Neurobiol Dis 2006;21:372–380. [DOI] [PubMed] [Google Scholar]
- 10. Pierno S, Tricarico D, Liantonio A, Mele A, Digennaro C, Rolland JF, et al. An olive oil‐derived antioxidant mixture ameliorates the age‐related decline of skeletal muscle function. Age (Dordr) 2014;36:73–88. [DOI] [PMC free article] [PubMed] [Google Scholar]
- 11. Fraysse B, Desaphy JF, Pierno S, De Luca A, Liantonio A, Mitolo CI, et al. Decrease in resting calcium and calcium entry associated with slow‐to‐fast transition in unloaded rat soleus muscle. FASEB J 2003;17:1916–1918. [DOI] [PubMed] [Google Scholar]
- 12. Camerino GM, Pierno S, Liantonio A, De Bellis M, Cannone M, Sblendorio V, et al. Effects of pleiotrophin overexpression on mouse skeletal muscles in normal loading and in actual and simulated microgravity. PLoS One 2013;8: .e72028 [DOI] [PMC free article] [PubMed] [Google Scholar]
- 13. Liantonio A, Camerino GM, Scaramuzzi A, Cannone M, Pierno S, De Bellis M, et al. Calcium homeostasis is altered in skeletal muscle of spontaneously hypertensive rats: cytofluorimetric and gene expression analysis. Am J Pathol 2014;184:2803–2815. [DOI] [PubMed] [Google Scholar]
- 14. Fraysse B, Liantonio A, Cetrone M, Burdi R, Pierno S, Frigeri A, et al. The alteration of calcium homeostasis in adult dystrophic mdx muscle fibers is worsened by a chronic exercise in vivo. Neurobiol Dis 2004;17:144–154. [DOI] [PubMed] [Google Scholar]
- 15. Liantonio A, Giannuzzi V, Cippone V, Camerino GM, Pierno S, Camerino DC. Fluvastatin and atorvastatin affect calcium homeostasis of rat skeletal muscle fibers in vivo and in vitro by impairing the sarcoplasmic reticulum/mitochondria Ca2 + −release system. J Pharmacol Exp Ther 2007;321:626–634. [DOI] [PubMed] [Google Scholar]
- 16. Cetrone M, Mele A, Tricarico D. Effects of the antidiabetic drugs on the age‐related atrophy and sarcopenia associated with ditabetes type II. Curr Diabetes Rev 2014;10:231–237. [DOI] [PubMed] [Google Scholar]
- 17. Fontes‐Oliveira CC, Busquets S, Fuster G, Ametller E, Figueras M, Olivan M, et al. A differential pattern of gene expression in skeletal muscle of tumor‐bearing rats reveals dysregulation of excitation–contraction coupling together with additional muscle alterations. Muscle Nerve 2014;49:233–248. [DOI] [PubMed] [Google Scholar]
- 18. Isaac ST, Tan TC, Polly P. Endoplasmic Reticulum Stress, Calcium Dysregulation and Altered Protein Translation: Intersection of Processes that Contribute to Cancer Cachexia Induced Skeletal Muscle Wasting. Curr Drug Targets 2016;17:1140–1146. [DOI] [PubMed] [Google Scholar]
- 19. Argilés JM, Stemmler B. The potential of ghrelin in the treatment of cancer cachexia. Expert Opin Biol Ther 2013;13:67–76. [DOI] [PubMed] [Google Scholar]
- 20. von Haehling S, Anker SD. Treatment of cachexia: An overview of recent developments. Int J Cardiol 2015;184:736–742. [DOI] [PubMed] [Google Scholar]
- 21. Cordido F, Isidro ML, Nemiña R, Sangiao‐Alvarellos S. Ghrelin and growth hormone secretagogues, physiological and pharmacological aspect. Curr Drug Discov Technol 2009;6:34–42. [DOI] [PubMed] [Google Scholar]
- 22. Kos K, Harte AL, O'Hare PJ, Kumar S, McTernan PG. Ghrelin and the differential regulation of des‐acyl (DSG) and oct‐anoyl ghrelin (OTG) in human adipose tissue (AT). Clin Endocrinol (Oxf) 2009;70:383–389. [DOI] [PubMed] [Google Scholar]
- 23. Garcia JM, Scherer T, Chen JA, Guillory B, Nassif A, Papusha V, et al. Inhibition of cisplatin‐induced lipid catabolism and weight loss by ghrelin in male mice. Endocrinology 2013;154:3118–3129. [DOI] [PMC free article] [PubMed] [Google Scholar]
- 24. Filigheddu N, Gnocchi VF, Coscia M, Cappelli M, Porporato PE, Taulli R, et al. Ghrelin and des‐acyl ghrelin promote differentiation and fusion of C2C12 skeletal muscle cells. Mol Biol Cell 2007;18:986–994. [DOI] [PMC free article] [PubMed] [Google Scholar]
- 25. Porporato PE, Filigheddu N, Reano S, Ferrara M, Angelino E, Gnocchi VF, et al. Acylated and unacylated ghrelin impair skeletal muscle atrophy in mice. J Clin Invest 2013;123:611–622. [DOI] [PMC free article] [PubMed] [Google Scholar]
- 26. Chen JA, Splenser A, Guillory B, Luo J, Mendiratta M, Belinova B, et al. Ghrelin prevents tumour‐ and cisplatin‐induced muscle wasting: characterization of multiple mechanisms involved. J Cachexia Sarcopenia Muscle 2015;6:132–143. [DOI] [PMC free article] [PubMed] [Google Scholar]
- 27. Pierno S, De Luca A, Desaphy JF, Fraysse B, Liantonio A, Didonna MP, et al. Growth hormone secretagogues modulate the electrical and contractile properties of rat skeletal muscle through a ghrelin‐specific receptor. Br J Pharmacol 2003;139:575–584. [DOI] [PMC free article] [PubMed] [Google Scholar]
- 28. Liantonio A, Gramegna G, Carbonara G, Sblendorio VT, Pierno S, Fraysse B, Giannuzzi V, Rizzi L, Torsello A, Camerino DC. Growth hormone secretagogues exert differential effects on skeletal muscle calcium homeostasis in male rats depending on the peptidyl/nonpeptidyl structure. Endocrinology 2013;154:3764–3775. [DOI] [PubMed] [Google Scholar]
- 29. Bennani‐Baiti N, Walsh D. Animal models of the cancer anorexia‐cachexia syndrome. Support Care Cancer 2011;19:1451–1463. [DOI] [PubMed] [Google Scholar]
- 30. Penna F, Busquets S, Argilés JM. Experimental cancer cachexia: Evolving strategies for getting closer to the human scenario. Semin Cell Dev Biol 2015;54:20–27. [DOI] [PubMed] [Google Scholar]
- 31. Garcia JM, Cata JP, Dougherty PM, Smith RG. Ghrelin prevents cisplatin‐induced mechanical hyperalgesia and cachexia. Endocrinology 2008;149:455–460. [DOI] [PMC free article] [PubMed] [Google Scholar]
- 32. Sakai H, Sagara A, Arakawa K, Sugiyama R, Hirosaki A, Takase K, et al. Mechanisms of cisplatin‐induced muscle atrophy. Toxicol Appl Pharmacol 2014;278:190–199. [DOI] [PubMed] [Google Scholar]
- 33. Whirledge SD, Garcia JM, Smith RG, Lamb DJ. Ghrelin partially protects against cisplatin‐induced male murine gonadal toxicity in a GHSR‐1a‐dependent manner. Biol Reprod 2015;92:76, doi:10.1095/biolreprod. [DOI] [PMC free article] [PubMed] [Google Scholar]
- 34. Deghenghi R, Cananzi MM, Torsello A, Battisti C, Muller EE, Locatelli V. GH‐releasing activity of Hexarelin, a new growth hormone releasing peptide, in infant and adult rats. Life Sci 1994;54:1321–1328. [DOI] [PubMed] [Google Scholar]
- 35. Demange L, Boeglin D, Moulin A, Mousseaux D, Ryan J, Bergé G, Gagne D, Heitz A, Perrissoud D, Locatelli V, Torsello A, Galleyrand JC, Fehrentz JA, Martinez J. Synthesis and pharmacological in vitro and in vivo evaluations of novel triazole derivatives as ligands of the ghrelin receptor. J Med Chem 2007;50:1939–1957. [DOI] [PubMed] [Google Scholar]
- 36. Moulin A, Demange L, Bergé G, Gagne D, Ryan J, Mousseaux D, Heitz A, Perrissoud D, Locatelli V, Torsello A, Galleyrand JC, Fehrentz JA, Martinez J. Toward potent ghrelin receptor ligands based on trisubstituted 1,2,4‐triazole structure. 2. Synthesis and pharmacological in vitro and in vivo evaluations. J Med Chem 2007;50:5790–5806. [DOI] [PubMed] [Google Scholar]
- 37. Dickey DT, Wu YJ, Muldoon LL, Neuwelt EA. Protection against cisplatin‐induced toxicities by N‐acetylcysteine and sodium thiosulfate as assessed at the molecular, cellular, and in vivo levels. J Pharmacol Exp Ther 2005;314:1052–1058. [DOI] [PubMed] [Google Scholar]
- 38. Dickey DT, Muldoon LL, Doolittle ND, Peterson DR, Kraemer DF, Neuwelt EA. Effect of N‐acetylcysteine route of administration on chemoprotection against cisplatin‐induced toxicity in rat models. Cancer Chemother Pharmacol 2008;62:235–241. [DOI] [PMC free article] [PubMed] [Google Scholar]
- 39. De Luca A, Pierno S, Liantonio A, Cetrone M, Camerino C, Fraysse B, et al. Enhanced dystrophic progression in mdx mice by exercise and beneficial effects of taurine and insulin‐like growth factor‐1. J Pharmacol Exp Ther 2003;304:453–463. [DOI] [PubMed] [Google Scholar]
- 40. Mele A, Fonzino A, Rana F, Camerino GM, De Bellis M, Conte E, et al. In vivo longitudinal study of rodent skeletal muscle atrophy using ultrasonography. Sci Rep 2016;6:20061. [DOI] [PMC free article] [PubMed] [Google Scholar]
- 41. Tomlinson DJ, Erskine RM, Winwood K, Morse CI, Onambèlè GL. The impact of obesity on skeletal muscle architecture in untrained young vs. old women. J Anat 2014;225:675–684. [DOI] [PMC free article] [PubMed] [Google Scholar]
- 42. Grynkiewicz G, Poenie M, Tsien RY. A new generation of Ca2+ indicators with greatly improved fluorescence properties. J Biol Chem 1985;260:3440–3450. [PubMed] [Google Scholar]
- 43. Kurebayashi N, Ogawa Y. Depletion of Ca2+ in the sarcoplasmic reticulum stimulates Ca2+ entry into mouse skeletal muscle fibres. J Physiol 2001;533:185–199. [DOI] [PMC free article] [PubMed] [Google Scholar]
- 44. Pierno S, Liantonio A, Camerino GM, De Bellis M, Cannone M, Gramegna G, et al. Potential benefits of taurine in the prevention of skeletal muscle impairment induced by disuse in the hindlimb‐unloaded rat. Potential benefits of taurine in the prevention of skeletal muscle impairment induced by disuse in the hindlimb‐unloaded rat. Amino Acids 2012;43:431–445. [DOI] [PubMed] [Google Scholar]
- 45. Mele A, Buttiglione M, Cannone G, Vitiello F, Camerino DC, Tricarico D. Opening/blocking actions of pyruvate kinase antibodies on neuronal and muscular KATP channels. Pharmacol Res 2012;66:401–408. [DOI] [PubMed] [Google Scholar]
- 46. Bustin SA, Benes V, Garson JA, Hellemans J, Huggett J, Kubista M, et al. The MIQE guidelines: minimum information for publication of quantitative real‐time PCR experiments. Clin Chem 2009;55:611–622. [DOI] [PubMed] [Google Scholar]
- 47. Tricarico D, Mele A, Camerino GM, Bottinelli R, Brocca L, Frigeri A, et al. The KATP channel is a molecular sensor of atrophy in skeletal muscle. J Physiol 2010;588:773–784. [DOI] [PMC free article] [PubMed] [Google Scholar]
- 48. Mele A, Camerino GM, Calzolaro S, Cannone M, Conte D, Tricarico D. Dual response of the KATP channels to staurosporine: a novel role of SUR2B, SUR1 and Kir6.2 subunits in the regulation of the atrophy in different skeletal muscle phenotypes. Biochem Pharmacol 2014;91:266–275. [DOI] [PubMed] [Google Scholar]
- 49. He WA, Berardi E, Cardillo VM, Acharyya S, Aulino P, Thomas‐Ahner J, et al. NF‐κB‐mediated Pax7 dysregulation in the muscle microenvironment promotes cancer cachexia. J Clin Invest 2013;123:4821–4835. [DOI] [PMC free article] [PubMed] [Google Scholar]
- 50. Desaphy JF, Pierno S, Liantonio A, Giannuzzi V, Digennaro C, Dinardo MM, et al. Antioxidant treatment of hindlimb‐unloaded mouse counteracts fiber type transition but not atrophy of disused muscles. Pharmacol Res 2010;61:553–563. [DOI] [PubMed] [Google Scholar]
- 51. Camerino GM, Desaphy JF, De Bellis M, Capogrosso RF, Cozzoli A, Dinardo MM, et al. Effects of Nandrolone in the Counteraction of Skeletal Muscle Atrophy in a Mouse Model of Muscle Disuse: Molecular Biology and Functional Evaluation. PLoS One 2015;10: doi:10.1371/journal.pone.0129686.e0129686 [DOI] [PMC free article] [PubMed] [Google Scholar]
- 52. Ariano MA, Armstrong RB, Edgerton VR. Hindlimb muscle fiber populations of five mammals. J Histochem Cytochem 1973;21:51–55. [DOI] [PubMed] [Google Scholar]
- 53. Cooper C, Burden ST, Cheng H, Molassiotis A. Understanding and managing cancer‐related weight loss and anorexia: insights from a systematic review of qualitative research. J Cachexia Sarcopenia Muscle 2015;6:99–111. [DOI] [PMC free article] [PubMed] [Google Scholar]
- 54. White JP, Baltgalvis KA, Puppa MJ, Sato S, Baynes JW, Carson JA. Muscle oxidative capacity during IL‐6‐dependent cancer cachexia. Am J Physiol Regul Integr Comp Physiol 2011;300:R201–R211. [DOI] [PMC free article] [PubMed] [Google Scholar]
- 55. Puppa MJ, Murphy EA, Fayad R, Hand GA, Carson JA. Cachectic skeletal muscle response to a novel bout of low‐frequency stimulation. J Appl Physiol 2014;116:1078–1087. [DOI] [PMC free article] [PubMed] [Google Scholar]
- 56. Fujimoto‐Ouchi K, Onuma E, Shirane M, Mori K, Tanaka Y. Capecitabine improves cancer cachexia and normalizes IL‐6 and PTHrP levels in mouse cancer cachexia models. Cancer Chemother Pharmacol 2007;59:807–815. [DOI] [PubMed] [Google Scholar]
- 57. van Norren K, van Helvoort A, Argilés JM, van Tuijl S, Arts K, Gorselink M, et al. Direct effects of doxorubicin on skeletal muscle contribute to fatigue. Br J Cancer 2009;100:311–314. [DOI] [PMC free article] [PubMed] [Google Scholar]
- 58. Beard NA, Casarotto MG, Wei L, Varsányi M, Laver DR, Dulhunty AF. Regulation of ryanodine receptors by calsequestrin: effect of high luminal Ca2+ and phosphorylation. Biophys J 2005;88:3444–3454. [DOI] [PMC free article] [PubMed] [Google Scholar]
- 59. Bellinger AM, Reiken S, Dura M, Murphy PW, Deng SX, Landry DW, et al. Remodeling of ryanodine receptor complex causes “leaky” channels: a molecular mechanism for decreased exercise capacity. Proc Natl Acad Sci U S A 2008;105:2198–2202. [DOI] [PMC free article] [PubMed] [Google Scholar]
- 60. Andersson DC, Betzenhauser MJ, Reiken S, Meli AC, Umanskaya A, Xie W, et al. Ryanodine receptor oxidation causes intracellular calcium leak and muscle weakness in aging. Cell Metab 2011;14:196–207. [DOI] [PMC free article] [PubMed] [Google Scholar]
- 61. Bowen TS, Schuler G, Adams V. Skeletal muscle wasting in cachexia and sarcopenia: molecular pathophysiology and impact of exercise training. J Cachexia Sarcopenia Muscle 2015;6:197–207. [DOI] [PMC free article] [PubMed] [Google Scholar]
- 62. Carson JA, Hardee JP, Vander Veen BN. The emerging role of skeletal muscle oxidative metabolism as a biological target and cellular regulator of cancer‐induced muscle wasting. Semin Cell Dev Biol 2015;54:53–67. [DOI] [PMC free article] [PubMed] [Google Scholar]
- 63. Rosenbohm A, Rudel R, Fahlke C. Regulation of the human skeletal muscle chloride channel hClC‐1 by protein kinase C. J Physiol 1999;514:677–685. [DOI] [PMC free article] [PubMed] [Google Scholar]
- 64. Pierno S, Desaphy JF, Liantonio A, De Luca A, Zarrilli A, Mastrofrancesco L, et al. Disuse of rat muscle in vivo reduces protein kinase C activity controlling the sarcolemma chloride conductance. J Physiol 2007;584:983–995. [DOI] [PMC free article] [PubMed] [Google Scholar]
- 65. Pearson EJ, Morris ME, di Stefano M, McKinstry CE. Interventions for cancer‐related fatigue: a scoping review. Eur J Cancer Care (Engl) 2016. Jun 2;doi:10.1111/ecc.12516 [Epub ahead of print]. [DOI] [PubMed] [Google Scholar]
- 66. Torsello A, Luoni M, Schweiger F, Grilli R, Guidi M, Bresciani E, et al. Novel hexarelin analogs stimulate feeding in the rat through a mechanism not involving growth hormone release. Eur J Pharmacol 1998;360:123–129. [DOI] [PubMed] [Google Scholar]
- 67. Torsello A, Locatelli V, Melis MR, Succu S, Spano MS, Deghenghi R, et al. Differential orexigenic effects of hexarelin and its analogs in the rat hypothalamus: indication for multiple growth hormone secretagogue receptor subtypes. Neuroendocrinology 2000;72:327–332. [DOI] [PubMed] [Google Scholar]
- 68. Waning DL, Mohammad KS, Reiken S, Xie W, Andersson DC, John S, Chiechi A, Wright LE, Umanskaya A, Niewolna M, Trivedi T, Charkhzarrin S, Khatiwada P, Wronska A, Haynes A, Benassi MS, Witzmann FA, Zhen G, Wang X, Cao X, Roodman GD, Marks AR, Guise TA. Excess TGF‐β mediates muscle weakness associated with bone metastases in mice. Nat Med 2015;21:1262–1271. [DOI] [PMC free article] [PubMed] [Google Scholar]
- 69. Luquet S, Lopez‐Soriano J, Holst D, Fredenrich A, Melki J, Rassoulzadegan M, et al. Peroxisome proliferator‐activated receptor delta controls muscle development and oxidative capability. FASEB J 2003;17:2299–2301. [DOI] [PubMed] [Google Scholar]
- 70. Puigserver P, Adelmant G, Wu Z, Fan M, Xu J, O'Malley B, et al. Activation of PPARγ coactivator‐1 through transcription factor docking. Science 1999;286:1368–1371. [DOI] [PubMed] [Google Scholar]
- 71. Eisele PS, Salatino S, Sobek J, Hottiger MO, Handschin C. The peroxisome proliferator‐activated receptor γ coactivator 1α/β (PGC‐1) coactivators repress the transcriptional activity of NF‐κB in skeletal muscle cells. J Biol Chem 2013;288:2246–2260. [DOI] [PMC free article] [PubMed] [Google Scholar]
- 72. Camerino GM, Cannone M, Giustino A, Massari AM, Capogrosso RF, Cozzoli A, et al. Gene expression in mdx mouse muscle in relation to age and exercise: aberrant mechanical‐metabolic coupling and implications for pre‐clinical studies in Duchenne muscular dystrophy. Hum Mol Genet 2014;23:5720–5732. [DOI] [PubMed] [Google Scholar]
- 73. Sandri M, Lin J, Handschin C, Yang W, Arany ZP, Lecker SH, et al. PGC‐1α protects skeletal muscle from atrophy by suppressing FoxO3 action and atrophy‐specific gene transcription. Proc Natl Acad Sci U S A 2006;103:16260–16265. [DOI] [PMC free article] [PubMed] [Google Scholar]
- 74. Hanai J, Cao P, Tanksale P, Imamura S, Koshimizu E, Zhao J, et al. The muscle‐specific ubiquitin ligase atrogin‐1/MAFbx mediates statin‐induced muscle toxicity. J Clin Invest 2007;117:3940–3951. [DOI] [PMC free article] [PubMed] [Google Scholar]
- 75. Geng T, Li P, Yin X, Yan Z. PGC‐1α promotes nitric oxide antioxidant defenses and inhibits FOXO signaling against cardiac cachexia in mice. Am J Pathol 2011;178:1738–1748. [DOI] [PMC free article] [PubMed] [Google Scholar]
- 76. Onesti JK, Guttridge DC. Inflammation based regulation of cancer cachexia. Biomed Res Int 2014;2014:168407, doi:10.1155/2014/168407. [DOI] [PMC free article] [PubMed] [Google Scholar]
- 77. Akamizu T, Kangawa K. Ghrelin for cachexia. J Cachexia Sarcopenia Muscle 2010;1:169–176. [DOI] [PMC free article] [PubMed] [Google Scholar]
- 78. Garcia JM, Boccia RV, Graham CD, Yan Y, Duus EM, Allen S, et al. Anamorelin for patients with cancer cachexia: an integrated analysis of two phase 2, randomised, placebo‐controlled, double‐blind trials. Lancet Oncol 2015;16:108–116. [DOI] [PubMed] [Google Scholar]
- 79. von Haehling S, Morley JE, Coats AJS, Anker SD. Ethical guidelines for authorship and publishing in the Journal of Cachexia, Sarcopenia and Muscle. J Cachexia Sarcopenia Muscle 2015;6:315–316. [DOI] [PMC free article] [PubMed] [Google Scholar]
Associated Data
This section collects any data citations, data availability statements, or supplementary materials included in this article.
Supplementary Materials
Figure S1. Representative ultrasonographic images of truncated cone calculation method of FDL muscle volumes. Proximal (A) and distal (B) acquisitions of the FDL muscle are reported. In cyan are visualized the blood vessel (vein) used as marker to divide the FDL muscle in distal and proximal parts and the measurement lines used to calculate the FDL muscle volume using the truncated‐cone formula. Images were acquired by B‐mode. Probe: MS550D (VisualSonics, Fujifilm, Toronto).
Figure S2. Cumulative food intake normalized to body weight. Cumulative food intake normalized to individual rat body weight from day 0–1 (prior to beginning of the treatments) to day 4–5. Each bar is the mean ± SEM from six to eight rats. Statistical analysis by Kruskal–Wallis test showed no significant difference in cumulative food intake.
Figure S3. Expression of genes related to muscle regeneration process. Bars show quantification of transcript levels with qPCR for MyoD and Pax7 genes normalized by the β‐actin gene in EDL muscle from control rats, cisplatin, cisplatin + hexarelin and cisplatin + JMV2894 treated rats. For each gene, transcript levels were determined in EDL muscle of at least five animals for each group of rat. Statistical analysis by ANOVA showed no significant difference. Ctr, control rats; Cis, cisplatin treated rats; Cis + H, cisplatin + hexarelin tretated rats; Cis + JMV, cisplatin + JMV2894 treated rats.
Supplemental Table 1. List of gene expression assay
Supplemental Table 2. Serum biochemical parameters
Supplemental Table 3. Urinary biochemical parameters