

Abstract
OBJECTIVE
Recent studies have demonstrated that central line–associated bloodstream infections (CLABSIs) are preventable through implementation of evidence-based prevention practices. Hospitals have reported CLABSI data to the Centers for Disease Control and Prevention (CDC) since the 1970s, providing an opportunity to characterize the national impact of CLABSIs over time. Our objective was to describe changes in the annual number of CLABSIs in critical care patients in the United States.
DESIGN
Monte Carlo simulation.
SETTING
US acute care hospitals.
PATIENTS
Nonneonatal critical care patients.
METHODS
We obtained administrative data on patient-days for nearly all US hospitals and applied CLABSI rates from the National Nosocomial Infections Surveillance and the National Healthcare Safety Network systems to estimate the annual number of CLABSIs in critical care patients nationally during the period 1990–2010 and the number of CLABSIs prevented since 1990.
RESULTS
We estimated that there were between 462,000 and 636,000 CLABSIs in nonneonatal critical care patients in the United States during 1990–2010. CLABSI rate reductions led to between 104,000 and 198,000 fewer CLABSIs than would have occurred if rates had remained unchanged since 1990. There were 15,000 hospital-onset CLABSIs in nonneonatal critical care patients in 2010; 70% occurred in medium and large teaching hospitals.
CONCLUSIONS
Substantial progress has been made in reducing the occurrence of CLABSIs in US critical care patients over the past 2 decades. The concentration of critical care CLABSIs in medium and large teaching hospitals suggests that a targeted approach may be warranted to continue achieving reductions in critical care CLABSIs nationally.
Surveillance and prevention activities related to healthcare-associated infections (HAIs) have undergone enormous changes over the past several decades in the United States. The Centers for Disease Control and Prevention (CDC) began systematic collection of HAI data during the 1970s through the National Nosocomial Infections Surveillance (NNIS) system, to which volunteer hospitals routinely reported HAI surveillance data for aggregation in a national database.1 Through the 1990s the NNIS system expanded the use of common methods and measures, implemented standardized risk-adjustment techniques for HAI rates, and facilitated access to local data for action at healthcare facilities. In 2005, the CDC launched the National Healthcare Safety Network (NHSN) surveillance system, which integrates and expands components of the NNIS and several other healthcare epidemiology surveillance systems at the CDC.2 National HAI surveillance activities have grown rapidly under the NHSN through increases in voluntary participation, expansion of surveillance to a wider array of healthcare settings, mandatory reporting of HAIs in states, and Centers for Medicare and Medicaid Services (CMS) reporting incentives.3–5
Greater standardization of measures created a foundation for assessing the impact of HAI prevention strategies and helped stimulate the infection prevention community to develop and evaluate HAI prevention measures. Numerous technological innovations and prevention initiatives have been developed over time to prevent HAIs generally as well as central line-associated bloodstream infections (CLABSIs) specifically. These have included the introduction of alcohol-based hand rub into healthcare facilities, the use of antimicrobial catheters and chlorhexidine insertion site patches, and implementation of infection control bundles (ie, groups of interventions implemented simultaneously) utilizing collaborative networks of healthcare organizations to disseminate best practices.6–11 These successes helped bolster perceptions that HAIs are preventable.
Although data have been systematically collected on HAIs for several decades, quantification of changes in the number of HAIs occurring nationally over time is challenging due to implementation of refinements in surveillance methodology as well as changes in the types of facilities participating in surveillance. Given widespread efforts to prevent CLABSIs, especially in critical care settings, our objective was to estimate changes in the total number of CLABSIs in critical care patients nationally from 1990 to 2010 and the number of infections potentially prevented over that time period.
METHODS
Our conceptual approach for generating national estimates of the number of CLABSIs in hospitalized critical care patients involved several steps. We first obtained data on the total number of critical care patient-days in the United States each year (excluding neonates). Next, we obtained data on CLABSI rates in critical care units reporting data to the NNIS (1990–2004) and the NHSN (2006–2010), adjusting for changes in the CLABSI definition and surveillance participants over time as well as the possibility that bias was introduced when transitioning from the NNIS to the NHSN in 2005. We then applied adjusted critical care CLABSI rates to national patient-day denominators to estimate the annual number of critical care CLABSIs. Analyses were conducted using SAS, version 9.1 (SAS Institute), and @Risk for Excel, version 5.7 (Palisade).
Patient-Day Denominators
CMS hospital cost reports provide data on patient-days occurring in critical care units in all Medicare-certified US hospitals.12 We obtained CMS hospital cost reports for 1990–2009 and used information from all 20 years of reports to classify hospitals into major types: small (less than 200 beds) teaching, medium (201–500 beds) teaching, large (more than 500 beds) teaching, small nonteaching, medium nonteaching, and large nonteaching. Patient-day estimates from the hospital cost report were inflated by between 5% and 10% each year because federal hospitals do not file hospital cost reports with the CMS. This inflation factor was estimated from the annual ratio of all patient-days to nonfederal patient-days reported to the American Hospital Association13 by means of a weighted linear regression model. We used linear spline regression to project critical care patient-days forward to 2010 (2009 was the most recent complete data year) and to generate standard errors around annual patient-day estimates for these 6 acute care hospital types.
CLABSI Definition Change
NHSN CLABSI criterion 2b—which considered patients to have a CLABSI if they had an intravascular line, had signs or symptoms of infection, had a common commensal organism cultured from at least 1 blood sample, and had appropriate antimicrobial therapy initiated by a physician—was eliminated on January 1, 2008.14 We analyzed 2006 and 2007 NHSN data to estimate the proportion of CLABSIs that were reported via this criterion for each of the 6 hospital types by means of logistic regression. For all NNIS and NHSN years prior to 2008, the number of reported CLABSIs was discounted by this proportion to estimate the number of CLABSIs that would have been reported had the 2008 definition been used for all years.
Changes in CLABSI Surveillance Participants
We constructed a negative binomial model for each hospital type on the basis of data reported to the NNIS and NHSN from critical care units during the period 1990–2010 to generate annual estimated critical care CLABSI rates in cases per 1,000 patient-days. Each model included a term for year, a term for whether the data came from the NNIS or NHSN system, and a product term that allowed annual rate changes to differ between the NNIS and NHSN periods. To adjust for changes in the types of hospitals reporting data, an average of the 6 predicted CLABSI rates was calculated each year, weighted by the estimated number of national critical care patient-days occurring in each of the 6 hospital types (ie, annual CLABSI rates were standardized to the estimated national distribution of critical care patient-days by hospital type).
Transition from the NNIS to the NHSN
After adjusting for the CLABSI definition change and changes in surveillance participants, we constructed 3 scenarios to address the possibility that the transition from the NNIS to the NHSN could have biased the assessment of changes in CLABSI rates over time. In scenario 1, we considered the predicted critical care CLABSI rates to be an unbiased reflection of the annual CLABSI rates for all critical care units in US hospitals, with no adjustments made to CLABSI rates in NNIS years. In scenario 2, we systematically reduced NNIS rates during the period 1990–2004 to force the percent change in rates between 2004 and 2006 to be consistent with the average annual changes in critical care CLABSI rates observed during 1990–2004, essentially considering any excess reduction in CLABSI rates between 2004 and 2006 to be a surveillance artifact. In scenario 3, we discounted NNIS rates by only half of the discount applied in scenario 2.
Annual Number of CLABSIs and Infections Prevented for 3 Scenarios
For each of the 3 scenarios, the annual number of CLABSIs was calculated by applying annual critical care CLABSI rates (adjusted for definition and participation changes) to the estimated number of critical care patient-days nationally each year.
To estimate the number of critical care CLABSIs potentially prevented each year, we compared the estimated annual number of CLABSIs to an estimate produced assuming that there was no change in hospital type-specific CLABSI rates after 1990; this reflects an estimate of what would have occurred each year if no additional changes had occurred in critical care CLABSI rates since 1990 in each of the 6 hospital types.
Monte Carlo Simulation
We used Monte Carlo simulation to quantify the uncertainty around all estimates presented in this analysis. Input distributions were created using predicted values and standard errors from the linear models (patient-days and federal inflation factor), logistic model (CLABSI definition change), and negative binomial models (CLABSI rates) described above. We sampled values from each of the input distributions in 10,000 simulation cycles and used the sampled values to calculate CLABSI estimates for each cycle. We calculated 95% credible intervals on the basis of the 2.5th and 97.5th percentiles of all output distributions.
RESULTS
Patient-Day Denominators
The estimated national number of critical care patient-days (excluding neonates) in acute care hospitals dropped from an estimated 19.9 million (95% credible interval, 19.1–20.7 million) in 1990 to 16.9 million (16.2–17.6 million) in 1996 before rising to 21.6 million (20.0–23.1 million) in 2010 (Figure 1). The largest total numbers of patient-days in 2010 were observed in medium and large teaching hospitals, with 7.1 million (6.6–7.6 million) and 5.7 million (5.3–6.1 million) patient-days, respectively.
FIGURE 1.
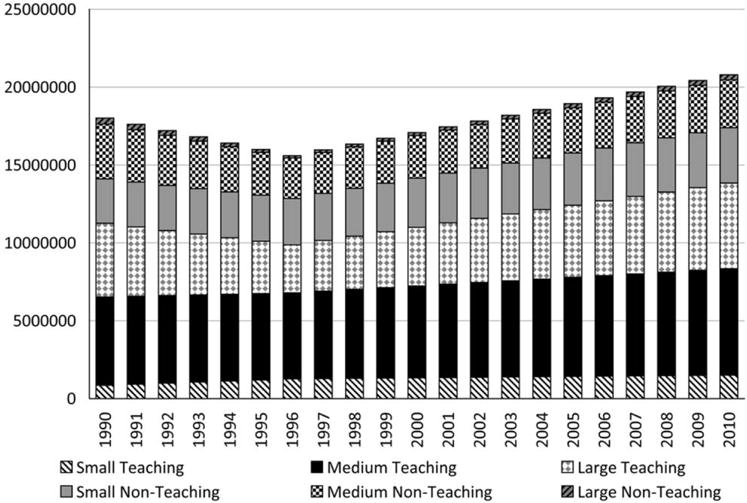
Estimated annual number of national critical care patient-days, excluding neonates, by acute care hospital type, United States, 1990–2010.
CLABSI Definition Change
Analysis of NHSN data for 2006–2007 indicated that 15% of all reported CLABSIs met the NHSN criterion 2b case definition. As such, we applied an average discount multiplier of 0.85 (0.80–0.90) to the number of CLABSIs reported for all NNIS and NHSN years prior to 2008 to make CLABSI rates comparable across the definition change.
Differences in CLABSI Surveillance Participants
The number of critical care units reporting CLABSI data to the CDC increased from 144 in 1990 to 3,794 in 2010; critical care patient-days under surveillance increased from about 236,000 to 11.4 million. In addition, the proportion of critical care patient-days under surveillance contributed by large teaching hospitals decreased from a high of 57% in 1990 to a low of 24% in 2010 (Figure 2A), while the estimated proportion of patient-days occurring nationally in large teaching hospitals remained relatively stable (Figure 2B).
FIGURE 2.
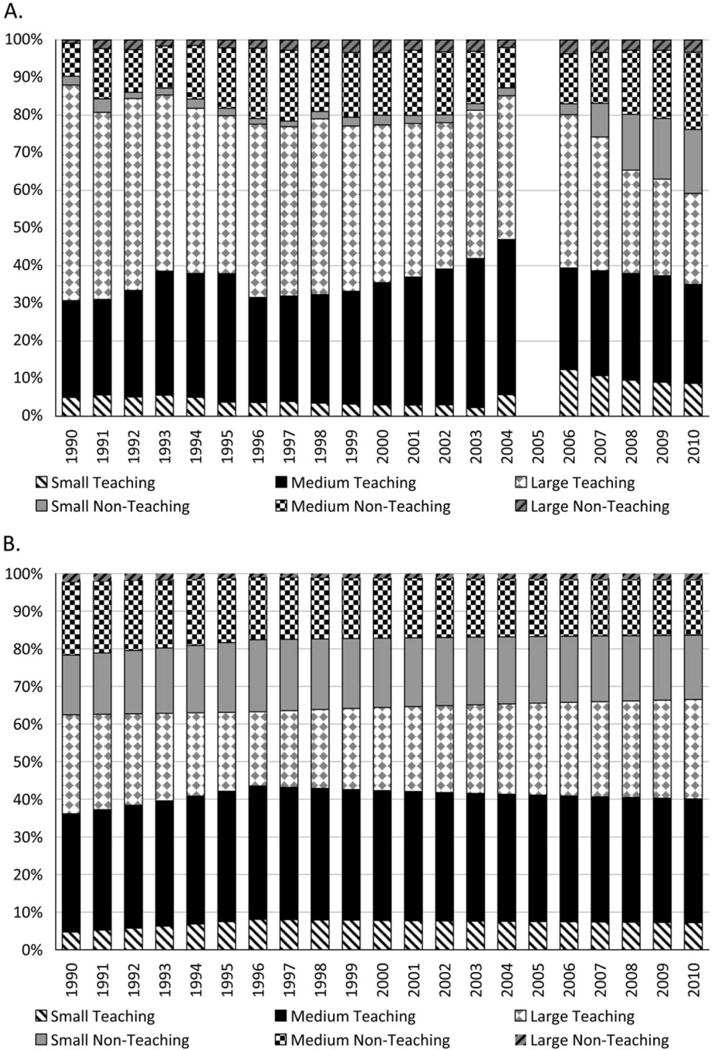
Annual distribution of critical care patient-days reported to the National Nosocomial Infections Surveillance and National Healthcare Safety Network systems (A) and estimated annual distribution of national critical care patient-days (B), excluding neonates, by acute care hospital type, United States, 1990–2010.
Annual participation- and definition-adjusted critical care CLABSI rates (ie, standardized to the national distribution of patient-days) declined during both NNIS and NHSN years, with average annual rate changes of approximately −1.5% (−2.0% to −0.9%) and −10.4% (−11.7% to −9.0%), respectively (Figure 3). CLABSI rates adjusted for participation were lower than rates adjusted only for the definition change during the NNIS years because hospital types with higher CLABSI rates were overrepresented in the NNIS (Figure 2).
FIGURE 3.
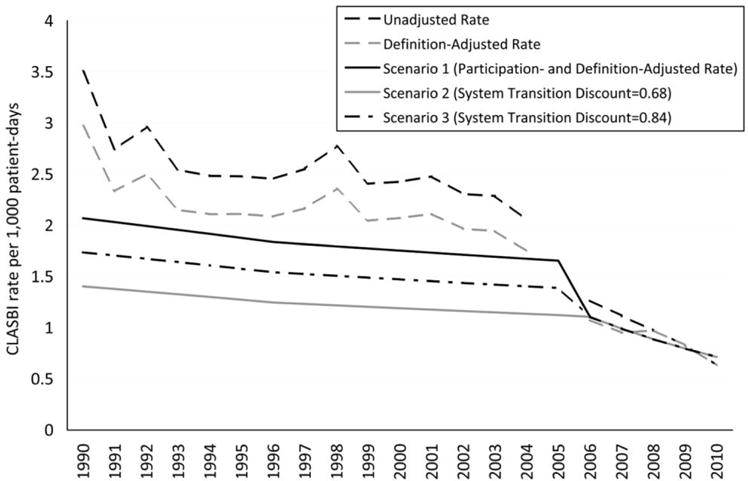
Hospital-onset central line-associated bloodstream infection (CLABSI) rates (cases per 1,000 critical care patient-days) adjusted for CLABSI definition change, surveillance participation changes, and system transition, excluding neonates, United States, 1990–2010.
Transition from the NNIS to the NHSN
We observed a large decline in definition- and participation-adjusted critical care CLABSI rates between 2004 and 2006 (the transition period from the NNIS to the NHSN; Figure 3). The observed percent change in standardized critical care CLABSI rates during the 2-year transition period was −33.9% (−38.7% to −29.1%); this was considered scenario 1. We applied a discount multiplier of 0.68 to CLABSIs reported during the NNIS period for scenario 2 to achieve a change of −2.6% (−9.6% to 4.6%) from 2004 to 2006, consistent with annual declines observed in the NNIS from 1990 to 2004. We applied a discount multiplier of 0.84 to CLABSI rates during the NNIS period for scenario 3, resulting in a 2-year transition period change of −21.3% (−26.9% to −15.4%).
Annual Number of CLABSIs and Infections Prevented for 3 Scenarios
The estimated annual number of hospital-onset CLABSIs in nonneonatal critical care patients decreased from 41,000 (38,000–45,000), 28,000 (26,000–30,000), and 35,000 (32,000–37,000) in 1990 for scenarios 1, 2, and 3, respectively, to 15,000 (14,000–17,000) in 2010 (all scenarios). The 3 scenarios corresponded to an estimated 636,000 (609,000–666,000), 462,000 (441,000–484,000), and 549,000 (525,000–575,000) cumulative CLABSIs, respectively, over the 21-year period (Table 1). Of the estimated 15,000 hospital-onset CLABSIs in nonneonatal critical care patients in 2010, a minority occurred in nonteaching or small teaching hospitals. Approximately 70.4% (68.9%–71.9%) of hospital-onset CLABSIs in critical care patients occurred in medium and large teaching hospitals.
TABLE 1.
Estimates for Cumulative Number of Hospital-Onset CLABSIs, Cumulative Number of Hospital-Onset CLABSIs That Would Have Occurred on the Basis of 1990 Rates, and Cumulative Number of CLABSIs Prevented for 3 NNIS-NHSN Transition Scenarios in Critical Care Patients, Excluding Neonates, United States, 1990–2010
| Cumulative no. of CLABSIs | Cumulative no. of CLABSIs on the basis of 1990 rates | Cumulative no. of CLABSIs prevented | |
|---|---|---|---|
| Scenario 1 | 636,000 (609,000–666,000) | 834,000 (771,000–912,000) | 198,000 (149,000–261,000) |
| Scenario 2 | 462,000 (441,000–484,000) | 566,000 (521,000–621,000) | 104,000 (70,000–147,000) |
| Scenario 3 | 549,000 (525,000–575,000) | 700,000 (646,000–766,000) | 151,000 (110,000–204,000) |
NOTE. Data in parentheses are 95% credible intervals. CLASBI, central line-associated bloodstream infection; NHSN, National Healthcare Safety Network; NNIS, National Nosocomial Infections Surveillance.
For each of the 3 scenarios, the annual number of critical care CLABSIs that would have occurred if rates had not changed since 1990 decreased between 1990 and 1996 and increased each subsequent year through 2010. These 3 scenarios corresponded to 834,000 (771,000–912,000) CLABSIs for scenario 1, 566,000 (521,000–621,000) for scenario 2, and 700,000 (646,000–766,000) for scenario 3 cumulatively over the 21-year period (Table 1). Thus, from 1990 to 2010 the difference in the cumulative estimated number of CLABSIs that would have occurred and cumulative estimated CLABSIs that did occur (ie, CLABSIs potentially prevented) was 198,000 (149,000–261,000) for scenario 1, 104.000 (70,000–147,000) for scenario 2, and 151,000 (110,000–204,000) for scenario 3 (Table 1).
DISCUSSION
We estimated that from 1990 to 2010 there were between 462.000 and 636,000 hospital-onset CLABSIs in nonneonatal critical care patients in the United States, depending on assumptions about the surveillance system transition. As a result of CLABSI rate reductions over this time period, these cumulative totals correspond to between 104,000 and 198,000 fewer CLABSIs than would have occurred if rates had remained unchanged since 1990. These findings suggest that technical innovations and dissemination of evidence-based CLABSI prevention practices have likely been effective on a national scale.
Despite the apparent prevention success, we estimated that there were still approximately 15,000 hospital-onset CLABSIs in critical care settings in 2010. Of these, almost three-quarters occurred in teaching hospitals with more than 200 beds. What fraction of these remaining CLABSIs are preventable with current infection control interventions is unclear,15 but our observation suggests that these facilities, which likely number fewer than 800 (on the basis of CMS hospital cost report data), should be specifically targeted with interventions to further reduce CLABSIs nationally. The majority of CLABSI prevention programs implemented over the past decade have focused on sterile insertion of central lines; further reduction in hospital-onset CLABSIs might require inclusion of improved catheter maintenance in prevention bundles.9,16–18 In addition, given the progress made in reducing CLABSIs in critical care settings, the contribution of patients in other at-risk clinical settings to the total CLABSI burden might now be comparable to inpatient critical care,19 representing logical additional targets for focused intervention; these settings may include high-risk inpatient wards and outpatient hemodialysis centers.
In an analysis of NNIS and NHSN data published in the March 2011 Morbidity and Mortality Weekly Report, we estimated that there were 58% fewer critical care CLABSIs in 2009 than would have occurred if rates had not changed since 2001.19 The current analysis, in which we produced adjusted annual CLABSI estimates for a 21-year period and considered 3 different scenarios to account for the transition from the NNIS to the NHSN, demonstrated between 34.0% (31.3%–36.6%) and 55.2% (53.4%–57.0%) fewer CLABSIs in 2009 than would have been expected on the basis of 2001 rates. One important difference in the former analysis is that temporal changes in the underlying patient population at risk were addressed by applying 2001 and 2009 CLABSI rates to the same patient-day denominator. We took a complementary approach for the current analysis, in which we estimated the number of CLABSIs occurring each year allowing patient-days to change over time, comparing each year’s observed estimate to an expected estimate based on what would have occurred if CLABSI rates had not changed since 1990. This difference is analogous to direct versus indirect standardization20 and, along with adjustments for participation and the system transition, explains the differences in estimates presented in the 2 analyses.
The large decrease observed in definition- and participation-adjusted CLABSI rates between 2004 and 2006 (33.9%) was likely a result of several factors acting in concert. During this period there may have been increasing awareness of CLABSI prevention successes being reported by large prevention initiatives. The Pittsburgh Regional Health Initiative and the Michigan Keystone project are 2 examples of evidence-based prevention programs that achieved large reductions in critical care CLABSI rates that were widely publicized during this time.6,7 Dissemination of successes like these during the NNIS-NHSN transition period may have contributed to a steepening of rate declines nationally. However, the steep change in rates observed with the transition from the NNIS to the NHSN also raises the possibility of an artifactual decrease in reported rates resulting from the surveillance system change. The lack of a disproportionate decline in observed rates during the transition period for catheter-associated urinary tract infections21 and ventilator-associated pneumonias22 argues against this explanation, however. Of note, a rate reduction similar to the reduction in scenario 1 was observed for CLABSIs between 2004 and 2006 in a network of community hospitals reporting to a different surveillance system,23 which had no change in surveillance methodology during that time (D. Sexton, personal communication). This independent observation suggests that the decline in rates observed during the NNIS-NHSN transition period should not be completely attributed to an artifact resulting from the change in surveillance systems. Nevertheless, because we are unable to estimate the relative contribution of these factors to the observed decline in CLABSI rates during the transition, we opted to present multiple potential scenarios for this period. As state and national reporting requirements were primarily implemented in years subsequent to the system transition, public reporting mandates were not an important factor in the observed decline from 2004 to 2006.5
Our analysis was subject to several limitations. We could adjust for participation changes only on the basis of facility characteristics (ie, teaching status and bed size), since patient-day data from the CMS hospital cost report are not stratified into critical care unit types comparable to those used in the NNIS and NHSN. In addition, relatively few data were reported from small and large nonteaching hospitals in the NNIS era. We also assumed that data reported to the NNIS and NHSN within each of the 6 facility types were representative of all nonparticipating facilities in those categories nationally. Comparisons across facility types may also be complicated by variability in how surveillance is implemented.24 Furthermore, the use of 1990 CLABSI rates as a surrogate for what would have occurred in the absence of CLABSI prevention activities is somewhat arbitrary; changes in factors not directly related to infection prevention over time could have caused rates to increase or decrease over time, such as pressure to reduce critical care unit length of stay and changes in empiric antimicrobial prescribing practices. Finally, the estimates we present in this analysis are limited to hospital-onset infections in nonneonatal critical care patients; national CLABSI estimates that include all patient populations may need an alternative approach, such as can be accomplished through a point prevalence survey.
More work remains in preventing hospital-onset CLABSIs in critical care patients, with more than 15,000 infections occurring in 2010. Given the high mortality and excess healthcare costs associated with CLABSIs, these infections still have a major impact on patients and the healthcare system. The current concentration of critical care CLABSIs in medium and large teaching hospitals suggests that a targeted approach may be warranted to most efficiently continue achieving reductions in critical care CLABSIs nationally. Nevertheless, our analysis suggests that substantial progress has been made in the prevention of hospital-onset CLABSIs in critical care patients in the United States over the past 2 decades. Lessons learned from this success have already provided a foundation for efforts to prevent other important HAIs on a national scale.
Footnotes
Potential conflicts of interest. All authors report no conflicts of interest relevant to this article. All authors submitted the ICMJE Form for Disclosure of Potential Conflicts of Interest, and the conflicts that the editors consider relevant to this article are disclosed here.
The findings and conclusions in this report are those of the authors and do not necessarily represent the official position of the Centers for Disease Control and Prevention.
References
- 1.National Nosocomial Infections Surveillance system. National Nosocomial Infections Surveillance (NNIS) system report, data summary from January 1992 through June 2004, issued October 2004. Am J Infect Control. 2004;32(8):470–485. doi: 10.1016/S0196655304005425. [DOI] [PubMed] [Google Scholar]
- 2.Dudeck MA, Horan TC, Peterson KD, et al. National Healthcare Safety Network (NHSN) report, data summary for 2009, device-associated module. Am J Infect Control. 2011;39(5):349–367. doi: 10.1016/j.ajic.2011.04.011. [DOI] [PubMed] [Google Scholar]
- 3.Centers for Disease Control and Prevention. First State-Specific Healthcare-Associated Infections Summary Data Report: CDC’s National Healthcare Safety Network (NHSN), January–June, 2009. http://www.cdc.gov/hai/pdfs/stateplans/SIR_05_25_2010.pdf. Published 2010. Accessed February 23, 2012.
- 4.Department of Health and Human Services. Action Plan to Prevent Healthcare-Associated Infections: Incentives and Oversight. http://www.hhs.gov/ash/initiatives/hai/actionplan/hhs_hai_action_plan_final_06222009.pdf. Published 2009. Accessed February 23, 2012.
- 5.National Conference of State Legislatures. Hospital-acquired infection legislation database. http://www.ncsl.org/issues-research/health/hospital-acquired-infection-legislation-database.aspx. Accessed February 23, 2012.
- 6.Centers for Disease Control and Prevention. Reduction in central line-associated bloodstream infections among patients in intensive care units—Pennsylvania, April 2001–March 2005. MMWR Morb Mortal Wkly Rep. 2005;54(40):1013–1016. [PubMed] [Google Scholar]
- 7.Pronovost P, Needham D, Berenholtz S, et al. An intervention to decrease catheter-related bloodstream infections in the ICU. N Engl J Med. 2006;355(26):2725–2732. doi: 10.1056/NEJMoa061115. [DOI] [PubMed] [Google Scholar]
- 8.Casey AL, Mermel LA, Nightingale P, Elliott TS. Antimicrobial central venous catheters in adults: a systematic review and metaanalysis. Lancet Infect Dis. 2008;8(12):763–776. doi: 10.1016/S1473-3099(08)70280-9. [DOI] [PubMed] [Google Scholar]
- 9.Timsit JF, Schwebel C, Bouadma L, et al. Chlorhexidine-impregnated sponges and less frequent dressing changes for prevention of catheter-related infections in critically ill adults: a randomized controlled trial. JAMA. 2009;301(12):1231–1241. doi: 10.1001/jama.2009.376. [DOI] [PubMed] [Google Scholar]
- 10.Warren DK, Cosgrove SE, Diekema DJ, et al. A multicenter intervention to prevent catheter-associated bloodstream infections. Infect Control Hosp Epidemiol. 2006;27(7):662–669. doi: 10.1086/506184. [DOI] [PubMed] [Google Scholar]
- 11.Warren DK, Zack JE, Cox MJ, et al. An educational intervention to prevent catheter-associated bloodstream infections in a non-teaching, community medical center. Crit Care Med. 2003;31(7):1959–1963. doi: 10.1097/01.CCM.0000069513.15417.1C. [DOI] [PubMed] [Google Scholar]
- 12.Centers for Medicare and Medicaid Services. Cost Reports. http://www.cms.gov/Research-Statistics-Data-and-Systems/Files-for-Order/CostReports/index.html. Accessed January 6, 2012.
- 13.Annual survey database. American Hospital Association website. http://www.ahadata.com/ahadata/html/AHASurvey.html. Published 2010. Accessed February 23, 2012.
- 14.Edwards JR, Peterson KD, Andrus ML, et al. National Healthcare Safety Network (NHSN) Report, data summary for 2006 through 2007, issued November 2008. Am J Infect Control. 2008;36(9):609–626. doi: 10.1016/j.ajic.2008.08.001. [DOI] [PubMed] [Google Scholar]
- 15.Shuman EK, Washer LL, Arndt JL, et al. Analysis of central line-associated bloodstream infections in the intensive care unit after implementation of central line bundles. Infect Control Hosp Epidemiol. 2010;31(5):551–553. doi: 10.1086/652157. [DOI] [PubMed] [Google Scholar]
- 16.Shapey IM, Foster MA, Whitehouse T, et al. Central venous catheter-related bloodstream infections: improving post-insertion catheter care. J Hosp Infect. 2009;71(2):117–122. doi: 10.1016/j.jhin.2008.09.016. [DOI] [PubMed] [Google Scholar]
- 17.Timsit JF, Dubois Y, Minet C, et al. New materials and devices for preventing catheter-related infections. Ann Intensive Care. 2011;1:34. doi: 10.1186/2110-5820-1-34. [DOI] [PMC free article] [PubMed] [Google Scholar]
- 18.Sanders J, Pithie A, Ganly P, et al. A prospective double-blind randomized trial comparing intraluminal ethanol with heparinized saline for the prevention of catheter-associated bloodstream infection in immunosuppressed haematology patients. J Antimicrob Chemother. 2008;62(4):809–815. doi: 10.1093/jac/dkn284. [DOI] [PubMed] [Google Scholar]
- 19.Centers for Disease Control and Prevention. Vital signs: central line-associated blood stream infections—United States, 2001, 2008, and 2009. MMWR Morb Mortal Wkly Report. 2011;60(8):243–248. [PubMed] [Google Scholar]
- 20.Chan CK, Feinstein AR, Jekel JF, et al. The value and hazards of standardization in clinical epidemiologic research. J Clin Epidemiol. 1988;41(11):1125–1134. doi: 10.1016/0895-4356(88)90082-0. [DOI] [PubMed] [Google Scholar]
- 21.Burton DC, Edwards JR, Srinivasan A, Fridkin SK, Gould CV. Trends in catheter-associated urinary tract infections in adult intensive care units—United States, 1990–2007. Infect Control Hosp Epidemiol. 2011;32(8):748–756. doi: 10.1086/660872. [DOI] [PubMed] [Google Scholar]
- 22.Magill S, Edwards J, Fridkin S. Ventilator-associated pneumonia in the National Nosocomial Infections Surveillance system and the National Healthcare Safety Network: analysis of incidence and pathogen distribution, 2002–2008. Abstract presented at: 5th Decennial International Conference on Healthcare-Associated Infections. 2010 [Google Scholar]
- 23.Anderson DJ, Miller BA, Chen LF, et al. The network approach for prevention of healthcare-associated infections: long-term effect of participation in the Duke Infection Control Outreach Network. Infect Control Hosp Epidemiol. 2011;32(4):315–322. doi: 10.1086/658940. [DOI] [PubMed] [Google Scholar]
- 24.Dixon-Woods M, Leslie M, Bion J, et al. What counts? an ethnographic study of infection data reported to a patient safety program. Milbank Q. 2012;90(3):548–591. doi: 10.1111/j.1468-0009.2012.00674.x. [DOI] [PMC free article] [PubMed] [Google Scholar]