

Abstract
Cytochrome P450 2E1 (CYP2E1) is an important drug metabolizing enzyme for processing numerous xenobiotics in the liver, including acetaminophen and ethanol. Previous studies have shown that microRNAs (miRNAs) can suppress CYP2E1 expression by binding to the 3′-untranslated region (3′-UTR) of its transcript. However, a systematic analysis of CYP2E1 regulation by miRNAs has not been described. Here, we applied in silico, in vivo, and in vitro approaches to investigate miRNAs involved in the regulation of CYP2E1. Initially, potential miRNA binding sites in the CYP2E1 mRNA transcript were identified and screened using in silico methods. Next, inverse correlations were found in human liver samples between the expression of CYP2E1 mRNA and the levels of two miRNA species, hsa-miR-214-3p and hsa-miR-942-5p. In a HepG2-derived CYP2E1 over-expression cell model, hsa-miR-214-3p exhibited strong suppression of CYP2E1 expression by targeting the coding region of its mRNA transcript, but hsa-miR-942-5p did not inhibit CYP2E1 levels. Electrophoretic mobility shift assays confirmed that hsa-miR-214-3p recruited other cellular protein factors to form stable complexes with specific sequences present in the CYP2E1 mRNA open reading frame. Transfection of HepaRG cells with hsa-miR-214-3p mimics inhibited expression of the endogenous CYP2E1 gene. Further, hsa-miR-214-3p mimics partially blocked ethanol-dependent increases in CYP2E1 mRNA and protein levels in HepG2 cells and they reduced the release of alanine aminotransferase from CYP2E1-overexpressing HepG2 cells exposed to acetaminophen. These results substantiate the suppressing effect of hsa-miR-214-3p on CYP2E1 expression.
Keywords: microRNA, hsa-miR-214-3p, CYP2E1, Drug metabolizing enzymes, Pharmacogenomics, Inter-individual variability
1. Introduction
Cytochrome P450 2E1 (CYP2E1), an important drug metabolizing enzyme (DME), is expressed highly in the liver and it is also expressed at very low levels in the brain and small intestine [1]. CYP2E1 has been studied extensively due to its key role in the phase I metabolism of a number of drugs and other compounds [2–4]. CYP2E1 catalyzes the metabolism of a variety of important endogenous biochemicals and xenobiotics, including aliphatic compounds (e.g., ethanol, acetone, lauric acid and arachidonic acid), aromatic compounds (e.g., pyrazole, benzene, and p-nitrophenol), halogenated hydrocarbons (e.g., chloroform, carbon tetrachloride, vinyl chlorides) and bicyclic molecules (e.g., chlorzoxazone, quinolone, caffeine) [4]. Some metabolites of these compounds generated by CYP2E1 catalytic activity are carcinogenic; thus, CYP2E1 genetic polymorphisms are associated with altered susceptibility to cancer [5]. Moreover, approximately 3% of commercially available drugs are metabolized by CYP2E1 [6]. For example, CYP2E1 is the primary liver enzyme responsible for the formation of reactive metabolites of acetaminophen (APAP, paracetamol) [6], chlorzoxazone [7], and trimethadione that are associated with the toxicity of these drugs [8,9]. Owing to its ability to oxidize ethanol to produce reactive oxygen species, CYP2E1 is involved in alcohol-induced liver injury [10].
The regulation of CYP2E1 in humans is complex. CYP2E1 gene expression, protein production, and enzyme activity are affected by genetic polymorphisms [11], environmental stimuli [12], and epigenetic factors [13,14]. For instance, the protein level and catalytic activity associated with the genetic variant CYP2E1*2 are 37% and 36%, respectively, compared with the wild-type enzyme [11]. Ethanol is a factor present in the diet that leads to increased hepatic CYP2E1 activity by inhibiting protein degradation independent of CYP2E1 mRNA levels [12]. Epigenetic factors regulate gene expression without alteration of DNA sequences [15]. DNA methylation and histone modifications are important epigenetic modifications that contribute to CYP2E1 regulation [15]. In addition, miRNAs promote mRNA degradation or inhibit protein translation through binding specific sequences found in RNA transcripts [16–18]. In particular, previous studies have shown that CYP2E1 is regulated by hsa-miR-378-5p, hsa-miR-552, and hsa-miR-570-3p via interactions with their cognate binding sites present in the 3′-UTR of its mRNA transcript [13,14,19]. However, a systematic analysis has not been reported for the regulation of CYP2E1 by miRNAs that may target putative recognition sites distributed throughout its full length mRNA transcript.
Our previous studies have shown that the expression of several DMEs, including CYP2C9, CYP2C19, CYP2B6, SULT1A1 and ALDH5A1, can be suppressed by miRNAs in human liver cells [16,17,20–22]. Importantly, we demonstrated that miRNAs can regulate CYP2C19 expression by targeting a specific site within its protein coding region [21].
In the current study, we used in silico, in vivo, and in vitro methods to explore the roles of all potential miRNAs in regulating the expression of CYP2E1. Two miRNAs (hsa-miR-214-3p and hsa-miR-942-5p) were identified using in silico methods that could target the CYP2E1 protein coding region. The expression of both miRNAs in human liver samples correlated inversely with CYP2E1 mRNA levels. We performed a series of biochemical assays to evaluate biophysical interactions between the selected miRNAs and CYP2E1 mRNA transcripts and their influence on the expression of CYP2E1. We also tested the hypotheses that miRNAs that are able to suppress CYP2E1 expression in general should also block the induction of CYP2E1 by ethanol and interfere with the CYP2E1-dependent toxicity of acetaminophen. In addition, the efficiency by which hsa-miR-214-3p suppresses CYP2E1 expression through interactions with the CYP2E1 coding region was compared with the CYP2E1-suppressing efficiencies of two other miRNAs (hsa-miR-378-5p and hsa-miR-570-3p) that target distinct binding sites within the CYP2E1 3′-UTR [13,18]. This step-wise approach offers a systematic way to confirm that predictions of gene regulatory functions for miRNA species are validated via appropriate mechanistic evidence.
The utility of novel biomarkers, such as changes in miRNA expression, for characterizing diseases, toxicity, drug safety, and drug efficacy, is enhanced when clear mechanistic associations are established with one or more molecular pathways involved in relevant clinical effects [23]. In this study, we found that hsa-miR-214-3p represses CYP2E1 gene expression and confirmed that up regulation of this DME gene is associated with increased APAP toxicity during overdose. In theory, higher levels of hsa-miR-214-3p may be associated with reduced CYP2E1-mediated toxicity to APAP in vivo, as we observed in vitro. Thus, the expression of hsa-miR-214-3p might provide a useful biomarker for predicting inter-individual variability in APAP pharmacokinetics and toxicity. Furthermore, a number of miRNA-based agents are under study as potential therapeutics for a variety of clinical conditions due to their ability to affect the expression of selected genes [24]. It is possible that therapeutic agents derived from hsa-miR-214-3p, or other miRNAs able to suppress CYP2E1 expression, could be developed as therapeutics to relieve CYP2E1-dependent hepatotoxicity associated with APAP overdose.
2. Materials and methods
2.1. In silico analyses
The online bioinformatics database and software tool miRTar. human (http://mirtar.mbc.nctu.edu.tw/human/) was used to identify potential miRNA binding sites within the full length CYP2E1 mRNA transcript (Refseq NM_000773). RNA-hybrid (http://bibiserv2.cebitec.uni-bielefeld.de/rnahybrid), an online RNA hybridization algorithm, was used to calculate the minimum free energy of binding for predicted miRNA duplexes formed with cognate sequences present in CYP2E1 mRNA. CYP2E1 mRNA levels and miRNA levels detected in human liver samples (50 cases) were obtained from the TCGA LIHC database (The Cancer Genome Atlas Liver Hepatocellular Carcinoma; http://wiki.cancerimagingarchive.net/display/Pubilc/TCGA-LIHC). Pearson’s correlation analysis was used to select miRNAs whose level of expression in human liver showed the strongest negative correlations with CYP2E1 mRNA levels.
2.2. Cell culture
HepG2 human hepatoma cells were purchased from the American Type Culture Collection (ATCC, Manassas, VA). HepG2CYP2E1, a HepG2-derived CYP2E1 over-expression cell line was established in our previous study [25]. Both HepG2 and HepG2CYP2E1 cell lines were maintained in Dulbecco’s minimum essential medium (DMEM) supplemented with 10% fetal bovine serum (FBS).
Human HepaRG hepatocyte-like cells were obtained from Life Technologies (Carlsbad, CA). After stimulation to become terminally differentiated hepatic cells, HepaRG cells express important DMEs at levels comparable to those found in normal human hepatocytes. Thawed HepaRG cells were plated in 24-well plates with 5 × 10⁵ cells per well in Williams’ E medium supplemented with thaw, plate, and general purpose medium supplement and maintained for 24 h. The medium was then completely replaced by Williams’ E medium supplemented with the maintenance/metabolism medium supplement to induce terminal differentiation for 3 days. This medium was used for all subsequent treatments of HepaRG cells.
All hepatocyte-like cell cultures were maintained at 37 °C in a humidified 5% CO2 atmosphere. All cell culture media and supplements used in this study were purchased from Life Technologies.
2.3. Transfections of HepG2, HepG2CYP2E1, and HepaRG cells with miRNAs and exposures to ethanol and acetaminophen
The miRNA mimics of hsa-miR-214-3p, hsa-miR-942-5p, hsa-miR-378-5p and hsa-miR-570-3p were obtained from Thermo Scientific (Waltham, MA) and transiently transfected into HepG2, HepG2CYP2E1, and terminally-differentiated HepaRG cells at the final concentration of 40 nmol/L using Lipofectamine 2000 reagent (Life Technologies).
The effects of miRNAs on the regulation of CYP2E1 expression was studied by separately introducing hsa-miR-214-3p, hsa-miR-942-5p, or the miRNA negative control (miR-NC) into HepG2CYP2E1 or HepaRG cells by transfection and then harvesting RNA and protein 24 h later for analysis.
The ability of hsa-miR-214-3p to interfere with ethanol-induced CYP2E1 upregulation was tested in the HepG2 parental cell line. The hsa-miR-214-3p mimic or miR-NC was introduced into HepG2 cells by transfection and the cells were incubated overnight. On the following morning, the transfected HepG2 cells were treated with 200 mM ethanol for 24 h prior to harvesting for RNA and protein analyses [26].
Similarly, the ability of hsa-miR-214-3p to suppress the CYP2E1-dependent toxicity of acetaminophen (APAP) (Sigma-Aldrich, St. Louis) was studied in HepG2CYP2E1 cells. Again, either the hsa-miR-214-3p mimic or the miR-NC was separately introduced into HepG2CYP2E1 cells by transfection and the cells were allowed to recover for 24 h. The transfected cells were then treated with 0, 10, and 20 mM APAP and the extent of alanine aminotransferase release was measured after incubation for 0, 6, 12, or 24 h [27,28].
The efficiency by which hsa-miR-214-3p suppresses CYP2E1 expression was compared with the CYP2E1-suppressing efficiencies of hsa-miR-378-5p and hsa-miR-570-3p by introducing mimics for each of these miRNAs or corresponding miR-NC separately into HepaRG cells. Terminally differentiated HepaRG cells were transfected using the conditions described above and allowed to recover for 24 h prior to harvesting for analyses of protein and RNA. Each trial was performed at least three times.
2.4. RNA extraction and quantitative reverse-transcription PCR (qRTPCR)
A miRNeasy Mini kit (Qiagen, Valencia, CA) was used to extract total RNA from HepG2, HepG2CYP2E1, or HepaRG cells after transfection and chemical treatments. A QuantiTect Reverse Transcription kit (Qiagen) and an NCode™ miRNA First-Strand cDNA Synthesis kit (Life Technologies) were used according to the manufacturers’ instructions to generate cDNA. A QuantiFast SYBR1 Green RT-PCR kit (Qiagen) was used with an ABI Prism7900 Sequence Detection System (Applied Biosystems) for qRT-PCR analysis. The PCR primers used for detecting CYP2E1 mRNA were CYP2E1-F: 5′-TTCAGCGGTTCACCCT-3′ and CYP2E1-R: 5′-GAGGTATCCTCT GAAAATGGTGTC-3′. The primers for detecting GAPDH mRNA were GAPDH-F: 5′-GAA ATCCCATCACCATCTTCCAGG-3′ and GAPDH-R: 5′-GAGCCCCAGCCT TCTCCATG-3′. The primers used for quantitative real-time PCR for detection of the miRNA species hsa-miR-214-3p, hsa-miR-942-5p, hsa-miR-378-5p, hsa-miR-570-3p or U6 were miR214-F: 5′-ACAGCAGGCACAGACAGGCAG-3′, miR942-F: 5′-TCTTCTCTGTTTTGGCCATGTG-3′, miR378-F: 5′-CTC CTGACTCCAGGTCCTGTGT-3′, miR570-F: 5′-CGAAAACAGCAAT TACCTTTGC-3′ or U6-F: 5′-CTCGCTTCGGCAGCACA-3, and U6-R: 5,-AACGCTTCACGA ATT TGCGT-3, respectively. The fold change of CYP2E1 or hsa-miR-214-3p, hsa-miR-942-5p, hsa-miR-378-5p and hsa-miR-570-3p expression was calculated relative to expression of GAPDH or U6 small nuclear RNA, respectively. All oligonucleotide primers used for quantitative real time PCR were obtained from Integrated DNA Technologies (Coralville, IA).
2.5. Western blotting assays
RIPA Lysis buffer (Life Technologies) was used to extract protein from HepG2, HepG2CYP2E1, and HepaRG cells. The expression of CYP2E1 and GAPDH were tested by western blotting assays using the Odyssey™ Western Blotting Kit (LI-COR Biosciences) with antibodies specific for CYP2E1 (rabbit anti-human) or GAPDH (mouse anti-human) that were obtained from Abcam (Cambridge, MA). Specific protein band intensities were measured with an Odyssey CLx Infrared Imaging System for quantitative analyses.
2.6. Alanine aminotransferase (ALT) assay
The Liquid ALT (SGPT) Reagent Set (Pointe Scientific, Inc., Caton, MI) was used according to the supplier’s protocol to measure the amount of ALT activity released from treated cells. ALT released to the medium was calculated as a percentage of the total ALT activity (i.e. ALT in the medium plus ALT in the cell lysate). Cell culture supernatants were collected at different time points for analysis of released ALT activity following cell treatments with APAP as described above. To release the cell-associated ALT present in the remaining cell monolayers, a volume of culture medium containing 1% Triton X-100 equal to the original culture volumes was added to each sample, the detergent-treated cells were incubated for 20 min on ice, and the resulting cell lysates were collected. Samples of cell culture supernatants and cell lysates were cleared of cellular debris by centrifugation at 700g for 5 min at room temperature prior to analysis of ALT enzyme activity. After adding freshly prepared ALT assay working reagent solution, the ALT activity present in each sample was detected spectrophotometrically at 340 nm using a coupled enzyme system (ALT plus lactate dehydrogenase) with a Synergy H4 Hybrid Reader (BioTek Instruments, Inc.). Each assay was performed at least three times.
2.7. RNA electrophoretic mobility shift assays (RNA EMSAs)
NE-PER Nuclear and Cytoplasmic extraction reagents (Thermo Scientific) were used to extract cytoplasmic protein from HepaRG cells. RNA EMSAs were performed using LightShift Chemiluminescent RNA EMSA Kits (Thermo Scientific) according to the manufacturer’s protocol, except that the 1 × REMSA Binding Buffer was adjusted to contain an additional 5% glycerol, 200 mM KCl, 100 mM MgCl2, and 200 nmol synthetic miRNA or/and cognate mRNA oligonucleotides for 20 μL basic reaction mixtures. The RNA oligonucleotides for hsa-miR-214-3p and hsa-miR-942-5p were labeled with cy5.5™ dye on their 5′ ends, and the mRNA oligonucleotides targeted by miRNAs were 2,-O-methyl-modified at the 5′ ends. The labeled RNA oligonucleotides for the miRNA were dye-MIR-214-3P:5′-rArCrArGrCrArGrGrCrAr CrArGrArCrArGrGrCrArGrU-3′ and dye-MIR-942-5P:5′-rUrCrUrUr CrUrCrUrGrUrUrUrUrGrGrCrCrArUrGrUrG-3′, respectively. The RNA oligonucleotides used as unlabeled competitors for hsa-miR-214-3p and hsa-miR-942-5p were: Cold-214-3P:5′-ACAGCAGGCA CAGACAGGCAGU-3′ and Cold-942-5P:5′-UCUUCUCUGUUUUGGC CAUGUG-3′, respectively. The oligonucleotide probes for CYP2E1 mRNA targeting sites were labeled with IRDye1800 dye on their 5′ends. The labeled oligonucleotide probes of the targeting sites for hsa-miR-214-3p (3 target sites) and hsa-miR-942-5p (one target site) were dye-214-target-1:5′-mGmGmAmGmUmCmAm CmCmGmUmGmGmCmCmCmUmGmCmUmGmG-3′, dye-214-target-2:5′-mGmCmGmGmCmCmUmUmCmCmUmCmCmUmGmC mUmGmG-3′, dye-214-target-3:5′-mGmAmGmGmCmCmCmAm CmUmUmCmCmUmGmCmUmGmG-3′ and dye-942-target:5′-mC mUmCmGmUmGmGmAmAmAmUmGmGmAmGmAmAmGmG-3′, respectively. The ability of miRNA/mRNA hybrids to recruit cellular proteins was evaluated by adding cytoplasmic extract (2 μg) and tRNA (1 μg) to the basic reaction mixtures followed by incubation 10 min at room temperature to form ribonucleoprotein complexes. To evaluate the sequence specificity for the electrophoretically stable complexes observed, 50-fold molar excesses of unlabeled probes were placed in the reactions before adding the dye-labeled probes for competition assays. In each case, the resulting reaction mixtures were incubated at room temperature for 15 min and the bound complexes were separated with 8% polyacrylamide gel electrophoresis (PAGE) at 4 °C for 2.5 h. Images were obtained and analyzed using an Odyssey CLx Infrared Imaging System (LI-COR Biosciences, Lincoln, NE). All oligonucleotide probes used for RNA EMSA were purchased from Integrated DNA Technologies.
2.8. Statistical analyses
Pearson correlation analysis was used to test the correlations between CYP2E1 mRNA levels and the levels of hsa-miR-214-3p and hsa-miR-942-5p in human liver tissues. Student’s t-tests were used to compare pairwise differences in the expression of CYP2E1, hsa-miR-214-3p, hsa-miR-942-5p, hsa-miR-378-5p, and hsa-miR-570-3p between treatments. One-way ANOVA was performed to make comparisons between multiple subgroups. Differences were considered significant when the P value was <0.05. SPSS software (SPSS 17.0; SPSS, Inc., USA) was used for performing statistical analyses.
3. Results
3.1. Selection of potential miRNAs modulating CYP2E1
We used the miRTar online miRNA target prediction tool with the integrated miRTar. Human database to screen and identify candidate miRNAs that may target potential binding sites present in the human CYP2E1 full-length mRNA transcript. In this initial step, 70 candidate miRNAs were identified with the potential to interact with the CYP2E1 transcript within the full length of mRNA (data not shown). Next, predicted binding energies for each putative miRNA/CYP2E1 mRNA hybrid were calculated and analyzed. One miRNA was eliminated due to an unfavorable binding energy < −20 kcal/mol because favorable free energy is a vital factor for miRNA-mRNA interactions [21]. Among the remaining 69 miRNA candidates, 32 miRNAs were identified with a significant expression in human liver using the TCGA LIHC database. Of the 32 remaining candidates, negative correlations were found between CYP2E1 mRNA levels and the expression of 9 miRNAs among the human liver samples represented in the database. We selected two miRNAs for further study (hsa-miR-214-3p and hsa-miR-942-5p, respectively) that showed the strongest inverse correlations (Pearson’s correlation, r = −0.49191 and r = −0.49017, respectively) with CYP2E1 expression in human liver and the lowest probabilities that those correlations are due to chance (p = 0.000285 and p = 0.00302, respectively) (see Table 2, Fig. 1A–B). Interestingly, three potential binding sites were found in the CYP2E1 transcript for the miRNA hsa-miR-214-3p (target 1: 46–67, target 2: 73–91, target 3: 481–499, positions refer to NM_000733) (Table 1).
Table 2.
Correlation between selected miRNAs and the expression of CYP2E1 in 50 normal liver tissues.
| MiRNA | Correlation | P value |
|---|---|---|
| hsa-miR-214-3p | −0.49191 | −0.000285 |
| hsa-miR-942-5p | −0.49017 | −0.000302 |
| hsa-miR-140-3p | −0.36102 | −0.010003 |
| hsa-miR-502-3p | −0.35898 | −0.010463 |
| hsa-miR-330-5p | −0.35265 | −0.012011 |
| hsa-miR-708 | −0.34792 | −0.013292 |
| hsa-miR-146b-3p | −0.31349 | −0.026633 |
| hsa-miR-490-5p | −0.30739 | −0.029894 |
| hsa-miR-1248 | −0.29692 | −0.036265 |
Fig. 1.

Correlation between the expression of hsa-miR-214-3p or hsa-miR-942-5p and CYP2E1 transcripts in human non-tumor liver tissues. The levels of (A) hsa-miR-214-3p (r = −0.49191, P = 0.000285), and (B) hsa-miR-942-5p (r = −0.49017, P = 0.000302), were negatively correlated with CYP2E1 mRNA levels (50 non-tumor liver samples) in the TGCA LIHC public dataset using Pearson’s correlation analysis.
Table 1.
MicroRNA targeting the CYP2E1 coding region predicted by miRTar.Human.
| miRNA | ID number | Position on NM_00773 | Free energy (kcal/mol)* |
|---|---|---|---|
| hsa-miR-1248 | MIMAT0005900 | 1335–1356 | −22.9 |
| hsa-miR-140-3p | MIMAT0004597 | 1079–1095 | −20 |
| hsa-miR-146b-3p | MIMAT0004766 | 439–460 | −26.8 |
| hsa-miR-214-3p | MIMAT0000271 | 46–67;73–91;481–499 | −25.2;−22.3;−22.6 |
| hsa-miR-330-5p | MIMAT0004693 | 459–480 | −23.7 |
| hsa-miR-490-5p | MIMAT0004764 | 79–100 | −28.2 |
| hsa-miR-502-3p | MIMAT0004775 | 1078–1099 | −26.6 |
| hsa-miR-708 | MIMAT0004926 | 951–972 | −22.4 |
| hsa-miR-942-5p | MIMAT0004985 | 841–859 | −22.1 |
Calculated by RNAhybrid software.
3.2. Hsa-miR-214-3p suppressed CYP2E1 expression in HepG2CYP2E1 cells
To investigate the abilities of hsa-miR-214-3p and hsa-miR-943-5p to regulate CYP2E1 expression, we transfected the hsa-miR-214-3p mimics, the hsa-miR-942-5p mimics, or the miRNA negative control into HepG2CYP2E1 cells (Fig. 2) and gene expression was measured 24 h later, as described in our previous study [21]. Compared to cells transfected with the miRNA negative control, transfection of HepG2CYP2E1 cells with hsa-miR-214-3p, but not with hsa-miR-942-5p, resulted in a 30% reduction in CYP2E1 mRNA levels (Fig. 2A–B) and a 35% reduction in CYP2E1 protein levels (Fig. 2C–D).
Fig. 2.

Hsa-miR-214-3p inhibited exogenous CYP2E1 expression in HepG2CYP2E1-cells. The 40 nmol/L miRNA negative control, hsa-miR-214-3p mimics and hsa-miR-942-5p mimics were transiently transfected into the HepG2CYP2E1cells. (A) Increased expression of hsa-miR-214-3p and hsa-miR-942-5p after transfection. (B) CYP2E1 mRNA levels decreased when transfected with hsa-miR-214-3p mimics but not hsa-miR-942-5p mimics. (C) Western blots with antibodies specific for CYP2E1 and GAPDH and (D) quantitative densitometry show that transfection with hsa-miR-214-3p mimics contributed to the down-regulated CYP2E1 protein levels. Plotted values were first normalized by U6 RNA, GAPDH mRNA, or GAPDH protein levels (A, B, and D respectively) and in each case normalized ratios for cells transfected with miR214-3p and miR-942-5p were compared to ratios for cells transfected with miR-NC. *P < 0.05; miR-NC, miRNA negative control. Each assay was performed using at least 3 independent experiments.
3.3. Hsa-miR-214-3p inhibits ethanol-dependent induction of CYP2E1 expression in HepG2 cells
It is well known that exposure to ethanol increases CYP2E1 levels in hepatocytes. We investigated the influence of hsa-miR 214-3p on ethanol-dependent induction of CYP2E1 in HepG2 cells [29]. As expected, exposure to ethanol increased CYP2E1 expression significantly in HepG2 cells (1.5-fold and 2-fold elevations in mRNA and protein levels after treatment with 200 mM ethanol for 24 h; Fig. 3B, all P < 0.05). In contrast, ethanol did not affect the expression of hsa-miR-214-3p in these cells (Fig. 3A). However, after transfection with hsa-miR-214-3p mimics, the induction of CYP2E1 expression was greatly reduced in HepG2 cells exposed to ethanol, with 85% and 37% decreased CYP2E1 mRNA and the protein levels, respectively, after treatment with 200 mM ethanol (Fig. 3D, all P < 0.05).
Fig. 3.

Hsa-miR-214-3p suppressed ethanol-induced CYP2E1 expression in HepG2 cells. (A) Treatment of HepG2 cells with 200 mM ethanol does not affect hsa-miR-214-3p expression. Conditions used for introducing hsa-miR-214-3p mimics into HepG2 cells increased its level by 350-fold in the presence of 200 mM ethanol for 24 h compared to HepG2 cells transfected with miRNA negative control. (B) Increased CYP2E1 mRNA levels were observed in HepG2 cells exposed to 200 mM ethanol for 24 h. Compared to HepG2 cells transfected with negative control miRNA, CYP2E1 mRNA levels were suppressed by 65% in cells transfected with hsa-miR-214-3p. (C) Western blots with antibodies specific for CYP2E1 and GAPDH show that higher levels of CYP2E1 protein are detected in HepG2 cells treated with 200 mM ethanol for 24 h. Ethanol-induced CYP2E1 protein expression is partially blocked in HepG2 cells transfected with hsa-miR-214-3p compared to HepG2 cells transfected with negative control miRNA. (D) Quantitative densitometric analysis of immunoblotting images above confirm that ethanol-induced CYP2E1 protein expression is inhibited in HepG2 cells in the presence of hsa-miR-214-3p. Plotted values were first normalized by levels of U6 RNA, GAPDH mRNA, or GAPDH protein (A, B, and D, respectively) and then compared to normalized ratios as depicted in the plots. Each assay was performed in triplicate. *P < 0.05; **P < 0.001; NC, miRNA negative control.
3.4. Hsa-miR-214-3p reduces APAP-dependent cytotoxicity in HepG2CYP2E1 cells
In cases of APAP overdose, CYP2E1 activity produces the cytotoxic metabolite N-acetyl-benzoquinone imine that in turn induces cell injury, which could be indicated by an increased ALT release. We evaluated the role of hsa-miR-214-3p in suppressing CYP2E1-mediated APAP cytotoxicity by monitoring the time-dependent release of ALT activity from HepG2CYP2E1 cells exposed to APAP. Compared with untreated control HepG2CYP2E1 cells, increased ALT release was observed after 12 h (9.3% and 21.4%, P < 0.05) and 24 h (15.2% and 33.9%, P < 0.05) of exposure to 10 or 20 mM APAP, respectively (Fig. 4A). Next, we introduced hsa-miR-214-3p mimics or miRNA negative control (miR-NC) into HepG2CYP2E1 cells and then began exposure to 0 or 20 mM APAP 24 h later. In the absence of APAP, there were no significant differences in ALT release by HepG2CYP2E1 cells for 0–24 h between the cells containing hsa-miR-214-3p mimics or miR-NC (Fig. 4B). However, the introduction of hsa-miR-214-3p mimics into HepG2CYP2E1 cells led to a significant decrease in ALT release in response to 20 mM APAP for 24 h (22.6%, P < 0.05) in comparison to APAP-treated HepG2CYP2E1 cells containing the miRNA negative control (Fig. 4C).
Fig. 4.

Extracellular release of ALT activity in HepG2CYP2E1 exposed to APAP. (A) After treatment with 0, 10, 20 mM APAP, the release of ALT activity increased in the medium in a dose- and time-dependent manner. (B) In the absence of APAP, no difference in ALT release was detected in HepG2CYP2E1 cells transfected with hsa-miR-214-3p mimics or miR-NC (Upper panel). ALT release stimulated by 20 mM APAP suppressed after 24 h exposure by prior transfection with hsa-miR-214-3p mimics (Lower panel). Each assay was performed in triplicate. *P < 0.05; NC, negative control; miR-NC, miRNA negative control; acetaminophen, APAP.
3.5. Interactions between hsa-miR-214-3p or hsa-miR-942-5p and CYP2E1 coding regions in vitro
We performed RNA EMSAs to determine if either hsa-miR-214-3p or hsa-miR-294-5p is able to bind with their cognate CYP2E1 mRNA sequences directly in vitro. As shown in Fig. 5, complexes formed between hsa-miR-214-3p or hsa-miR-942-5p and their cognate CYP2E1 mRNA target sequences were observed in vitro (lane 3). Competition assays indicated the complex was sequence-specific for hsa-miR-214-3p and its cognate targets (Fig. 5A,B,C, Lane 5) but not for hsa-miR-942-5p and its cognate target (Fig. 5D, Lane 5). Next, we used HepaRG cytoplasmic extracts to investigate if miRNA/mRNA duplex complexes formed between hsa-miR-214-3p or hsa-miR-942-5p with cognate CYP2E1 mRNA sequences would recruit cellular factors to alter the electrophoretic nobilities of the nascent ribonucleoprotein complexes. We observed that RNA-protein complexes with altered electrophoretic motilities formed in the presence of HepaRG extracts between hsa-miR-214-3p miRNA and the CYP2E1 mRNA target 2 and target 3 (Fig. 5B, C, lane 6, 7), however no ribonucleoprotein complexes were detected between the hsa-miR-214-3p and the CYP2E1 target 1 or between hsa-miR-942-5p and its CYP2E1 cognate sequence in the presence of HepaRG extracts (Fig. 5A, D, lane 6, 7).
Fig. 5.

Hsa-miR-214-3p oligonucleotides interact directly with CYP2E1 mRNA oligonucleotides. RNA EMSA showed that hsa-miR-214-3p interacts with CYP2E1 mRNA oligonucleotides (three target sequences) to form stable complexes (Arrows) (lane 3 in A, B and C). The 50 × cold probe reduces the density associated with the hsa-miR-214-3p/CYP2E1 mRNA complex (lane 5 in A, B and C) but not with hsa-miR-942-5p (lane 5 in D). Hsa-miR-214-3p/CYP2E1 mRNA/protein complexes were observed by adding HepaRG protein extract in B and C (lane 6 and 7, Upper arrows in B and C), but similar complexes were not detected in A and D.
3.6. Hsa-miR-214-3p suppressed CYP2E1 expression from the autologous gene in HepaRG cells
We used HepaRG cells to compare the regulatory efficiencies of hsa-miR-214-3p, hsa-miR-942-5p, hsa-miR-378-5p, and hsa-miR 570-3p on CYP2E1 expression because HepaRG cells express most DMEs at levels comparable to those of primary human hepatocytes. As shown in Fig. 6A, the expression of hsa-miR-214-3p, hsa-miR-942-5p, hsa-miR-378a-5p, and hsa-miR-570-3p was significantly elevated after transfection of their mimics into HepaRG cells. However, only hsa-miR-214-3p, hsa-miR-378-5p and hsa-miR-570-3p, but not hsa-miR-942-5p, suppressed CYP2E1 RNA and protein levels in HepaRG cells (Fig. 6B, 32%; 45.6%; 10.5% and 32.5%; 49.6%; 19.5% decreased in RNA and the protein levels after transfection, respectively, all P < 0.05). Furthermore, hsa-miR-214-3p was more effective in repressing CYP2E1 RNA and protein expression than hsa-miR-570-3p, and was similarly effective as hsa-miR-378-5p (Fig. 6B, C and D).
Fig. 6.
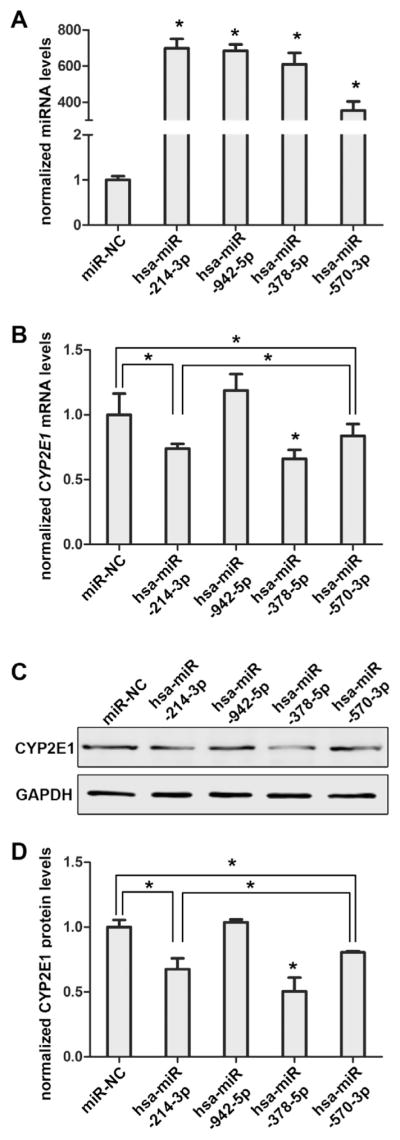
Hsa-miR-214-3p inhibited endogenous CYP2E1 expression in HepaRG cells. Differentiated HepaRG cells were transiently transfected using 40 nmol/L miRNA negative control or the mimics for hsa-miR-214-3p, hsa-miR-942-5p, hsa-miR-378-5p and hsa-miR-570-3p. Increased miRNA levels (A) and decreased CYP2E1 mRNA levels (B) were observed when transfected with hsa-miR-214-3p, hsa-miR-378-5p, hsa-miR-570-3p but not hsa-miR-942-5p in HepaRG cells. (C) Western blots with antibodies specific for CYP2E1 and GAPDH show that CYP2E1 protein levels are decreased in HepaRG cells when transfected with the hsa-miR-214-3p, hsa-miR-378-5p and hsa-miR-570-3p mimic but not hsa-miR-942-5p. (D) Quantitative densitometric analysis of immunoblotting images above. Each experiment was performed in triplicate. *P < 0.05; NC, miRNA negative control.
4. Discussion
DMEs play crucial roles in drug responses and clinical outcomes. In some cases the altered expression of DMEs contributes to disease susceptibility and to variations in drug efficacy and drug safety [23,30]. For a well-known example that is relevant to this study, CYP2E1 catalyzes the bioactivation of acetaminophen (APAP) to produce a reactive metabolite that leads to liver injury [31]. Alcohol consumption enhances CYP2E1 expression and this ethanol-dependent induction of CYP2E1 exacerbates the adverse effects of APAP overdose in patients [32].
Over the past two decades a number of pharmacogenetics studies have reported genetic variations within the promoters, coding regions, and 3′-UTRs of DME genes that are associated with significant functional effects on drug metabolism that influence drug safety and efficacy [30,33]. Recently, additional mechanistic insights have been gained from studies into epigenetic mechanisms that are also involved in the regulation of DME gene expression [34,35]. Along with DNA methylation and histone modifications, miRNAs are now known to contribute to the epigenetic regulation of genes involved in drug metabolism and drug targeting [17,20,21].
Target gene expression is suppressed by miRNAs in two principal ways, either by enhancing the rate of degradation for specific mRNA transcripts or by interfering with protein synthesis [18]. The formation of miRNA-containing RNA-induced silencing complexes (miRISC) is believed to be critical to accomplish both of these functions. It is also believed that specific cellular components present in these miRISCs, notably members of the Argonaute (Ago) protein family, are important for determining which of the two suppressive mechanisms regulating gene expression will predominate [36]. RISC-bound miRNAs exert their specificities for particular mRNA transcripts through molecular interactions involving nucleotides 2–9, their seed regions, with partially complementary sequences that are commonly located within the 3′-UTRs of mRNA transcripts and also through additional interactions formed between nucleotides present in 3′ regions of the RISC-bound miRNA and the target mRNA. Prior studies of CYP2E1 gene regulation have identified miRNAs that utilize miRNA binding sites present in the 3′-UTR of its mRNA transcript [13,19]. In addition to typical interactions with sequences found in the 3′-UTR regions of targeted mRNAs, accumulating evidence shows that miRNAs may also bind to the protein coding region of at least some mRNA transcripts either to inhibit translation or to facilitate mRNA degradation [37]. Interestingly, hsa-miRNA-552 was shown to act in a novel way to suppress both CYP2E1 translation and transcription; in addition to binding to a recognition sequence in the 3′-UTR of CYP2E1 mRNA to enhance its degradation, hsa-miRNA-552 present within the nucleus of the cell also hybridizes to a loop found in a cruciform structure of the CYP2E1 promoter to interfere with CYP2E1 transcriptional efficiency [14]. The variety of molecular mechanisms employed by miRNAs involved in the epigenetic regulation of CYP2E1 demonstrates the unusual versatility of this group of biomolecules.
It is estimated that a single miRNA species has the potential to regulate over 200 different types mRNA transcripts, and also the regulation of one gene may involve multiple miRNAs [38]. Transcription factors also regulate DME gene expression, a fact that can complicate the interpretation of the biochemical mechanisms of action for specific miRNAs. In principle, miRNAs usually affect DME gene expression in two ways: by interacting directly with the mRNA transcript for a DME gene as described above or through interactions with the mRNA transcript of a strategic transcription factor that then exerts a separate type of regulatory effect on DME gene expression [23]. These mechanistic alternatives can be resolved experimentally using the strategy employed in this study by which the interactions between predicted miRNA/mRNA binding partners were studied individually.
The full length CYP2E1 mRNA transcript was scanned in the current work to identify potential miRNA binding sites for known miRNAs. Next, we eliminated putative miRNA/mRNA hybrids with low affinity and selected those whose expression correlated negatively with CYP2E1 mRNA levels in human liver samples. Following this strategy the miRNAs hsa-miR-214-3p and hsa-miR-942-5p were selected for further study because in silico analysis predicted strong interactions between these miRNAs with putative recognition sequences present in CYP2E1mRNAand because we found negative correlations between CYP2E1 mRNA levels in human liver samples and the levels of these two miRNAs. Our results showed that hsa-miR-214-3p, but not hsa-miR-942-5p, suppresses CYP2E1 expression in HepG2CYP2E1 cells. Furthermore, the increased expression of CYP2E1 in HepG2 cells induced by ethanol was inhibited by transfection with the hsa-miR-214-3p mimic. We found that the predicted free energy of binding for a miRNA/mRNA complex is a critical screening factor for eliminating unstable regulatory complexes in our previous studies. In our current study, hsa-miR-214-3p suppressed the expression of CYP2E1 while hsa-miR-942-5p was unable to do so, which is consistent with the predicted trend of less favorable binding energy for the putative hsa-miR-942-3p/ CYP2E1 mRNA complex. The stability of any complex is controlled by the chemical equilibrium of the binding reaction. This relationship associates the Gibbs energy of binding with the equilibrium constant (ΔG = −RT ln Keq) and the concentrations of bound and free forms of the miRNA and mRNA species. We reasoned that we are less likely to overlook some functional miRNA interactions (i.e., avoid false negative predictions) by setting a conservative threshold of −20 kcal/mol for binding. By testing the stability and biological competence of each predicted miRNA/mRNA interaction experimentally, we endeavored to eliminate any false positive predictions in order to focus on those which are truly relevant biologically.
The release of ALT from hepatocytes is often used as an indicator of induced hepatotoxicity. We found that the introduction of an hsa-miR-214-3p mimic, but not an miRNA negative control mimic, into HepG2CYP2E1 cells inhibited ALT release during exposure to toxic levels of acetaminophen, which is consistent with the suppression of CYP2E1-mediated APAP cytotoxicity by hsa-miR-214-3p. RNA-EMSA also confirmed direct molecular interactions between hsa-miR-214-3p with two out of three predicted binding sites located in the coding region of CYP2E1 mRNA transcripts. We found that the hsa-miR-214-3p mimic introduced into HepaRG cells also caused decreased CYP2E1 expression in this hepatocyte-like system. Furthermore, the efficiency of suppressing the expression of CYP2E1 in HepaRG cells by hsa-miR-214-3p was equivalent to that of hsa-miR-378-3p, and stronger than that of miR-570. Because hsa-miRNA-552 had a higher inhibition efficiency than that of hsa-miR-378-3p towards CYP2E1 expression [14], we did not conduct experiments to compare the suppressing efficiencies between the hsa-miRNA-552 and hsa-miR-214-3p. In summary, compared with these previously reported miRNAs, the inhibition efficiency of CYP2E1 by hsa-miR-214-3p is less than that of hsa-miR-378-3p or hsa-miRNA-552, but greater than that of hsa-miR-570-3p.
Alcohol exposure contributes to liver injury through the production of cytotoxic reactive oxygen species (ROS) [39]. Ethanol is metabolized by some DMEs, including the CYP2E1 in liver tissues [40]. In this study, we used ethanol to stimulate increased CYP2E1 expression and then showed that its induction can be inhibited by hsa-miR-214-3p in HepG2 cells. The over consumption of ethanol enhances APAP toxicity in humans [41]. At higher doses, APAP is primarily metabolized by CYP2E1 in the liver to form the highly reactive free radical intermediate product, N-acetyl-p-benzoquinone imine (NAPQI), which displays significant hepatotoxicity [42]. Notably, the level of CYP2E1 expression is directly related to the degree of APAP-induced hepatotoxicity. In this study, we found that introducing hsa-miR-214-3p into HepG2CYP2E1 cells reduced the extent of ALT released to the medium when those cells were exposed to cytotoxic concentrations of APAP. This observation suggests that individual variations in hsa-miR-214-3p expression could be relevant to variations in the CYP2E1-mediated hepatotoxicity of APAP and perhaps also for additional drug-drug interactions which involve CYP2E1.
As mentioned above, members of the Ago protein family are prominent components of most miRNA-containing RISCs. Our previous studies showed that Ago 4 protein was present in complexes formed with HepaRG cell extracts incubated with synthetic oligonucleotides mimicking the miRNA hsa-miR-25-3p and its complementary site found in CYP2B6 mRNA [20]. However, Ago 1 protein was detected within complexes formed using HepaRG extracts incubated with oligonucleotide analogs for the miRNA hsa-miR-29a-3p and its binding site in the CYP2C19 mRNA transcript [21]. In the current study, we also found that ribonucleoprotein complexes can be formed between HepaRG extracts and oligonucleotides representing the miRNA hsa-miR-214-3p and two binding sites present within the coding region of CYP2E1 mRNA, but without a confirmation of Ago protein binding. We subjected the ribonucleoprotein complexes presented in Fig. 5 to mass spectral analyses and our preliminary data suggested that a group of mRNA or miRNA binding proteins are involved, but Ago proteins were not detected. A clearer picture of how these novel miRNA/protein complexes are able to accomplish their functions to regulate CYP2E1 expression will require further detailed biochemical and cell biological studies.
In summary, we demonstrated that hsa-miR-214-3p suppresses the expression of CYP2E1 in liver cells and that it interacts with two binding sites located in the protein coding region of the CYP2E1 mRNA transcript. Though the details of the molecular mechanism employed by hsa-miR-214-3p are not fully understood, our results provide a new perspective for gene regulatory functions involving hsa-miR-214-3p and its specific binding sites present in the CYP2E1 mRNA transcript. We predict that variations among different individuals in the expression of this and other miRNA species involved in CYP2E1 gene regulation could be associated with drug-drug interactions involving CYP2E1. Additional clinical studies will be required to evaluate the suitability of hsa-miR-214-3p as a biomarker for inter-individual differences in the CYP2E1-mediated hepatotoxicity associated with APAP overdose.
Acknowledgments
This study was supported and funded by the National Center for Toxicological Research (Project E0731311 and E0757801), U.S. Food and Drug Administration.
Footnotes
Disclaimer
The information in these materials is not a formal dissemination of the U.S. Food and Drug Administration.
Author contributions
Participated in Study design: Ning, Wang, Yu D., Tolleson, Guan and Guo.
Conducted experiments: Wang, Yu D, Yu L., Ren, Zeng, Chen S., Chen Y. and Knox.
Performed data analysis: Wang, Yu D., Yu L., Guo, Guan, Ning and Tong.
Wrote or contributed to the writing of the manuscript: Wang, Yu D., Tolleson, Tong and Ning.
Conflict of interest
The authors have no conflict of interest.
References
- 1.Leung TM, Nieto N. CYP2E1 and oxidant stress in alcoholic and non-alcoholic fatty liver disease. J Hepatol. 2013;58:395–398. doi: 10.1016/j.jhep.2012.08.018. [DOI] [PubMed] [Google Scholar]
- 2.Gonzalez FJ. The 2006 Bernard B. Brodie Award Lecture. Cyp2e1. Drug Metab Dispos. 2007;35:1–8. doi: 10.1124/dmd.106.012492. [DOI] [PubMed] [Google Scholar]
- 3.Sutti S, Rigamonti C, Vidali M, Albano E. CYP2E1 autoantibodies in liver diseases. Redox Biol. 2014;3:72–78. doi: 10.1016/j.redox.2014.11.004. [DOI] [PMC free article] [PubMed] [Google Scholar]
- 4.Miller GP. Advances in the interpretation and prediction of CYP2E1 metabolism from a biochemical perspective. Exp Opin Drug Metab Toxicol. 2008;4:1053–1064. doi: 10.1517/17425255.4.8.1053. [DOI] [PubMed] [Google Scholar]
- 5.Trafalis DT, Panteli ES, Grivas A, Tsigris C, Karamanakos PN. CYP2E1 and risk of chemically mediated cancers. Exp Opin Drug Metab Toxicol. 2010;6:307–319. doi: 10.1517/17425250903540238. [DOI] [PubMed] [Google Scholar]
- 6.Zanger UM, Schwab M. Cytochrome P450 enzymes in drug metabolism: regulation of gene expression, enzyme activities, and impact of genetic variation. Pharmacol Ther. 2013;138:103–141. doi: 10.1016/j.pharmthera.2012.12.007. [DOI] [PubMed] [Google Scholar]
- 7.Lieber CS. Cytochrome P-4502E1: its physiological and pathological role. Physiol Rev. 1997;77:517–544. doi: 10.1152/physrev.1997.77.2.517. [DOI] [PubMed] [Google Scholar]
- 8.Tanaka E, Funae Y. Trimethadione: metabolism and assessment of hepatic drug-oxidizing capacity. Methods Enzymol. 1996;272:163–169. doi: 10.1016/s0076-6879(96)72020-7. [DOI] [PubMed] [Google Scholar]
- 9.Lee SS, Buters JT, Pineau T, Fernandez-Salguero P, Gonzalez FJ. Role of CYP2E1 in the hepatotoxicity of acetaminophen. J Biol Chem. 1996;271:12063–12067. doi: 10.1074/jbc.271.20.12063. [DOI] [PubMed] [Google Scholar]
- 10.Caro AA, Cederbaum AI. Oxidative stress, toxicology, and pharmacology of CYP2E1. Annu Rev Pharmacol Toxicol. 2004;44:27–42. doi: 10.1146/annurev.pharmtox.44.101802.121704. [DOI] [PubMed] [Google Scholar]
- 11.Hu Y, Oscarson M, Johansson I, Yue QY, Dahl ML, Tabone M, et al. Genetic polymorphism of human CYP2E1: characterization of two variant alleles. Mol Pharmacol. 1997;51:370–376. [PubMed] [Google Scholar]
- 12.Song BJ, Gelboin HV, Park SS, Yang CS, Gonzalez FJ. Complementary DNA and protein sequences of ethanol-inducible rat and human cytochrome P-450s. Transcriptional and post-transcriptional regulation of the rat enzyme. J Biol Chem. 1986;261:16689–16697. [PubMed] [Google Scholar]
- 13.Nakano M, Mohri T, Fukami T, Takamiya M, Aoki Y, McLeod HL, et al. Single-nucleotide polymorphisms in cytochrome P450 2E1 (CYP2E1) 3′-untranslated region affect the regulation of CYP2E1 by miR-570. Drug Metab Dispos. 2015;43:1450–1457. doi: 10.1124/dmd.115.065664. [DOI] [PubMed] [Google Scholar]
- 14.Miao L, Yao H, Li C, Pu M, Yao X, Yang H, et al. A dual inhibition: microRNA-552 suppresses both transcription and translation of cytochrome P450 2E1. Biochim Biophys Acta. 2016;1859:650–662. doi: 10.1016/j.bbagrm.2016.02.016. [DOI] [PubMed] [Google Scholar]
- 15.Park HJ, Choi YJ, Kim JW, Chun HS, Im I, Yoon S, et al. Differences in the epigenetic regulation of cytochrome P450 genes between human embryonic stem cell-derived hepatocytes and primary hepatocytes. PLoS ONE. 2015;10:e0132992. doi: 10.1371/journal.pone.0132992. [DOI] [PMC free article] [PubMed] [Google Scholar]
- 16.Yu D, Green B, Marrone A, Guo Y, Kadlubar S, Lin D, et al. Suppression of CYP2C9 by microRNA hsa-miR-128-3p in human liver cells and association with hepatocellular carcinoma. Sci Rep. 2015;5:8534. doi: 10.1038/srep08534. [DOI] [PMC free article] [PubMed] [Google Scholar]
- 17.Yu D, Tolleson WH, Knox B, Jin Y, Guo L, Guo Y, et al. Modulation of ALDH5A1 and SLC22A7 by microRNA hsa-miR-29a-3p in human liver cells. Biochem Pharmacol. 2015;98:671–680. doi: 10.1016/j.bcp.2015.09.020. [DOI] [PMC free article] [PubMed] [Google Scholar]
- 18.Saito Y, Saito H, Liang G, Friedman JM. Epigenetic alterations and microRNA misexpression in cancer and autoimmune diseases: a critical review. Clin Rev Allergy Immunol. 2014;47:128–135. doi: 10.1007/s12016-013-8401-z. [DOI] [PMC free article] [PubMed] [Google Scholar]
- 19.Mohri T, Nakajima M, Fukami T, Takamiya M, Aoki Y, Yokoi T. Human CYP2E1 is regulated by miR-378. Biochem Pharmacol. 2010;79:1045–1052. doi: 10.1016/j.bcp.2009.11.015. [DOI] [PubMed] [Google Scholar]
- 20.Jin Y, Yu D, Tolleson WH, Knox B, Wang Y, Chen S, et al. MicroRNA hsa-miR-25-3p suppresses the expression and drug induction of CYP2B6 in human hepatocytes. Biochem Pharmacol. 2016;113:88–96. doi: 10.1016/j.bcp.2016.06.007. [DOI] [PMC free article] [PubMed] [Google Scholar]
- 21.Yu D, Green B, Tolleson WH, Jin Y, Mei N, Guo Y, et al. MicroRNA hsa-miR-29a-3p modulates CYP2C19 in human liver cells. Biochem Pharmacol. 2015;98:215–223. doi: 10.1016/j.bcp.2015.08.094. [DOI] [PMC free article] [PubMed] [Google Scholar]
- 22.Yu X, Dhakal IB, Beggs M, Edavana VK, Williams S, Zhang X, et al. Functional genetic variants in the 3′-untranslated region of sulfotransferase isoform 1A1 (SULT1A1) and their effect on enzymatic activity. Toxicol Sci. 2010;118:391–403. doi: 10.1093/toxsci/kfq296. [DOI] [PMC free article] [PubMed] [Google Scholar]
- 23.Koturbash I, Tolleson WH, Guo L, Yu D, Chen S, Hong H, et al. MicroRNAs as pharmacogenomic biomarkers for drug efficacy and drug safety assessment. Biomark Med. 2015;9:1153–1176. doi: 10.2217/bmm.15.89. [DOI] [PMC free article] [PubMed] [Google Scholar]
- 24.van Rooij E, Purcell AL, Levin AA. Developing microRNA therapeutics. Circ Res. 2012;110:496–507. doi: 10.1161/CIRCRESAHA.111.247916. [DOI] [PubMed] [Google Scholar]
- 25.Xuan J, Chen S, Ning B, Tolleson WH, Guo L. Development of HepG2-derived cells expressing cytochrome P450s for assessing metabolism-associated drug-induced liver toxicity. Chem Biol Interact. 2016;255:63–73. doi: 10.1016/j.cbi.2015.10.009. [DOI] [PMC free article] [PubMed] [Google Scholar]
- 26.Mukhopadhyay P, Rezzoug F, Kaikaus J, Greene RM, Pisano MM. Alcohol modulates expression of DNA methyltranferases and methyl CpG-/CpG domain-binding proteins in murine embryonic fibroblasts. Reprod Toxicol. 2013;37:40–48. doi: 10.1016/j.reprotox.2013.01.003. [DOI] [PMC free article] [PubMed] [Google Scholar]
- 27.Dai Y, Cederbaum AI. Cytotoxicity of acetaminophen in human cytochrome P4502E1-transfected HepG2 cells. J Pharmacol Exp Ther. 1995;273:1497–1505. [PubMed] [Google Scholar]
- 28.Choi JM, Oh SJ, Lee JY, Jeon JS, Ryu CS, Kim YM, et al. Prediction of drug-induced liver injury in HepG2 cells cultured with human liver microsomes. Chem Res Toxicol. 2015;28:872–885. doi: 10.1021/tx500504n. [DOI] [PubMed] [Google Scholar]
- 29.Verma VK, Li H, Wang R, Hirsova P, Mushref M, Liu Y, et al. Alcohol stimulates macrophage activation through caspase-dependent hepatocyte derived release of CD40L containing extracellular vesicles. J Hepatol. 2016;64:651–660. doi: 10.1016/j.jhep.2015.11.020. [DOI] [PMC free article] [PubMed] [Google Scholar]
- 30.Ning B, Su Z, Mei N, Hong H, Deng H, Shi L, et al. Toxicogenomics and cancer susceptibility: advances with next-generation sequencing. J Environ Sci Health C Environ Carcinog Ecotoxicol Rev. 2014;32:121–158. doi: 10.1080/10590501.2014.907460. [DOI] [PMC free article] [PubMed] [Google Scholar]
- 31.Zaher H, Buters JT, Ward JM, Bruno MK, Lucas AM, Stern ST, et al. Protection against acetaminophen toxicity in CYP1A2 and CYP2E1 double-null mice. Toxicol Appl Pharmacol. 1998;152:193–199. doi: 10.1006/taap.1998.8501. [DOI] [PubMed] [Google Scholar]
- 32.Prescott LF. Paracetamol, alcohol and the liver. Br J Clin Pharmacol. 2000;49:291–301. doi: 10.1046/j.1365-2125.2000.00167.x. [DOI] [PMC free article] [PubMed] [Google Scholar]
- 33.Relling MV, Evans WE. Pharmacogenomics in the clinic. Nature. 2015;526:343–350. doi: 10.1038/nature15817. [DOI] [PMC free article] [PubMed] [Google Scholar]
- 34.Wang Y, Li F, Zhang G, Kang L, Guan H. Ultraviolet-B induces ERCC6 repression in lens epithelium cells of age-related nuclear cataract through coordinated DNA hypermethylation and histone deacetylation. Clin Epigenetics. 2016;8:62. doi: 10.1186/s13148-016-0229-y. [DOI] [PMC free article] [PubMed] [Google Scholar]
- 35.Wang Y, Li F, Zhang G, Kang L, Qin B, Guan H. Altered DNA methylation and expression profiles of 8-oxoguanine DNA glycosylase 1 in lens tissue from age-related cataract patients. Curr Eye Res. 2015;40:815–821. doi: 10.3109/02713683.2014.957778. [DOI] [PubMed] [Google Scholar]
- 36.Wilczynska A, Bushell M. The complexity of miRNA-mediated repression. Cell Death Differ. 2015;22:22–33. doi: 10.1038/cdd.2014.112. [DOI] [PMC free article] [PubMed] [Google Scholar]
- 37.Akhtar N, Makki MS, Haqqi TM. MicroRNA-602 and microRNA-608 regulate sonic hedgehog expression via target sites in the coding region in human chondrocytes. Arthritis Rheumatol. 2015;67:423–434. doi: 10.1002/art.38952. [DOI] [PMC free article] [PubMed] [Google Scholar]
- 38.Esquela-Kerscher A, Slack FJ. Oncomirs – microRNAs with a role in cancer. Nat Rev Cancer. 2006;6:259–269. doi: 10.1038/nrc1840. [DOI] [PubMed] [Google Scholar]
- 39.Koehler BC, Arslic-Schmitt T, Peccerella T, Scherr AL, Schulze-Bergkamen H, Bruckner T, et al. Possible mechanisms of ethanol-mediated colorectal carcinogenesis: the role of cytochrome P4502E1, etheno-DNA adducts, and the anti-apoptotic protein Mcl-1. Alcohol Clin Exp Res. 2016;40:2094–2101. doi: 10.1111/acer.13180. [DOI] [PubMed] [Google Scholar]
- 40.Lu Y, Cederbaum AI. CYP2E1 and oxidative liver injury by alcohol. Free Radic Biol Med. 2008;44:723–738. doi: 10.1016/j.freeradbiomed.2007.11.004. [DOI] [PMC free article] [PubMed] [Google Scholar]
- 41.Pezzano M, Richard C, Lampl E, Pelletier G, Fabre M, Rimailho A, et al. Hepatic and renal toxicity of paracetamol in chronic alcoholic patient. Presse Med. 1988;17:21–24. [PubMed] [Google Scholar]
- 42.McGill MR, Williams CD, Xie Y, Ramachandran A, Jaeschke H. Acetaminophen-induced liver injury in rats and mice: comparison of protein adducts, mitochondrial dysfunction, and oxidative stress in the mechanism of toxicity. Toxicol Appl Pharmacol. 2012;264:387–394. doi: 10.1016/j.taap.2012.08.015. [DOI] [PMC free article] [PubMed] [Google Scholar]