

Abstract
Importance
Iron deficiency is present in approximately 50% of patients with heart failure with reduced left ventricular ejection fraction (HFrEF) and is an independent predictor of reduced functional capacity and mortality. However, the efficacy of inexpensive, readily available oral iron supplementation in heart failure is unknown.
Objective
To test whether therapy with oral iron improves peak exercise capacity in patients with HFrEF and iron deficiency.
Design, Setting, and Participants
Phase 2, double-blind, placebo-controlled randomized clinical trial of patients with HFrEF (<40%) and iron deficiency, defined as serum ferritin level between 15–100 ng/ml or serum ferritin 101-299 ng/ml with transferrin saturation (Tsat) <20%. Patients were enrolled between September 2014 and November 2015 at 23 US sites.
Interventions
Oral iron polysaccharide (n = 111) or placebo (n = 114), 150 mg twice daily for 16 weeks.
Main Outcomes and Measures
The primary endpoint was a change in peak oxygen uptake (VO2), from baseline to 16 weeks. Secondary endpoints included changes in six minute walk distance; plasma NT-pro BNP levels; and health status as assessed by Kansas City Cardiomyopathy Questionnaire (KCCQ, range 0-100, higher scores reflect better quality of life).
Results
Among 225 randomized patients (median age 63 years, 36% women) 203 completed the study. The median baseline peak VO2 was 1196 ml/min (887, 1448 ml/min) in the oral iron group and 1167 ml/min (887, 1449 ml/min) in the placebo group. The primary endpoint, change in peak VO2, did not significantly differ between the oral iron and placebo groups (+23 ml/min vs −2 ml/min; difference, 21 ml/min [95% CI, −34 to +76]; P=.46). Similarly, at 16 weeks there were no significant differences between treatment groups in changes in 6-minute walk distance (−13, −32 to 6m), NT-pro BNP levels (159, −280 to 599 pg/ml), KCCQ Score (1, −2.4 to 4.4) or time to first adverse event (hazard ratio 0.85, 0.56 to 1.31), all p>0.05.
Conclusion
Among patients with HFrEF with iron deficiency, high-dose oral iron did not improve exercise capacity over 16 weeks. These results do not support use of oral iron supplementation in patients with HFrEF.
Keywords: Heart Failure, Exercise, Iron
Subject Codes: Clinical Studies
Iron deficiency is the most common nutritional deficiency worldwide, affecting more than 15% of the global population as of 20101, and approximately one half of patients with symptomatic heart failure.2 The presence of iron deficiency in patients with heart failure, regardless of hemoglobin status, is associated with reduced functional capacity, poorer quality of life, and increased mortality.2,3
Iron plays a critical role in systemic oxygen (O2) delivery and utilization.3–6 Iron contributes to erythropoiesis and therefore iron deficiency decreases O2-carrying capacity of the blood through reduced hemoglobin levels. Iron is also an obligate component of enzymes involved in cellular respiration, oxidative phosphorylation, vascular homeostasis, nitric oxide generation, and the citric acid cycle.7,8 Hence, cells with high energy demands, including skeletal and cardiac myocytes, are particularly sensitive to depleted iron stores.9 Cardiac iron deficiency is present in patients with heart failure and associated with impaired mitochondrial function,10 abnormal sarcomere structure,5 and LV systolic dysfunction.11,12
Despite growing recognition of the functional and prognostic significance of iron deficiency, randomized multicenter trials exploring the utility of oral iron supplementation, a therapy that is inexpensive, readily available, and safe, have not been performed in patients with heart failure. Moreover, patient characteristics and biochemical profiles that may influence responsiveness to oral iron in patients with heart failure have not been defined. Although results of intravenous iron repletion trials have been favorable,13,14 regularly treating patients with intravenous iron products is expensive and poses logistical challenges for outpatients. The Iron Repletion effects ON Oxygen UpTake in Heart Failure (IRONOUT HF) trial was designed to test the hypothesis that, compared to placebo, oral iron repletion in heart failure patients with iron deficiency improves exercise capacity after 16 weeks of therapy.
METHODS
Study Oversight
All study participants provided written informed consent prior to enrollment. The National Heart, Lung, and Blood Institute–sponsored Heart Failure Clinical Research Network investigators conceived, designed, and conducted this study. The trial protocol was approved by a National Heart, Lung, and Blood Institute–appointed protocol review committee and data and safety monitoring board, and by the institutional review board at each participating site. The Duke Clinical Research Institute served as the coordinating center.
Study Design
The rationale for, and design of this study have been previously described,15 and the full protocol appears in Supplement 1. Patients with reduced left ventricular ejection fraction (≤40%) and heart failure with New York Heart Association functional class II through IV symptoms who were stable while receiving medical therapy were eligible to participate if they had objective evidence of iron deficiency (ferritin 15-100 ng/ml or between 100-299 ng/ml with a transferrin saturation [Tsat] below 20%) and hemoglobin levels between 9-15 g/dl (males) or 9-13.5 g/dl (females).15 Individuals were excluded if a neuromuscular, orthopedic or other non-cardiac condition prevented cardiopulmonary exercise testing (CPET). Inability to achieve a respiratory exchange ratio (RER) ≥ 1.0 on screening/baseline CPET was also an exclusion criterion. A complete list of the trial inclusion and exclusion criteria is provided in eTable 1 in Supplement 2.
Race, ethnicity and gender were included as data elements to satisfy the NHLBI Policy for Inclusion of Women and Minorities in Clinical Research. Race, Ethnicity and gender determinations were made by the participants and collected as fixed categories. Cardiopulmonary exercise testing was performed by CPET Core Lab certified sites using equipment and calibration approaches that met American Thoracic Society standards. CPETs were performed using a 10 Watt/minute incremental ramp protocol and breath-by-breath measures of oxygen uptake were uniformly analyzed by the CPET Core Lab. Quality control measures included repeated physiologic calibration testing with a normal individual to ensure proper equipment calibration and performance. Participants who met screening criteria underwent baseline studies, including history and physical examination, CPET, Kansas City Cardiomyopathy Questionnaire (KCCQ)16, 6-minute walk test, and phlebotomy for biomarkers, and were then randomly assigned, in a 1:1 ratio, to receive either oral iron polysaccharide or placebo with the use of an automated web-based system. A permuted block randomization method (with 4 participants per block) was stratified by enrolling site and anemia status (defined as hemoglobin < 12 g/dL).
Study drug was administered orally at 150 mg, twice daily for 16 weeks. At the end of 8 weeks participants underwent a history and physical examination and a 6-minute walk test in addition to completing a KCCQ quality of life questionnaire. At the end of 16 weeks, each subject’s history and physical examination, KCCQ, CPET and 6-minute walk test were repeated in the same order. If adverse effects developed, study staff could recommend discontinuation of study drug or dose frequency reduction to once daily. Blinded central core laboratories assessed biomarkers (University of Vermont) and CPET endpoints (Massachusetts General Hospital, Harvard University).
Study End Points
The primary end point was the change in peak oxygen uptake (peak VO2) after 16 weeks of therapy. Change in peak VO2 reflects the multiple mechanisms by which iron repletion is expected to improve systemic oxygen delivery and utilization, as previously described in the methods manuscript for this study.15 There is also significant intrinsic value to patients in improving impaired exercise capacity, a cardinal manifestation of HF. Secondary endpoints included assessments of: (1) submaximal exercise capacity, as measured by O2 uptake kinetics upon initiation of exercise;17 (2) ventilatory efficiency, as measured by minute ventilation relative to CO2 production throughout exercise; (3) 6 minute walk distance; (4) plasma NT-pro BNP levels; and (5) KCCQ. Exploratory objectives sought to determine if pre-specified subgroups of patients derive differential benefit from oral iron: (1) patients with or without anemia; (2) patients with or without venous congestion, based on jugular venous pressure (JVP) > 10 cm or lower extremity edema; and (3) patients with and without a respiratory exchange ratios (RER) greater than 1.1 during both maximum incremental exercise tests. Other exploratory objectives included whether oral iron repletion influenced clinical outcomes: time to death and heart failure hospitalization, O2 uptake at the ventilatory threshold, or renal function (creatinine, cystatin C). Iron studies (iron, total iron binding capacity, and ferritin) were measured at baseline and after 16 weeks of study medication to determine the extent to which oral iron led to iron repletion in HFrEF patients.
Hepcidin is a hepatically-derived peptide that inhibits intestinal iron absorption by interacting with its specific transmembrane receptor (ferroportin) on target cells. Hepcidin causes reduced expression of ferroportin, which is responsible for importing systemic iron from enterocytes and also iron release from the reticuloendothelial system.18–21 An iron-replete state stimulates hepcidin expression and reduces iron absorption. Iron depletion suppresses hepcidin levels and enhances iron absorption. Inflammation can also induce hepcidin expression independent of iron stores and thus, inappropriately limit iron absorption.22 Because heart failure is associated with increased inflammation, predisposing to hepcidin dysregulation, this study sought to determine if baseline hepcidin levels predicted oral iron responsiveness. In addition, we measured soluble transferrin receptor (sTr) levels because elevated levels are observed in states of high cellular avidity for iron but whether levels normalize with oral iron repletion is unknown.18 Therefore plasma hepcidin levels and soluble transferrin receptor levels were measured at baseline and after 16 weeks to gain mechanistic insight into oral iron responsiveness in heart failure.
Statistical Analysis
The full statistical analysis plan appears in Supplement 3. All primary analyses were based on the intention-to-treat principle meaning that study participants were analyzed as members of the treatment group to which they were randomized regardless of their adherence to, or whether they received, the intended treatment. A minimally important difference for peak VO2 of 1.0 ml/kg/min was used based on a previously determined significant relationship between that change in peak VO2 and heart failure outcomes.23 Using an estimate of 2.0 ml/kg/min for the standard deviation for peak VO2, a sample size of 172 participants (86 per group) provided 90% power to detect the minimally important difference with a two-sided type I error of 0.05. Allowing for 20% missing data (to account for death, study withdrawal, or missing data) resulted in a sample size of at least 108 per group.
Baseline data are presented as medians (25th, 75th percentiles). A general linear model with the change in peak VO2 measured at 16 weeks as the response variable and predictor variables including a treatment indicator and the baseline measure of peak VO2 was used in the primary analysis. The primary analysis for peak VO2 used multiple imputation techniques to address incomplete data (shown in the Statistical Analysis Plan). A sensitivity analysis of the peak VO2 outcome used the patients with complete data at baseline and 16 weeks. A mixed effects model was used to analyze site effects for the primary endpoint. For primary and secondary end points, p-values less than.05 were considered statistically significant with two-sided significance testing. All analyses were conducted with the use of SAS statistical software, version 9.4.
RESULTS
A total of 225 patients were enrolled in the trial from September 3, 2014, through November 18, 2015, at 23 sites in the United States. Baseline characteristics are presented in Table 1. The median age was 63 years and 36% of the participants were female. Median duration of heart failure was 5.7 years. Ischemic heart disease was the primary etiology of HFrEF in 78% of participants. Despite high rates of guideline directed medical therapies for HFrEF, the median NT-proBNP level at the time of enrollment was 1111 (453, 2412) pg/mL and the median left ventricular ejection fraction was 25% (20, 34%). Exercise capacity was reduced as evidenced by median peak VO2 of 13.2 (11.1, 15.7) ml/kg/min. Venous congestion was uncommon as only 12% of participants had jugular venous pressure elevation on examination and 10% of participants had at least mild peripheral edema. In the setting of low ferritin levels (median 69 ng/ml, IQR 40-98) and low Tsat levels (median 18%, IQR 15-22%), median hemoglobin levels were reduced at 12.6 g/dL. Levels of soluble transferrin receptors, which increase during states of iron deficiency and high cellular avidity for iron, were elevated with a median value of 3.8 (3.1, 4.8) mg/L. Plasma levels of the iron regulatory peptide hepcidin were also elevated with a median value of 7.0 (3.5, 11.4) ng/ml. Use of anti-platelet drugs (68%) and anticoagulants (46%) was common. There was no important differences in any of the baseline clinical, laboratory, or CPET characteristics between patients in the two treatment arms.
Table 1.
Baseline Characteristics of Patients
| Oral Iron N=111 |
Placebo N=114 |
All N=225 |
|
|---|---|---|---|
| Age, median (IQR), years | 63.0 (54-71) | 63 (55-70) | 63 (55-70) |
| Female sex, No. (%) | 44 (40%) | 36 (32%) | 80 (36%) |
| White race, No. (%)a | 79 (71%) | 85 (75%) | 164 (73%) |
| Racial minority, No. (%)a | 32 (29%) | 29 (25%) | 61 (27%) |
| Body mass index, median (IQR)b | 28.9 (25.3-33.7) | 29.6 (25.9-33.8) | 29.2 (25.7-33.8) |
| Left ventricular ejection fraction, %, median (IQR) | 25 (20-34) | 25 (20-33) | 25 (20-34) |
| Functional Measures | |||
| New York Heart Association Classification, Number (%) | |||
| II | 81 (73%) | 69 (61%) | 150 (67%) |
| III | 30 (27%) | 45 (39%) | 75 (33%) |
| KCCQ clinical summary score, median (IQR)c | 77.1 (63.5-89.6) | 74.2 (58.3-87.5) | 75.5 (61.5-88.5) |
| KCCQ overall summary score, median (IQR)c | 75.0 (59.6-87.3) | 70.1 (50.8-85.4) | 71.9 (56.0-85.9) |
| 6-minute walk distance, median (IQR), meters | 365 (304-433) | 360 (273-428) | 363(292-428) |
| Physical Examination | |||
| Weight, median (IQR), kg | 86 (71-100) | 90 (76-105) | 90 (75-103) |
| Systolic blood pressure, median (IQR), mm Hg | 112 (100,125) | 112 (98,125) | 112 (98,125) |
| Heart rate, median (IQR), beats/min | 70 (64, 77) | 73 (64, 80) | 71 (64, 79) |
| Elevated jugular venous pressure, Number (%) | 13 (12%) | 13 (11%) | 26 (12%) |
| Peripheral Edema, Number (%) | 14 (13%) | 9 (8%) | 23 (10%) |
| Medical History, Number (%) | |||
| Duration since diagnosis of heart failure, median (IQR), years | 5.3 (1.4-10.3) | 6.2 (2.0-9.8) | 5.7 (1.9-10.0) |
| Prior hospitalization for heart failure within past year | 46 (41%) | 51 (45%) | 97 (43%) |
| Ischemic heart disease | 86 (77%) | 89 (78%) | 175 (78%) |
| Hypertension | 80 (72%) | 82 (73%) | 162 (72%) |
| Atrial fibrillation | 43 (39%) | 43 (38%) | 86 (39%) |
| Diabetes mellitus | 38 (34%) | 50 (44%) | 88 (39%) |
| Stage ≥3 chronic kidney diseased | 21 (19%) | 31 (27%) | 52 (23%) |
| Heart Failure Medications at Enrollment, Number (%) | |||
| β-Blocker | 106 (95%) | 110 (96%) | 216 (96%) |
| ACE inhibitor or angiotensin II receptor blocker | 98 (88%) | 91 (80%) | 189 (84%) |
| Loop diuretic | 96 (86%) | 89 (79%) | 185 (83%) |
| Antiplatelet agent | 74 (67%) | 79 (69%) | 153 (68%) |
| Aldosterone antagonist | 68 (61%) | 68 (60%) | 136 (60%) |
| Anticoagulant agent | 55 (50%) | 49 (43%) | 104 (46%) |
| Digoxin | 23 (21%) | 27 (24%) | 50 (22%) |
| Long-acting nitrates | 21 (19%) | 25 (22%) | 46 (20%) |
| Hydralazine | 15 (14%) | 18 (16%) | 33 (15%) |
| Laboratory Measurements, median (IQR) | |||
| Creatinine (mg/dL) | 1.3 (1.0-1,6) | 1.2 (0.9-1.5) | 1.2 (1.0-1.5) |
| Cystatin C (mg/L) | 1.1 (0.9-1.3) | 1.1 (0.8-1.3) | 1.1 (0.8-1.3) |
| NT-proBNP (pg/ml)e | 1072 (413-2286) | 1170 (527-2530) | 1111 (453-2412) |
| Hemoglobin (g/dL) | 12.6 (11.7-13.3) | 12.7 (11.8-13.4) | 12.6 (11.8-13.3) |
| Iron (mcg/dL)e normal range: 60-170 mcg/dL | 71 (59 to 89) | 72 (53 to 94) | 62 (51-78) |
| Total iron binding capacity (mcg/dL)e normal: 240-450 mcg/dL | 383 (350 to 434) | 370 (336 to 415) | 349 (305-392) |
| Ferritin (ng/ml)e normal range: 15-300 ng/ml | 75 (43 to 108) | 70 (42 to 111) | 69 (40-98) |
| Transferrin Saturation (%)e normal range: 20-50% | 19 (16 to 24) | 20 (14 to 26) | 18- (15-22) |
| Soluble transferrin receptor (mg/L) normal range: 0.9-2.3 mg/L | 3.9 (3.2 to 4.8) | 3.8 (2.9 to 4.8) | 3.8 (3.1-4.8) |
| Hepcidin, ng/ml normal range < 6 ng/ml when iron deficient | 6.8 (3.4 to 11.3) | 7.4 (3.6 to 11.6) | 7.0 (3.5-11.4) |
| CPET Measurements, median (IQR) | |||
| Peak oxygen uptake (VO2, ml/min) | 1196 (887-1448) | 1167 (887-1449) | 1172 (887-1449) |
| Peak oxygen uptake (VO2, ml/kg/min) | 13.3 (11.4-15.8) | 12.9 (10.5-15.6) | 13.2 (11.1-15.7) |
| Peak respiratory exchange ratio | 1.1 (1.1-1.2) | 1.1 (1.1-1.2) | 1.1 (1.1-1.2) |
| Ventilatory efficiency (VE/VCO2 slope) | 35 (29-40) | 33 (30-39) | 34 (30-40) |
| Mean response time (O2 uptake kinetics), s | 50 (43-58) | 47 (40-58) | 48(43-58) |
| Ventilatory threshold (ml/min) | 675 (509-841) | 703 (580-853) | 695 (540-852) |
Abbreviation: IQR, quartile 1 - quartile 3; KCCQ, Kansas City Cardiomyopathy Questionnaire; β, beta; ACE, angiogensin converting enzyme; NT-pro BNP, N-terminus pro-B-type natriuretic peptide, VO2, oxygen uptake; VE/VCO2, minute ventilation/carbon dioxide elimination. CPET, cardiopulmonary exercise test. SI conversion factors: To calculate creatinine to umol/L, multiply by 88.4.
Race and ethnicity were self-reported.
Calculated as weight in kilograms divided by height in meters squared.
Range from 1 to 100; higher scores indicate better function.
Determined by enrollment site.
Determined by a central core lab.
At least one dose of study medication was received by all patients randomized to receive oral iron and 113 of the 114 patients randomized to receive placebo (Figure 1). Frequency of permanent study drug discontinuation prior to study termination were similar in the oral iron and placebo groups (14% and 15%, respectively, Figure 1) and the hazard ratio for time to permanent study drug discontinuation (0.90 favoring oral iron, 95% CI 0.45 to 1.79, p=0.76) did not significantly differ between groups.
Figure 1.
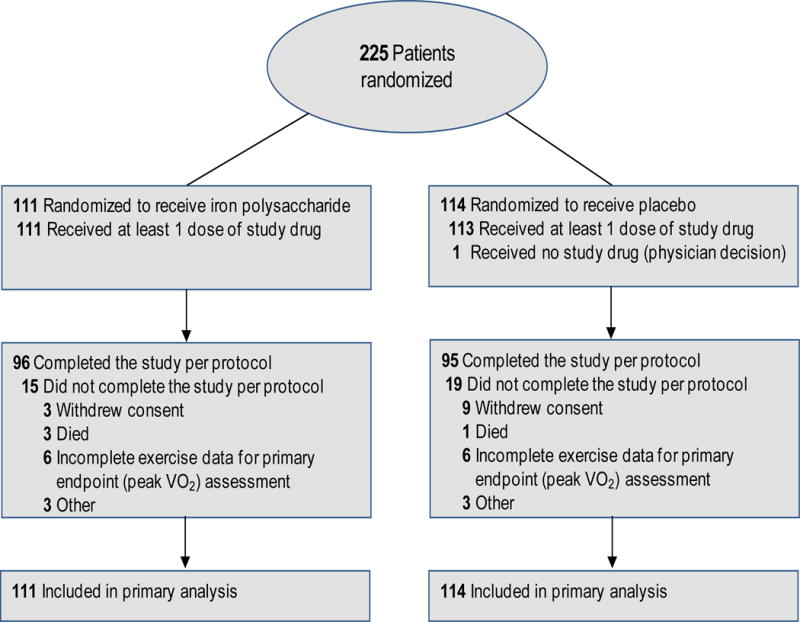
Patient flow diagram for the IRONOUT HF study; data on patients screened for eligibility were not available. Secondary end points were analyzed with multiple imputation techniques when data were unavailable for the endpoint.
Primary Endpoint
The median baseline peak VO2 was 1196 ml/min (887, 1448 ml/min) in the oral iron group and 1167 ml/min (887, 1449 ml/min) in the placebo group. The primary endpoint, change in peak VO2, did not differ between groups (oral iron +23 ml/min (95% CI, −84 to 142 ml/min) vs. placebo −2 ml/min (−110 to 104 ml/min), with a between group difference of 21 ml/min (−34, 76 ml/min, p=0.46, Table 2). The mean treatment difference in peak VO2 between oral iron and placebo was 0.3 ml/kg/min [−0.3, 0.9] ml/kg/min, p=0.30) when peak VO2 was normalized to body weight. Between-group differences in peak VO2 remained non-significant after adjustment for site effects using mixed effects modeling (oral iron +23 ml/min, [−28, 75], p = 0.37) and with sensitivity analyses using complete cases (oral iron + 23 ml/min, [−33, 80], p=0.42) and worst rank analyses (oral iron 108 and placebo 95 with higher values indicating greater positive change in peak VO2, p=0.46). In pre-specified subgroup analyses, the change in peak VO2 was not significantly different between treatment groups in males vs. females, patients with or without hemoglobin level <12g/dl in females and <13.5g/dl in males, patients with or without baseline venous congestion, or patients with and without peak respiratory exchange ratios above 1.1 (a threshold indicative of maximum volitional effort)24 on baseline and 16-week CPETs (Supplement 2).
Table 2.
Primary, Secondary, and Safety End Points
| Oral Iron Week 16 values* |
Placebo Week 16 values* |
Oral Iron Δ Week 16 |
Placebo Δ Week 16 |
Difference (95% CI) |
P value |
|
|---|---|---|---|---|---|---|
| Primary end point | ||||||
| Change in peak VO2 at 16 weeks, median (IQR), ml/min | 1218 (892 to 1500) | 1187 (902 to 1425) | 23 (−84 to 142) | −2 (−110 to 104) | 21 (−34 to 76) | 0.46 |
| Change in peak VO2 at 16 weeks, ml/kg/min | 13.5 (11.7 to 16.3) | 13.0 (10.2 to 15.9 | 0.20 (−1.1 to 1.6) | 0.01 (−1.1 to 0.9) | 0.30 (−0.27 to 0.87) | 0.30 |
| Secondary end points | ||||||
| Change in 6-minute walk distance at 8 weeks, meters | 380 (322 to 467) | 376 (286 to 448) | 15 (−17 to 55) | 21 (−24 to 56) | −1 (−24 to 23) | 0.95 |
| Change in 6-minute walk distance at 16 weeks, meters | 366 (315 to 456) | 397 (299 to 472) | 19 (−19 to 51) | 32 (−12 to 66) | −13 (−32 to 6) | 0.19 |
| Change in mean response time (O2 uptake kinetics), s | 52 (46 to 61) | 47 (40 to 58) | 2.5 (−7 to 9) | 1 (−10 to 6) | 3 (−2 to 8) | 0.19 |
| Change in ventilatory efficiency (VE/VCO2 slope) | 34.8 (29.9 to 41.1) | 33.5 (29.4 to 38.9) | −0.3 (−3.0 to 2.1) | −0.3 (−4.6 to 2.8) | 0.8 (−0.3 to 2.6) | 0.35 |
| Change in NT-proBNP, pg/ml | 889 (376 to 2373) | 1085 (447 to 2582) | 4 (−342 to 288) | −37 (−412 to 363) | 159 (−280 to 599) | 0.48 |
| Change in KCCQ clinical summary score at 8 weeks | 81.3 (70.8 to 91.7) | 75.0 (58.9 to 87.5) | 5.2 (−2.1 to 12.5) | 1.0 (−7.3 to 8.3) | 3.4 (−0.4 to 7.2) | 0.08 |
| Change in KCCQ clinical summary score at 16 weeks | 80.7 (67.7 to 91.6) | 77.1 65.1 to 89.6) | 3.1 (−4.2 to 13.5) | 3.0 (−4.2 to 10.4) | 1.0 (−2.4 to 4.4) | 0.57 |
| Exploratory Endpoints | ||||||
| Change in ventilatory threshold at 16 weeks (ml/min) | 685 (546 to 884) | 714 (558 to 873) | 22 (−49 to 127) | −2 (−86 to 75) | 36 (−3 to 76) | 0.07 |
| Change in creatinine at 16 weeks, mg/dL | 1.31 (1.01 to 1.56) | 1.21 (0.90 to 1.49) | 0.03 (−0.10 to 0.13) | 0.00 (−0.10 to 0.11) | −0.02 (−0.09 to 0.05) | 0.65 |
| Change in cystatin C at 16 weeks, mg/L | 1.06 (0.86 to 1.38) | 1.02 (0.78 to 1.31) | 0.02 (−0.04 to 0.09) | 0.01 (−0.08 to 0.07) | 0.03 (−0.01 to 0.08) | 0.12 |
| Safety end points, No. (%) | Odds Ratio (95% CI) | |||||
| Adverse events | 39 (35%) | 45 (39%) | 0.83 (0.48 to 1.43) | 0.50 | ||
| Serious adverse events | 11 (10%) | 10 (9%) | 1.14 (0.47 to 2.81) | 0.77 | ||
| Permanent study drug discontinuation | 15 (14%) | 17 (15%) | 0.90 (0.45 to 1.79) | 0.76 | ||
| Death or cardiovascular re-hospitalization | 14 (13%) | 12 (11%) | 1.19 (0.55 to 2.59) | 0.64 |
Values are for measurements made at week 16 unless otherwise specified for 8 week measurements. All data other than safety endpoints are displayed as medians with interquartile ranges (IQR). Abbreviation: VO2, volume of oxygen uptake. NT-BNP, N-terminus pro B-type natriuretic peptide; IQR, quartile 1 – quartile 3. KCCQ, Kansas City Cardiomyopathy Questionnaire. Higher value indicates improved clinical status.
Secondary End Points and Safety
At 16 weeks there were no significant differences between treatment groups in change in 6-minute walk distance (−13 [−32 to 6] m, p=0.19), NT-pro BNP levels (159 [−280 to 599] pg/ml, p=0.48), KCCQ Score (1 [−2.4 to 4.4], p=0.57), O2 uptake kinetics (3 [−2 to 8] s, p=0.19), or ventilatory efficiency, as indicated by the slope of minute ventilation relative to carbon dioxide elimination (VE/VCO2 slope, 0.8 [−0.3 to 2.6], p=0.35). The rates of serious adverse events observed with oral iron and placebo were similar, as reported in Table 2, eFigure 2 and eTable 2.
Exploratory Endpoints
At 16 weeks, when compared to placebo, oral iron was associated with an increment in VO2 at the ventilatory threshold that was not statistically significant (+36.4 ml/min [−3.4 to 76.2 ml/min], p=0.07). There were no differences in change in renal function between groups: creatinine (−0.02 [0.09 to 0.05] mg/dl, p=0.65) and Cystatin C (0.03 [−0.01 to 0.08] mg/L, p=0.12).
Iron bioavailability
Measures of exercise capacity (peak VO2: r = 0.17, p=0.01; 6-min walk distance: r = 0.28, p<0.001), as well as NT-pro BNP (r = −0.16, p=0.02) and KCCQ Clinical Summary Score (r = 0.28, p<0.001) were all positively correlated with baseline Tsat levels (18% [15 to 22%]).
Compared to placebo, oral iron increased Tsat levels (+3% [1-5%]; p=0.003) and ferritin levels (+11 ng/ml [0-23 ng/ml] p=0.06) (Table 3 and eTable 2). Levels of soluble transferrin receptors decreased in patients treated with oral iron compared to placebo (−0.3 [−0.6 to −0.1]; p=0.01, Table 3). Patients in the highest quartile of response in Tsat in response to oral iron demonstrated improvement in KCCQ clinical summary scores (5.2 [0.1 to 10.4], p=0.047), and an increase in VO2 at the ventilatory threshold (58 ml/min [−7 to 123 ml/min], p=0.08)that was not statistically significant. Changes in peak VO2 (r = 0.16, p=0.03) and in NT-Pro BNP (r = −0.18, p=0.02) correlated directly with change in Tsat.
Table 3.
Levels of iron metabolism markers according to treatment group
| Iron indices | Oral Iron 16 weeks |
Placebo 16 weeks |
Oral Iron Δ Week 16 |
Placebo Δ Week 16 |
Difference Δ Week 16 |
P value |
|---|---|---|---|---|---|---|
| Iron (mcg/dL) | 80 (59 to 99) | 72 (58 to 90) | 6 (−12 to 29) | 1 (−23 to 18) | 11.0 (2.8, 19.1) | 0.009 |
| TIBC (mcg/dL) | 371 (336 to 405) | 374 (339 to 428) | −12 (−43 to 5) | −0.5 (−22 to 17) | −13.4 (−22.2, −4.6) | 0.003 |
| Tsat (%) | 22 (16 to 28) | 20 (15 to 25) | 2 (−3 to 7) | 0 (−5 to 5) | 3.3 (1.1, 5.4) | 0.003 |
| Ferritin (ng/ml) | 95 (58 to 134) | 75 (42 to 123) | 18 (−8 to 38) | 1 (−15 to 17) | 11.3 (−0.3, 22.9) | 0.06 |
| Hepcidin (ng/ml) | 8.9 (5.0 to 14.3) | 7.8 (4.2 to 12.7) | 1.7 (−1.0 to 5.6) | −0.3 (−3.2 to 3.1) | 1.5 (−0.6, 3.7) | 0.17 |
| sTfR (mg/L) | 3.7 (2.9 to 4.4) | 3.9 (3.1 to 4.8) | −0.3 (−0.8 to 0.1) | 0.0 (−0.5 to 0.4) | −0.3 (−0.6, −0.1) | 0.01 |
TIBC, Total iron binding capacity; Tsat, transferrin saturation; sTfR, soluble transferrin receptor
Responders to Oral Iron Therapy
Median hepcidin levels increased from 6.7 to 8.9 ng/ml (+1.7, −1.0 to 5.6ng/ml, p=0.007) in the oral iron group, consistent with the anticipated response to increased iron exposure, and remained unchanged in the placebo group (7.4 to 7.8 ng/ml; −0.3, −3.2 to 3.1ng/ml, p=0.91). The between group comparison of change in hepcidin levels was not statistically significant (+1.5, −0.6 to 3.7ng/ml, p=0.17, Table 3).
In response to 16 weeks of oral iron across quartiles of increasing baseline hepcidin levels, there were reduced increments in Tsat and ferritin and a blunted fall in soluble transferrin receptor levels (Figure 2). Changes in Tsat (r = −0.29, p=0.004), ferritin (r = −0.30, p=0.004) and soluble transferrin receptor levels (r = 0.48, p<0.001) at 16 weeks were correlated with baseline hepcidin levels.
Figure 2.
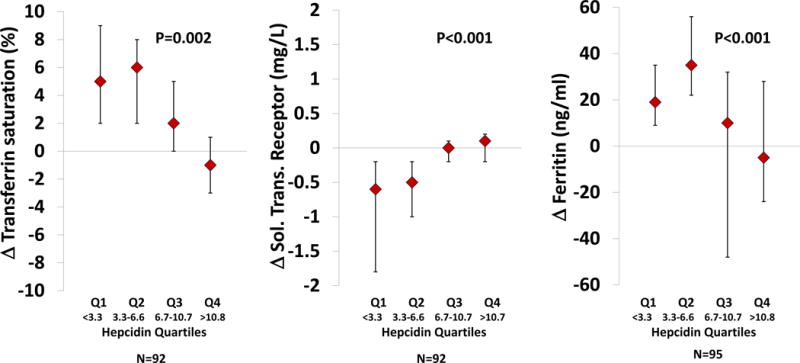
Relationships between quartiles of baseline plasma hepcidin levels and response of transferrin saturation (Panel A), ferritin (Panel B), and soluble transferrin receptor levels (Panel C) at week 16 in patients treated with iron polysaccharide. Hepcidin levels are reported in ng/ml. P-values indicate differences across all 4 quartiles using the Wilcoxan rank sum test.
DISCUSSION
High dose oral iron did not improve exercise capacity in patients with iron deficiency and HFrEF. The lack of effect of oral iron on exercise capacity, including peak VO2 and 6-min walk distance, and quality of life scores (KCCQ) stands in contrast to results from trials of intravenous iron repletion in similar patient populations.13,14,25 Also in contrast to previous studies with intravenous iron repletion, in this study, oral iron therapy produced minimal improvement in iron stores, implicating the route of administration rather than the strategy of iron repletion in the lack of clinical benefit. The significant relationship between higher baseline hepcidin levels and lack of iron repletion provides mechanistic insight into this study’s observed findings.
With the exception of one study that included 7 individuals randomized to oral iron,26 this is the first multicenter randomized clinical trial exploring the utility of oral iron supplementation in HFrEF patients with iron deficiency. In light of the failure of oral iron to improve measures of functional capacity in this study, a comparison of the patient populations and relative changes in iron stores to trials of intravenous iron repletion is warranted.
The patient population in this study was similar to that investigated in trials of intravenous iron repletion (FAIR-HF and CONFIRM-HF)13,14 in patient age and BMI as well as underlying HF etiology and baseline pharmacotherapy.13,14,13,14 In addition, baseline laboratory indices of iron stores were similar across the three studies. However, iron indices following oral, compared to intravenous iron repletion, differed markedly (eTable 3). Despite administering approximately 15-fold more iron orally in this study than that administered intravenously in FAIR-HF (i.e. 33.6g vs. ~2g), there was only a modest 3% median increment in Tsat and 11 ng/ml increment in ferritin in participants randomized to receive oral iron in this study, compared to a 70% increment in Tsat and 550% increment in ferritin with intravenous iron administration in the FAIR-HF Trial.13
There are several potential explanations for failure of oral iron to improve iron stores and exercise capacity in this trial. Hepcidin plays a critical role in inhibiting iron absorption.18–21 In this study, patients with higher baseline hepcidin levels demonstrated reduced Tsat and ferritin augmentation and an attenuated fall in soluble transferrin receptor levels in response to 16 weeks of oral iron (Figure 2). Taken together, these findings indicate that higher hepcidin levels may limit responsiveness to oral iron. Expected hepcidin levels in individuals with iron deficiency and anemia are below the values measured in this study.27,28
Other potential mediators of refractoriness to oral iron in heart failure seem less likely to have affected our findings. Use of anticoagulants and anti-platelet agents was prevalent but the rate of expected loss of iron (1-1.5mg/day) is markedly below the repletion dose (300 mg/day) administered. Therefore, in the absence of overt gastrointenstinal bleeding, which did not occur in any of the patients treated with oral iron during the trial, blood loss would not be expected to account for the observed minimal increases in iron stores with oral iron treatment.
The choice of iron polysaccharide formulation for this study was based on its offering the highest dose of elemental iron among available oral supplements, coupled with its tolerance profile to aid compliance and minimize risk of unblinding participants. Polysaccharide iron preparations have been shown to provide comparable iron repletion to iron salts.29–31 Recommended daily oral iron intake is 8-18 mg. Hence, even after accounting for limited gastrointestinal iron absorption, the 20-fold increase in oral iron exposure compared to recommended daily intake served to adequately test the hypothesis that oral iron supplementation would improve iron stores and functional capacity in HFrEF. The low incidence of oral iron discontinuation, which was 14% among patients receiving iron and 15% in the placebo group, argues against the observed findings being related to lack of compliance with oral iron.
The selection of change in peak VO2 for the primary endpoint, as previously described,15 was based on the fact that peak VO2 is the gold standard indicator of functional capacity in heart failure and has been shown to improve with iron repletion in non-heart failure populations. The lack of treatment effect on quality of life, NT-pro BNP and other physiologic end points is consistent with the observed lack of treatment effect on maximal exercise capacity. The exploratory endpoint, change in VO2 at the ventilatory threshold, showed a 5% increment in the iron group and no change in placebo, though the study may have been underpowered for this modest between-group difference to reach significance (p=0.08). Submaximum exercise capacity, indicative of endurance and independent of volitional effort, may be more sensitive to subtle changes in iron bioavailability, as opposed to peak VO2.8
Recognition of the high prevalence of iron deficiency (~50%) in patients with HFrEF and the consistent clinical benefit demonstrated in studies with intravenous iron repletion is motivating clinicians to prescribe iron supplementation. Based on the low cost and widespread availability of oral iron, and the logistical challenges with repeated administration of intravenous iron to outpatients with HF, this trial complements recent studies on intravenous iron treatment in informing the appropriate approach to iron repletion in HFrEF. This study’s findings of minimal changes in iron stores and lack of effect on peak exercise capacity suggests that prescription of oral iron in patients with HFrEF offers no benefit. However, the correlates observed between baseline iron indices and exercise capacity, as well as changes in Tsat being related to improvement in peak VO2 are consistent with results of recent trials suggesting beneficial effects of intravenous iron on functional capacity in HFrEF.
This study has some important limitations. This study was not powered to detect differences in clinical events or safety endpoints. There was also no direct comparison of intravenous and oral iron repletion. Given the relatively short duration of the trial, it is possible that longer duration or higher dose of exposure may have led to more significant improvement in iron stores and increased exercise capacity, particularly among those patients with appropriately low hepcidin levels. In addition, this study was confined to patients with HFrEF and findings may differ in heart failure with preserved ejection fraction.
Conclusions
Among patients with iron deficiency and HFrEF, high-dose oral iron minimally augmented iron stores and did not improve exercise capacity over 16 weeks. These findings do not support the use of oral iron supplementation to treat iron deficiency in patients with HFrEF.
Supplementary Material
Key Points.
Question
Does therapy with oral iron improve exercise capacity in patients with heart failure and iron deficiency?
Findings
In this randomized clinical trial of 225 adults with heart failure and reduced ejection fraction, oral iron polysaccharide minimally repleted iron stores and had no significant effect on exercise capacity at 16 weeks compared with placebo (+23ml/min vs. −2 ml/min, respectively).
Meaning
These findings do not support the use of oral iron supplementation in patients with heart failure and iron deficiency and reduced left ventricular ejection fraction.
Acknowledgments
Research Support: This research was supported by grants U10 HL084904 (awarded to the coordinating center) and U10HL110337, U10HL110302, U10HL110312, U10HL110262, U10HL110297, U10HL110342, U10 HL110309, U10 HL110336, and U10 HL110338 (awarded to the regional clinical centers) from the National Heart, Lung, and Blood Institute (NHLBI).
Role of the Funder/Sponsor: The NHLBI contributed to the design and conduct of the study; collection, management, analysis, and interpretation of the data; preparation, review, and approval of the manuscript; and the decision to submit the manuscript for publication. The NHLBI was not able to prevent manuscript submission.
Dr. Lewis has reported receiving grants from Abbott, Novartis, Shape Systems, Stealth BioTherapeutics, personal fees for consultancies from Ironwood, and Cheetah Medical and unpaid consultancies from Luitpold and Sonivie. Dr. Malhotra reported serving as a consultant for Akros Pharma, Inc and Third Pole. Dr. Hernandez reports grant support from Amgen, AstraZeneca, Bayer, BristolMyersSquibb, GlaxoSmithKline, Luitpold, Novartis and personal fees from Amgen, AstraZeneca, Bayer, BristolMyersSquibb, Boston Scientific, Luitpold, Novartis. Dr. Butler reports receiving grant support from the National Institutes of Health, European Union, and Patient Centered Outcomes Research Institute; and serves as a consultant to Amgen, Astra Zeneca, Bayer, Boehringer Ingelheim, Cardiocell, CVRx, Luitpold, Medtronic, Merck, Novartis, Relypsa, and ZS Pharma. Dr. Braunwald reports grant support to his institution from Duke University for his role as Chair of the NHLBI Heart Failure Network. For outside the submitted work, Dr. Braunwald reports grant support to his institution from Merck and Company, Astra Zeneca, Novartis, Daiichi Sankyo and Glaxo Smith Kline; personal fees for consultancies with The Medicines Company and Theravance; personal fees for lectures from Medscape and Menarini International; uncompensated consultancies and lectures from Merck and Novartis.
Footnotes
Clinical Trial Registration (www.ClinicalTrials.gov): NCT02188784
Contributor Information
Gregory D. Lewis, Massachusetts General Hospital, Boston, Massachusetts.
Rajeev Malhotra, Massachusetts General Hospital, Boston, Massachusetts.
Adrian F. Hernandez, Duke Clinical Research Institute, Durham, North Carolina.
Steven E. McNulty, Duke Clinical Research Institute, Durham, North Carolina.
Andrew Smith, Emory University, Atlanta, Georgia.
G. Michael Felker, Duke University School of Medicine and Duke Heart Center, Durham, North Carolina.
W.H. Wilson Tang, Cleveland Clinic, Cleveland, OH.
Shane J. LaRue, Washington University School of Medicine, St Louis, Missouri.
Margaret M. Redfield, Mayo Clinic, Rochester, Minnesota.
Marc J. Semigran, Massachusetts General Hospital, Boston, Massachusetts.
Michael M. Givertz, Brigham and Women’s Hospital, Boston, Massachusetts.
Peter Van Buren, University of Vermont Medical Center, Burlington, VT.
David Whellan, Thomas Jefferson University, Philadelphia, Pennsylvania.
Kevin J. Anstrom, Duke Clinical Research Institute, Durham, North Carolina.
Monica R. Shah, National Heart, Lung, and Blood Institute, Bethesda, Maryland.
Patrice Desvigne-Nickens, National Heart, Lung, and Blood Institute, Bethesda, Maryland.
Javed Butler, Stony Brook Medical Center, Stony Brook, NY.
Eugene Braunwald, Brigham and Women’s Hospital, Boston, Massachusetts.
References
- 1.Pasricha SR. Anemia: a comprehensive global estimate. Blood. 2014;123(5):611–612. doi: 10.1182/blood-2013-12-543405. [DOI] [PubMed] [Google Scholar]
- 2.Klip IT, Comin-Colet J, Voors AA, et al. Iron deficiency in chronic heart failure: an international pooled analysis. American heart journal. 2013;165(4):575–582 e573. doi: 10.1016/j.ahj.2013.01.017. [DOI] [PubMed] [Google Scholar]
- 3.Jankowska EA, Rozentryt P, Witkowska A, et al. Iron deficiency predicts impaired exercise capacity in patients with systolic chronic heart failure. Journal of cardiac failure. 2011;17(11):899–906. doi: 10.1016/j.cardfail.2011.08.003. [DOI] [PubMed] [Google Scholar]
- 4.Weiss G, Goodnough LT. Anemia of chronic disease. The New England journal of medicine. 2005;352(10):1011–1023. doi: 10.1056/NEJMra041809. [DOI] [PubMed] [Google Scholar]
- 5.Dong F, Zhang X, Culver B, Chew HG, Jr, Kelley RO, Ren J. Dietary iron deficiency induces ventricular dilation, mitochondrial ultrastructural aberrations and cytochrome c release: involvement of nitric oxide synthase and protein tyrosine nitration. Clinical science. 2005;109(3):277–286. doi: 10.1042/CS20040278. [DOI] [PubMed] [Google Scholar]
- 6.Toblli JE, Lombrana A, Duarte P, Di Gennaro F. Intravenous iron reduces NT-pro-brain natriuretic peptide in anemic patients with chronic heart failure and renal insufficiency. Journal of the American College of Cardiology. 2007;50(17):1657–1665. doi: 10.1016/j.jacc.2007.07.029. [DOI] [PubMed] [Google Scholar]
- 7.Dunn LL, Suryo Rahmanto Y, Richardson DR. Iron uptake and metabolism in the new millennium. Trends in cell biology. 2007;17(2):93–100. doi: 10.1016/j.tcb.2006.12.003. [DOI] [PubMed] [Google Scholar]
- 8.Haas JD, Brownlie Tt. Iron deficiency and reduced work capacity: a critical review of the research to determine a causal relationship. The Journal of nutrition. 2001;131(2S-2):676S–688S. doi: 10.1093/jn/131.2.676S. discussion 688S-690S. [DOI] [PubMed] [Google Scholar]
- 9.Andrews NC. Disorders of iron metabolism. The New England journal of medicine. 1999;341(26):1986–1995. doi: 10.1056/NEJM199912233412607. [DOI] [PubMed] [Google Scholar]
- 10.Melenovsky V, Petrak J, Mracek T, et al. Myocardial iron content and mitochondrial function in human heart failure: a direct tissue analysis. European journal of heart failure. 2016 doi: 10.1002/ejhf.1640. [DOI] [PubMed] [Google Scholar]
- 11.Georgieva Z, Georgieva M. Compensatory and adaptive changes in microcirculation and left ventricular function of patients with chronic iron-deficiency anaemia. Clinical hemorheology and microcirculation. 1997;17(1):21–30. [PubMed] [Google Scholar]
- 12.Jankowska EA, Ponikowski P. Molecular changes in myocardium in the course of anemia or iron deficiency. Heart failure clinics. 2010;6(3):295–304. doi: 10.1016/j.hfc.2010.03.003. [DOI] [PubMed] [Google Scholar]
- 13.Anker SD, Comin Colet J, Filippatos G, et al. Ferric carboxymaltose in patients with heart failure and iron deficiency. The New England journal of medicine. 2009;361(25):2436–2448. doi: 10.1056/NEJMoa0908355. [DOI] [PubMed] [Google Scholar]
- 14.Ponikowski P, van Veldhuisen DJ, Comin-Colet J, et al. Beneficial effects of long-term intravenous iron therapy with ferric carboxymaltose in patients with symptomatic heart failure and iron deficiencydagger. European heart journal. 2015;36(11):657–668. doi: 10.1093/eurheartj/ehu385. [DOI] [PMC free article] [PubMed] [Google Scholar]
- 15.Lewis GD, Semigran MJ, Givertz MM, et al. Oral Iron Therapy for Heart Failure With Reduced Ejection Fraction: Design and Rationale for Oral Iron Repletion Effects on Oxygen Uptake in Heart Failure. Circulation Heart failure. 2016;9(5) doi: 10.1161/CIRCHEARTFAILURE.1115.000345. [DOI] [PMC free article] [PubMed] [Google Scholar]
- 16.Green CP, Porter CB, Bresnahan DR, Spertus JA. Development and evaluation of the Kansas City Cardiomyopathy Questionnaire: a new health status measure for heart failure. Journal of the American College of Cardiology. 2000;35(5):1245–1255. doi: 10.1016/s0735-1097(00)00531-3. [DOI] [PubMed] [Google Scholar]
- 17.Chatterjee NA, Murphy RM, Malhotra R, et al. Prolonged mean VO2 response time in systolic heart failure: an indicator of impaired right ventricular-pulmonary vascular function. Circulation Heart failure. 2013;6(3):499–507. doi: 10.1161/CIRCHEARTFAILURE.112.000157. [DOI] [PMC free article] [PubMed] [Google Scholar]
- 18.Nemeth E, Valore EV, Territo M, Schiller G, Lichtenstein A, Ganz T. Hepcidin, a putative mediator of anemia of inflammation, is a type II acute-phase protein. Blood. 2003;101(7):2461–2463. doi: 10.1182/blood-2002-10-3235. [DOI] [PubMed] [Google Scholar]
- 19.Nicolas G, Chauvet C, Viatte L, et al. The gene encoding the iron regulatory peptide hepcidin is regulated by anemia, hypoxia, and inflammation. J Clin Invest. 2002;110(7):1037–1044. doi: 10.1172/JCI15686. [DOI] [PMC free article] [PubMed] [Google Scholar]
- 20.Ganz T. Hepcidin and iron regulation, 10 years later. Blood. 2011;117(17):4425–4433. doi: 10.1182/blood-2011-01-258467. [DOI] [PMC free article] [PubMed] [Google Scholar]
- 21.Nemeth E, Tuttle MS, Powelson J, et al. Hepcidin regulates cellular iron efflux by binding to ferroportin and inducing its internalization. Science. 2004;306(5704):2090–2093. doi: 10.1126/science.1104742. [DOI] [PubMed] [Google Scholar]
- 22.Franchini M, Montagnana M, Lippi G. Hepcidin and iron metabolism: from laboratory to clinical implications. Clinica chimica acta; international journal of clinical chemistry. 2010;411(21-22):1565–1569. doi: 10.1016/j.cca.2010.07.003. [DOI] [PubMed] [Google Scholar]
- 23.Swank AM, Horton J, Fleg JL, et al. Modest increase in peak VO2 is related to better clinical outcomes in chronic heart failure patients: results from heart failure and a controlled trial to investigate outcomes of exercise training. Circulation Heart failure. 2012;5(5):579–585. doi: 10.1161/CIRCHEARTFAILURE.111.965186. [DOI] [PMC free article] [PubMed] [Google Scholar]
- 24.Malhotra R, Bakken K, D’Elia E, Lewis GD. Cardiopulmonary Exercise Testing in Heart Failure. JACC Heart failure. 2016;4(8):607–616. doi: 10.1016/j.jchf.2016.03.022. [DOI] [PubMed] [Google Scholar]
- 25.Okonko DO, Grzeslo A, Witkowski T, et al. Effect of intravenous iron sucrose on exercise tolerance in anemic and nonanemic patients with symptomatic chronic heart failure and iron deficiency FERRIC-HF: a randomized, controlled, observer-blinded trial. Journal of the American College of Cardiology. 2008;51(2):103–112. doi: 10.1016/j.jacc.2007.09.036. [DOI] [PubMed] [Google Scholar]
- 26.Beck-da-Silva L, Piardi D, Soder S, et al. IRON-HF study: a randomized trial to assess the effects of iron in heart failure patients with anemia. International journal of cardiology. 2013;168(4):3439–3442. doi: 10.1016/j.ijcard.2013.04.181. [DOI] [PubMed] [Google Scholar]
- 27.van Santen S, van Dongen-Lases EC, de Vegt F, et al. Hepcidin and hemoglobin content parameters in the diagnosis of iron deficiency in rheumatoid arthritis patients with anemia. Arthritis and rheumatism. 2011;63(12):3672–3680. doi: 10.1002/art.30623. [DOI] [PubMed] [Google Scholar]
- 28.Choi HS, Song SH, Lee JH, Kim HJ, Yang HR. Serum hepcidin levels and iron parameters in children with iron deficiency. The Korean journal of hematology. 2012;47(4):286–292. doi: 10.5045/kjh.2012.47.4.286. [DOI] [PMC free article] [PubMed] [Google Scholar]
- 29.Jacobs P, Fransman D, Coghlan P. Comparative bioavailability of ferric polymaltose and ferrous sulphate in iron-deficient blood donors. Journal of clinical apheresis. 1993;8(2):89–95. doi: 10.1002/jca.2920080207. [DOI] [PubMed] [Google Scholar]
- 30.Wingard RL, Parker RA, Ismail N, Hakim RM. Efficacy of oral iron therapy in patients receiving recombinant human erythropoietin. American journal of kidney diseases: the official journal of the National Kidney Foundation. 1995;25(3):433–439. doi: 10.1016/0272-6386(95)90105-1. [DOI] [PubMed] [Google Scholar]
- 31.Glassman E. Oral iron therapy with ferrous fumarate and polysaccharide iron complex. ANNA journal/American Nephrology Nurses’ Association. 1992;19(3):277–278, 323. [PubMed] [Google Scholar]
Associated Data
This section collects any data citations, data availability statements, or supplementary materials included in this article.