

Abstract
The objective of this study was to investigate the relationship between accelerometer-measured physical activity (PA) and glucose metabolism in asymptomatic late-middle-aged adults. Ninety-three cognitively healthy late-middle-aged adults from the Wisconsin Registry for Alzheimer’s Prevention participated in this cross-sectional study. They underwent 18F-fluorodeoxyglucose positron emission tomography (FDG-PET) imaging and wore an accelerometer (ActiGraph GT3X+) to measure free-living PA. Accelerometer data yielded measures of light (LPA), moderate (MPA), and vigorous (VPA) intensity PA. FDG-PET images were scaled to the cerebellum and pons, and cerebral glucose metabolic rate was extracted from specific regions of interest (ROIs) known to be hypometabolic in AD, i.e., hippocampus, posterior cingulate, inferior temporal cortex, and angular gyrus. Regression analyses were utilized to examine the association between PA and glucose metabolism, while adjusting for potential confounds. There were associations between MPA and glucose metabolism in all ROIs examined. In contrast, LPA was not associated with glucose uptake in any ROI and VPA was only associated with hippocampal FDG uptake. Secondary analyses did not reveal associations between sedentary time and glucose metabolism in any of the ROIs. Exploratory voxel-wise analysis identified additional regions where MPA was significantly associated with glucose metabolism including the precuneus, supramarginal gyrus, amygdala, and middle frontal gyrus. These findings suggest that the intensity of PA is an important contributor to neuronal function in a late-middle-aged cohort, with MPA being the most salient. Prospective studies are necessary for fully elucidating the link between midlife engagement in PA and later life development of AD.
Keywords: Exercise, motor activity, neuroimaging, risk factor
INTRODUCTION
Cerebral hypometabolism, as measured by 18F-fluorodeoxyglucose positron emission tomography (FDG-PET), is a well-established characteristic of Alzheimer’s disease (AD) [1–3] and can even be detected in cognitively normal carriers of the strongest genetic risk factor for AD, the ε4 allele of the apolipoprotein E gene (APOE ε4) [4]. Specific brain regions vulnerable to hypometabolism in AD include the inferior temporal gyri, angular gyri, and posterior cingulate [5]. Additionally, decreased cerebral glucose metabolism is predictive of cognitive decline and conversion to AD among cognitively normal older adults [6, 7]. For these reasons, cerebral glucose metabolism is a strong candidate for preclinical evaluation of AD-related brain changes.
Physical activity (PA) has been shown to be associated with many indices of brain health [8–10] including cerebral glucose metabolism [11]. However, these studies have measured PA with questionnaires, which are subject to recall and social desirability biases [12]. The recent advent of the accelerometer, a device that continuously records PA, has made possible the objective measurement of free-living PA [13], and several studies have shown large variability between self-reported PA and accelerometer-measured PA, especially in older adults [12, 14].
Further, emerging evidence indicates that accelerometer-measured PA might be more sensitive than self-report measures when investigating AD-related outcomes, such as cognitive function [15]. Another important knowledge gap concerns whether the association between PA and brain health depends on the intensity of PA, as self-report measures generally do not include intensity measures [16]. Accordingly, the primary objective of this study was to examine the association between accelerometer-determined PA and cerebral glucose metabolism, with a specific focus on comparing light, moderate, and vigorous PA (LPA, MPA, and VPA, respectively). Secondary analyses examined the association between sedentary time and cerebral glucose metabolism.
MATERIALS AND METHODS
Standard protocol approvals, registrations, and patient consents
The University of Wisconsin Institutional Review Board approved all study procedures and each subject provided signed informed consent before participation.
Participants
Ninety-three cognitively healthy adults from the Wisconsin Registry for Alzheimer’s Prevention (WRAP) participated in this study. WRAP is a longitudinal registry composed of more than 1,500 cognitively normal late-middle-aged adults [17]. All 93 participants underwent FDG-PET and wore a triaxial accelerometer (Actigraph GT3X+, Actigraph LLC, Pensacola, FL), during waking hours, for 1 week. Similar to the entire WRAP cohort, the sample that provided data for this report was enriched with family history of AD (69.9%) and the APOE ε4 allele (46.2%).
Physical activity assessment
A triaxial accelerometer (Actigraph GT3X+, Actigraph LLC, Pensacola, FL) measured PA over 7 consecutive days. Participants were instructed to place the accelerometer on their hip, affixed to an elastic belt, and to wear the device during all waking hours, with the exception of when showering, swimming, or bathing. Standard accelerometry inclusion criteria consisted of at least 10 hours of valid wear time per day for a minimum of 3 weekdays and 1 weekend day [18]. Accelerometer data (in 1-s epochs) were processed using the sojourn-3 axis method [19] to calculate time spent in 3 well-established intensity categories of PA, that is LPA, MPA, VPA, and time spent sedentary. Briefly, this method utilizes information from all three axes (vertical, anterior-posterior, and medial-lateral) to identify independent bout intervals—the time between starting one activity (e.g., sitting, standing, walking, running, jumping, etc.) and transitioning to another—by instances of rapid acceleration or deceleration.
Within the sojourn-3 axis method [19], estimated metabolic equivalents (METs) are determined for each bout interval using a validated neural network approach [20], as opposed to the traditional counts-per-minute approach. The MET values were classified into PA intensity categories thus: <1.5 METs = sedentary, 1.5–2.99 METs = LPA, 3–6 METs = MPA, and >6 METs = vigorous VPA [18]. To account for individual variability in accelerometer wear-time the total minutes spent participating in bouts of each PA intensity category during a single day were then divided by the total minutes of wear-time for that day and averaged over all valid days to compute percent of day spent in sedentary, LPA, MPA, and VPA.
FDG-PET imaging, processing, and quantification
Participants underwent 3D FDG-PET imaging on a Siemens EXACT HR+ scanner (Siemens AG, Erlangen, Germany) after a minimum 4-h fast. Details on the acquisition and post-processing of the FDG-PET examinations have been previously described [10, 21]. Briefly, the scans were prescribed according to the Alzheimer’s Disease Neuroimaging Initiative (ADNI) protocol [22] which involved 5 mCi FDG injection followed by a 30-min uptake period and a 30-min transaxial acquisition. Post-processing was based on an in-house automated pipeline [23]. Each FDG-PET image was proportionally scaled to the mean FDG signal from the cerebellar vermis and pons [24].
For our analyses, we used the ADNI FDG Meta-ROI suite [5] to extract FDG-PET values from five brain regions found to be particularly hypometabolic in AD. These were the left and right inferior temporal gyri, the left and right angular gyri, and the posterior cingulate [5]. The ADNI FDG Meta-ROI suite also includes a composite measure of all five regions. Additionally, because of its relevance to PA [25, 26] and AD [27–29], we extracted FDG uptake values from the hippocampus bilaterally, using the Automated Anatomical Labeling (AAL) [30] atlas as implemented within the WFU PickAtlas toolbox [31]. The mean time between PET imaging and PA assessment was 0.87 ± 0.51 years.
Furthermore, due to the limited spatial coverage of the ADNI FDG Meta-ROIs, we performed an exploratory voxel-wise analysis to test for potential associations between PA and FDG uptake in other brain regions not included in the ROI analyses. To reduce the risk of false positive errors, we focused this analysis on brain regions implicated in AD cerebral metabolism [32] by imposing an a priori anatomical mask that included the bilateral superior and middle frontal cortices, superior and inferior parietal lobules, precuneus, posterior cingulate, parahippocampal gyrus, amygdala, and hippocampus using the AAL atlas [30] within the WFU PickAtlas toolbox [31].
Statistical analyses
Tests for model assumptions revealed that MPA and VPA were non-normally distributed whereas sedentary time and LPA did not deviate from a normal distribution. Therefore, we applied a Blom transformation to the MPA and VPA variables prior to model fitting.
To examine the association between FDG uptake in our ROIs and PA (LPA, MPA, and VPA), we fitted a linear regression model to each ROI measure, adjusting for age, sex, body mass index (BMI), and APOE ε4 status. All ROI analyses were performed in SPSS 20.0 (IBM Corp., Armonk, NY), and only findings with p ≤ 0.05 (two-tailed) were deemed significant.
The exploratory voxel-wise analysis for the association between FDG uptake and PA was fitted in SPM8 (http://www.filion.ucl.ac.uk/spm), and adjusted for age, sex, BMI, and APOE ε4 status. Reults were thresholded to clusters with a minimum of 100 contiguous voxels and pvoxel < 0.005. This a priori threshold was derived via Monte Carlo simulations (3dClustSim, AFNI (http://afni.nimh.nih.gov).
RESULTS
Background characteristics
Participants’ relevant background characteristics are listed in Table 1. The mean age was 63.93 ± 5.82 years and the majority were women (65.6%). The participants were slightly overweight (mean BMI = 28.11 ± 5.63 kg/m2) and a small number were taking a beta-blocker (7.5%). The participants had a mean Mini-Mental State Examination score of 29.28 ± .98, confirming their cognitively healthy status. On average, participants wore the actigraph for 15.33 ± 1.1 hours per day and recorded 6.5 ± .56 valid days of wear time.
Table 1.
Characteristics of study participants
| Variable | Value |
|---|---|
| Female, % | 65.6 |
| Age, years, mean (SD) | 63.93 (5.82) |
| Body mass index, kg/m2, mean (SD) | 28.11 (5.63) |
| Mini-Mental State Examination, mean (SD) | 29.28 (0.98) |
| APOE ε4 positive, % | 46.2 |
| Family history positive, % | 69.9 |
| On beta-blocker therapy, % | 7.5 |
| Actigraph worn, days, mean (SD) | 6.5 (0.56) |
| Actigraph daily wear time, hours, mean (SD) | 15.33 (1.1) |
| Sedentary %, mean (SD), median, IQR | 72.1 (7.5), 72.6, 10.7 |
| LPA %, mean (SD), median, IQR | 18.6 (5.4), 17.6, 7.1 |
| MPA %, mean (SD), median, IQR | 7.9 (3.3), 7.5, 4.1 |
| VPA %, mean (SD), median, IQR | 1.4 (1.4), 1.1, 1.6 |
APOE ε4, apolipoprotein E ε4 allele; LPA, light intensity physical activity; MPA, moderate intensity physical activity; VPA, vigorous intensity physical activity; IQR, interquartile range.
PA and cerebral glucose metabolism
There was a positive association between MPA and glucose metabolism in all the ROIs, including the composite measure. In contrast, LPA was not associated with glucose metabolism in any of the examined brain regions and VPA was only associated with FDG uptake in the hippocampus (see Table 2). To visualize these relationships, the participants were separated into equal tertiles (n = 31) for each PA intensity. The average minutes per day spent in LPA, MPA, and VPA are as follows: Tertile 1: 121.3, 43.3, 2.6; Tertile 2: 165.1, 68.1, 10.4; Tertile 3: 228.1, 105.7, 26.7. Differences in mean FDG uptake across the PA tertiles were tested using pairwise contrasts. Because the pattern of findings were consistent across all ROIs, we only present plots and associated pairwise contrasts for the composite FDG measure, as an exemplar for the other ROIs.
Table 2.
The association between physical activity intensity categories and FDG uptake
| ROI | LPA
|
MPA
|
VPA
|
|||
|---|---|---|---|---|---|---|
| β (SE) | p-value | β (SE) | p-value | β (SE) | p-value | |
| Hippocampus | −0.009 (0.126) | 0.940 | 0.015 (0.006) | 0.013 | 0.014 (0.006) | 0.027 |
| Posterior Cingulate | −0.448 (0.302) | 0.109 | 0.043 (0.014) | 0.003 | 0.015 (0.015) | 0.328 |
| Left Inferior Temporal | −0.511 (0.273) | 0.065 | 0.038 (0.013) | 0.004 | 0.023 (0.014) | 0.101 |
| Right Inferior Temporal | −0.111 (0.229) | 0.629 | 0.029 (0.011) | 0.008 | 0.023 (0.014) | 0.503 |
| Left Angular | −0.410 (0.286) | 0.155 | 0.041 (0.013) | 0.003 | 0.008 (0.012) | 0.132 |
| Right Angular | −0.234 (0.272) | 0.392 | 0.042 (0.013) | 0.001 | 0.022 (0.014) | 0.212 |
| Composite | −0.343 (0.254) | 0.181 | 0.041 (0.012) | 0.001 | 0.017 (0.013) | 0.181 |
Models were adjusted for age, sex, body mass index, and APOE ε4 status. FDG, 18F-fluorodeoxyglucose; ROI, region of interest; LPA, light intensity physical activity; MPA, moderate intensity physical activity; VPA, vigorous intensity physical activity; APOE ε4, apolipoprotein E ε4 allele.
As shown in Fig. 1, mean FDG uptake was highest in Tertile 3 and lowest in Tertile 1 for both MPA and VPA, and this difference was significant. For LPA, participants in Tertile 2 had greater FDG uptake compared to those in Tertiles 1 and 3. Additionally, for MPA, participants classified into Tertile 2 exhibited significantly greater FDG uptake than those in Tertile 1, suggesting that a modest increase in MPA engagement is associated with progressively higher glucose metabolism. This observation was not made for VPA where, instead, significant differences in FDG uptake were primarily seen between Tertile 1 and Tertile 3, suggesting that a substantial increase in VPA engagement might be required in order to derive further boost in cerebral glucose uptake.
Fig. 1.
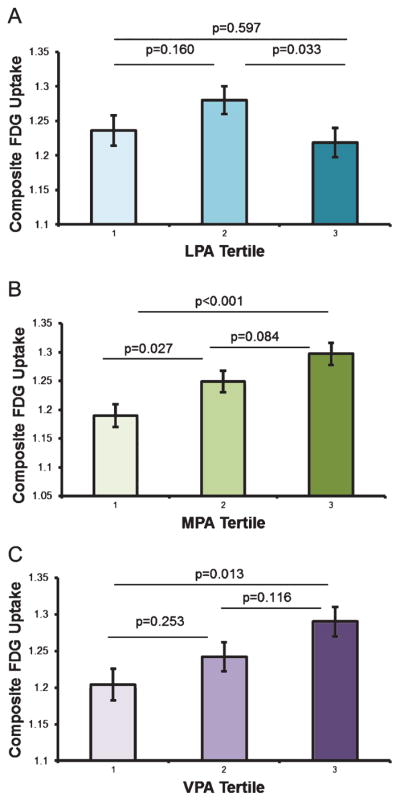
Physical activity tertiles and FDG uptake. Participants were grouped into equal tertiles (n = 31) for each physical activity intensity category, LPA (A), MPA (B), and VPA (C). Panels show adjusted means and standard error. FDG, 18F-fluorodeoxyglucose; LPA, light intensity physical activity; MPA, moderate intensity physical activity; VPA, vigorous intensity physical activity.
Lastly, to test for the specificity of our PA-FDG findings to AD-implicated brain regions, we examined the association between PA and FDG uptake in the primary visual cortex (V1), which is a region of the brain that is not usually affected in AD. FDG uptake in V1 was not associated with LPA (p = 0.638), MPA (p = 0.137), or VPA (p = 0.681).
Sedentary time and cerebral glucose metabolism
Sedentary time was not associated with cerebral glucose metabolism in any of the examined brain ROIs which included the hippocampus (p = 0.162), posterior cingulate (p = 0.927), left inferior temporal (p = 0.947), right inferior temporal (p = 0.436), left angular (p = 0.676), right angular (p = 0.359), or the composite measure (p = 0.562).
Exploratory voxel-wise analysis
Because MPA proved to be most robustly associated with glucose metabolism in the ROI analyses, it alone was selected for further testing in the voxel-wise analysis. This analysis revealed that MPA was significantly associated with FDG uptake in several brain regions (see Table 3 and Fig. 2). In the left hemisphere, these included the precuneus, posterior cingulate, supramarginal gyrus, superior medial frontal gyrus, hippocampus, and the middle frontal gyrus. In the right hemisphere, significant regions included the middle frontal gyrus, supramarginal gyrus, amygdala, and the superior medial frontal gyrus.
Table 3.
Voxel-wise associations between MPA and FDG uptake
| Anatomical Region | # of voxels in cluster | Peak T-value | MNI x,y,z coordinates |
|---|---|---|---|
| Right middle frontal gyrus | 769 | 4.12 | 26, 50, 4 |
| Right supramarginal gyrus | 909 | 4.45 | 46, −40, 26 |
| Left precuneus | 993 | 3.97 | −14, −58, 32 |
| Left superior medial frontal gyrus | 649 | 3.91 | −8, 70, 8 |
| Left supramarginal gyrus | 1473 | 3.86 | −52, −46, 34 |
| Left hippocampus | 100 | 3.59 | −14, −2, −14 |
| Right amygdala | 136 | 3.36 | 20, 2, −12 |
| Right supramarginal gyrus | 102 | 3.20 | 64, −16, 26 |
| Right superior medial frontal gyrus | 122 | 3.19 | 22, 52, 42 |
| Left posterior cingulate | 195 | 3.17 | −10, −40, 10 |
| Left middle frontal gyrus | 107 | 3.02 | −40, 24, 44 |
MPA, moderate intensity physical activity; FDG, 18F-fluorodeoxyglucose; MNI, Montreal Neurological Institute.
Fig. 2.

Exploratory voxel-wise analyses of association between MPA and FDG uptake. A: three-dimensional rendering of voxel-wise associations between MPA and FDG uptake adjusted for age, sex, body mass index, and APOE ε4 status. Results were thresholded at pvoxel < 0.005 and minimum of 100 contiguous voxels. Color bar represents t-values. Crosshair is placed at the global max, MNI 26, 50, 4 (middle frontal gyrus). B: scatter plot showing the bivariate association between MPA and FDG uptake at the global max, residualized for the influence of covariates. MPA, moderate intensity physical activity; FDG, 18F-fluorodeoxyglucose; APOE ε4, apolipoprotein E ε4 allele.
DISCUSSION
To our knowledge, this may be the first study to implement an objectively-measured PA assessment to investigate the relationship between PA and cerebral glucose metabolism. We report novel findings of positive associations between engagement in MPA and cerebral glucose metabolism, an association that was not present for LPA or VPA. Notably, there was an observed intensity gradient in the relationship between MPA and cerebral glucose metabolism, whereby with incremental increases in PA we found corresponding increases in cerebral glucose metabolism.
Mounting evidence suggests that PA and cardiorespiratory fitness may promote neuroprotective processes [10, 33–37] and may therefore be a potential non-pharmacological avenue for AD risk reduction. Apropos to the current study, Matthews and colleagues [11] investigated the relationship between leisure time PA and cerebral glucose metabolism. Utilizing the Minnesota Leisure Time Activity questionnaire, they found that individuals who engaged in the equivalent of at least 30 minutes of moderate activity five days a week had significantly higher levels of glucose metabolism in regions including the parahippocampal gyrus, fusiform gyrus, and middle temporal gyrus, compared to their physically inactive peers. Likewise, a recent study from our group [10] found that increased PA, determined from the Women’s Health Initiative PA questionnaire, ameliorated age-related changes in cerebral glucose metabolism.
These studies provide initial insight into the relationship between PA and glucose metabolism. However, the use of questionnaire-based measurements of PA has limitations, including subjective recall bias, especially when such bias is non-randomly distributed such that participants in one group (e.g., physically inactive) may inaccurately recall PA from past weeks compared with the other group (e.g., physically active). Additionally, self-reported PA questionnaires may be unreliable due to the difficulty in assessing non-structured PA and non-exercise activities such as performing housework or climbing stairs. Few studies have investigated the relationship between objectively-measured PA and AD biomarkers. In a recent cross-sectional investigation, Doi and colleagues [38] found that in older adults with MCI, objectively-measured moderate-to-vigorous PA was inversely associated with brain atrophy. This group also reported that moderate PA was positively associated with hippocampal volume in their MCI cohort [39]. In cognitively healthy older adults, Burzynska and colleagues [40] reported a relationship between engagement in moderate-to-vigorous PA and decreased white matter lesion burden, and Varma and colleagues [41] reported sex-specific relationships between light PA and hippocampal volume. Work from our group reported that older adults meeting PA recommendations displayed larger temporal lobe volumes than those not meeting recommendations [33]. Additionally, objectively measured PA has been positively associated with cognition [42–44] and may be a potential non-pharmacological avenue for AD risk reduction [15]. Our findings complement the results from these prior studies. We report significant association between engagement in moderate PA and cerebral glucose metabolism in all of our a priori ROIs as well as in voxel-wise analyses. These findings suggest that MPA might protect against hypometabolism in brain regions that are particularly susceptible to the pathophysiology of AD [5].
Additionally, while MPA was associated with increased cerebral glucose metabolism in all of the ROIs investigated, VPA was only associated with FDG uptake in the hippocampus, LPA and sedentary time were not associated wih the ROIs examined. This finding fits well with previous research. For example, Makizako and colleagues reported that MPA was positively associated with hippocampal volume in a cohort of older adults with MCI, but LPA was not [39]. In another study utilizing accelerometry, Brown and colleagues stratified a cohort of 217 older adults into tertiles based on PA intensity. Participants in the highest tertile, equivalent to MPA (4.4–6 METS), performed significantly better on multiple cognitive tasks compared to the lower two tertiles [43]. These prior findings, in combination with the current study, suggest that MPA may be more effective at promoting resilience to AD-related changes in both the brain and cognition, compared with LPA. However, other groups have reported contradicting findings [41]. It should be noted that our investigation into the relationship between VPA and glucose metabolism may be somewhat limited due to the restricted range of time spent in VPA amongst our sample (range = 0–74 min/day, mean(SD) = 13(13) min/day), in comparison with MPA (range = 20–191 min/day, mean(SD) = 72(30) min/day). Others have observed this limitation with VPA [43] as older adults are unlikely to engage in any vigorous activity [18].
Lastly, there appeared to be a step-wise increase in the benefits of MPA and VPA on glucose metabolism. When time spent engaging in MPA was separated into tertiles, those who were categorized into the lowest tertile (43.3 min/day) showed the least FDG uptake compared to the other tertile groups, but the middle (68.1 min/per day) and highest tertile (105.7 min/day) groups were not significantly different from each other. This suggests perhaps even a modest increase in MPA can be beneficial to brain health. Interestingly, when we looked at VPA tertiles, we found a difference between those in the lowest tertile (2.6 min/day) compared to their peers in the highest tertile (26.7 min/day), but found no difference between those in the lowest tertile against those in the middle tertile (10.4 min/day), or between the middle tertile group and the highest tertile. These findings may suggest that a larger dose of vigorous activity is necessary to receive similar benefits of PA on glucose metabolism.
Some limitations of this study include its cross-sectional nature. Future studies would benefit from a prospective design to elucidate causality and directionality of the observed relationships between PA and cerebral glucose metabolism. Secondly, although our model was adjusted for several important covariates, there are additional lifestyle habits that may accompany PA such as diet, sleep, and social factors that we were unable to control for. Additionally, the level of PA in our sample is not completely representative of the general population of middle-aged and older adults, as we have previously shown [33] that 32% of our sample met the weekly physical activity recommendations [45] which is a higher rate than the reported national average of 5% of older adults [18]. Further examination of these national data [18] suggests that even participants in the lowest tertile of the current study engaged in more MPA and VPA than the national average of late-middle-aged adults. Lastly, generalizability of our findings might be somewhat limited due to our sample’s demographic make-up (i.e., predominantly highly-educated non-Hispanic Whites). Future studies that include diverse populations are needed to determine whether our findings extend to other ethnic groups.
Overall, the present study provides encouraging evidence that PA may be beneficial for neurometabolic function. While others have reported that acute aerobic exercise [46] and aerobic training interventions [47] can alter cerebral glucose metabolism, our findings suggest that engagement in MPA, specifically, may promote cerebral glucose metabolism among cognitively normal late-middle-aged adults at risk for AD. While we cannot draw definitive conclusions regarding causation in this study, our findings, in the context of the literature suggest PA tracks closely with cerebral glucose metabolism. This work makes a critical contribution to the efforts to identify the intensity and duration of PA that confers the most advantage for combating AD-related changes in midlife.
Acknowledgments
The authors gratefully acknowledge Nancy Davenport-Sis, Amy Hawley, Sandra Harding, Jennifer Bond, Chuck Illingworth, and the support of researchers and staff at the Waisman Center, University of Wisconsin-Madison for their assistance in recruitment, data collection, and data analysis. Above all, the authors thank their dedicated volunteers for their participation in this research.
This work was supported by National Institute on Aging grants K23 AG045957 (OCO), R01 AG027161 (MAS), R01 AG031790 (CMC), R01 AG021155 (SCJ), P50 AG033514 (SA); by a Veterans Administration Merit Review Grant I01CX000165 (SCJ); and by a Clinical and Translational Science Award (UL1RR025011) to the University of Wisconsin, Madison. Portions of this research were supported by the Wisconsin Alumni Research Foundation, the Helen Bader Foundation, Northwestern Mutual Foundation, Extendicare Foundation, and from the Veterans Administration including facilities and resources at the Geriatric Research Education and Clinical Center of the William S. Middleton Memorial Veterans Hospital, Madison, WI.
Authors’ disclosures available online (http://j-alz.com/manuscript-disclosures/16-1067r1).
References
- 1.Alexander GE, Chen K, Pietrini P, Rapoport SI, Reiman EM. Longitudinal PET evaluation of cerebral metabolic decline in dementia: A potential outcome measure in Alzheimer’s disease treatment studies. Am J Psychiatry. 2002;159:738–745. doi: 10.1176/appi.ajp.159.5.738. [DOI] [PubMed] [Google Scholar]
- 2.de Leon MJ, Ferris SH, George AE, Reisberg B, Christman DR, Kricheff II, Wolf AP. Computed tomography and positron emission transaxial tomography evaluations of normal aging and Alzheimer’s disease. J Cereb Blood Flow Metab. 1983;3:391–394. doi: 10.1038/jcbfm.1983.57. [DOI] [PubMed] [Google Scholar]
- 3.Mosconi L, Tsui WH, De Santi S, Li J, Rusinek H, Convit A, Li Y, Boppana M, de Leon MJ. Reduced hippocampal metabolism in MCI and AD: Automated FDG-PET image analysis. Neurology. 2005;64:1860–1867. doi: 10.1212/01.WNL.0000163856.13524.08. [DOI] [PubMed] [Google Scholar]
- 4.Reiman EM, Caselli RJ, Yun LS, Chen K, Bandy D, Minoshima S, Thibodeau SN, Osborne D. Preclinical evidence of Alzheimer’s disease in persons homozygous for the epsilon 4 allele for apolipoprotein E. N Engl J Med. 1996;334:752–758. doi: 10.1056/NEJM199603213341202. [DOI] [PubMed] [Google Scholar]
- 5.Landau SM, Harvey D, Madison CM, Koeppe RA, Reiman EM, Foster NL, Weiner MW, Jagust WJ Initi AsDN. Associations between cognitive, functional, and FDG-PET measures of decline in AD and MCI. Neurobiol Aging. 2009;32:1207–1218. doi: 10.1016/j.neurobiolaging.2009.07.002. [DOI] [PMC free article] [PubMed] [Google Scholar]
- 6.de Leon MJ, Convit A, Wolf OT, Tarshish CY, DeSanti S, Rusinek H, Tsui W, Kandil E, Scherer AJ, Roche A, Imossi A, Thorn E, Bobinski M, Caraos C, Lesbre P, Schlyer D, Poirier J, Reisberg B, Fowler J. Prediction of cognitive decline in normal elderly subjects with 2-[(18)F]fluoro-2-deoxy-D-glucose/poitron-emission tomography (FDG/PET) Proc Natl Acad Sci U S A. 2001;98:10966–10971. doi: 10.1073/pnas.191044198. [DOI] [PMC free article] [PubMed] [Google Scholar]
- 7.Small GW, Ercoli LM, Silverman DH, Huang SC, Komo S, Bookheimer SY, Lavretsky H, Miller K, Siddarth P, Rasgon NL, Mazziotta JC, Saxena S, Wu HM, Mega MS, Cummings JL, Saunders AM, Pericak-Vance MA, Roses AD, Barrio JR, Phelps ME. Cerebral metabolic and cognitive decline in persons at genetic risk for Alzheimer’s disease. Proc Natl Acad Sci U S A. 2000;97:6037–6042. doi: 10.1073/pnas.090106797. [DOI] [PMC free article] [PubMed] [Google Scholar]
- 8.Brown BM, Peiffer JJ, Taddei K, Lui JK, Laws SM, Gupta VB, Taddei T, Ward VK, Rodrigues MA, Burnham S, Rainey-Smith SR, Villemagne VL, Bush A, Ellis KA, Masters CL, Ames D, Macaulay SL, Szoeke C, Rowe CC, Martins RN. Physical activity and amyloid-beta plasma and brain levels: Results from the Australian Imaging, Biomarkers and Lifestyle Study of Ageing. Mol Psychiatry. 2013;18:875–881. doi: 10.1038/mp.2012.107. [DOI] [PubMed] [Google Scholar]
- 9.Smith JC, Nielson KA, Woodard JL, Seidenberg M, Durgerian S, Hazlett KE, Figueroa CM, Kandah CC, Kay CD, Matthews MA, Rao SM. Physical activity reduces hippocampal atrophy in elders at genetic risk for Alzheimer’s disease. Front Aging Neurosci. 2014;6:61. doi: 10.3389/fnagi.2014.00061. [DOI] [PMC free article] [PubMed] [Google Scholar]
- 10.Okonkwo OC, Schultz SA, Oh JM, Larson J, Edwards D, Cook D, Koscik R, Gallagher CL, Dowling NM, Carlsson CM, Bendlin BB, LaRue A, Rowley HA, Christian BT, Asthana S, Hermann BP, Johnson SC, Sager MA. Physical activity attenuates age-related biomarker alterations in preclinical AD. Neurology. 2014;83:1753–1760. doi: 10.1212/WNL.0000000000000964. [DOI] [PMC free article] [PubMed] [Google Scholar]
- 11.Matthews DC, Davies M, Murray J, Williams S, Tsui WH, Li Y, Andrews RD, Lukic A, McHugh P, Vallabhajosula S, de Leon MJ, Mosconi L. Physical activity, Mediterranean diet and biomarkers-assessed risk of Alzheimer’s: A multi-modality brain imaging study. Adv J Mol Imaging. 2014;4:43–57. doi: 10.4236/ami.2014.44006. [DOI] [PMC free article] [PubMed] [Google Scholar]
- 12.Dyrstad SM, Hansen BH, Holme IM, Anderssen SA. Comparison of self-reported versus accelerometer-measured physical activity. Med Sci Sports Exerc. 2014;46:99–106. doi: 10.1249/MSS.0b013e3182a0595f. [DOI] [PubMed] [Google Scholar]
- 13.Berlin JE, Storti KL, Brach JS. Using activity monitors to measure physical activity in free-living conditions. Phys Ther. 2006;86:1137–1145. [PubMed] [Google Scholar]
- 14.Celis-Morales CA, Perez-Bravo F, Ibanez L, Salas C, Bailey ME, Gill JM. Objective vs. self-reported physical activity and sedentary time: Effects of measurement method on relationships with risk biomarkers. PLoS One. 2012;7:e36345. doi: 10.1371/journal.pone.0036345. [DOI] [PMC free article] [PubMed] [Google Scholar]
- 15.Buchman AS, Wilson RS, Bennett DA. Total daily activity is associated with cognition in older persons. Am J Geriatr Psychiatry. 2008;16:697–701. doi: 10.1097/JGP.0b013e31817945f6. [DOI] [PubMed] [Google Scholar]
- 16.Shephard RJ. Limits to the measurement of habitual physical activity by questionnaires. Br J Sports Med. 2003;37:197–206. doi: 10.1136/bjsm.37.3.197. [DOI] [PMC free article] [PubMed] [Google Scholar]
- 17.Sager MA, Hermann B, La Rue A. Middle-aged children of persons with Alzheimer’s disease: APOE genotypes and cognitive function in the Wisconsin Registry for Alzheimer’s Prevention. J Geriatr Psychiatry Neurol. 2005;18:245–249. doi: 10.1177/0891988705281882. [DOI] [PubMed] [Google Scholar]
- 18.Troiano RP, Berrigan D, Dodd KW, Masse LC, Tilert T, McDowell M. Physical activity in the United States measured by accelerometer. Med Sci Sports Exerc. 2008;40:181–188. doi: 10.1249/mss.0b013e31815a51b3. [DOI] [PubMed] [Google Scholar]
- 19.Lyden K, Keadle SK, Staudenmayer J, Freedson PS. A method to estimate free-living active and sedentary behavior from an accelerometer. Med Sci Sports Exerc. 2014;46:386–397. doi: 10.1249/MSS.0b013e3182a42a2d. [DOI] [PMC free article] [PubMed] [Google Scholar]
- 20.Staudenmayer J, Pober D, Crouter S, Bassett D, Freedson P. An artificial neural network to estimate physical activity energy expenditure and identify physical activity type from an accelerometer. J Appl Physiol (1985) 2009;107:1300–1307. doi: 10.1152/japplphysiol.00465.2009. [DOI] [PMC free article] [PubMed] [Google Scholar]
- 21.Johnson SC, Christian BT, Okonkwo OC, Oh JM, Harding S, Xu GF, Hillmer AT, Wooten DW, Murali D, Barnhart TE, Hall LT, Racine AM, Klunk WE, Mathis CA, Bendlin BB, Gallagher CL, Carlsson CM, Rowley HA, Hermann BP, Dowling NM, Asthana S, Sager MA. Amyloid burden and neural function in people at risk for Alzheimer’s Disease. Neurobiol Aging. 2014;35:576–584. doi: 10.1016/j.neurobiolaging.2013.09.028. [DOI] [PMC free article] [PubMed] [Google Scholar]
- 22.Jagust WJ, Bandy D, Chen K, Foster NL, Landau SM, Mathis CA, Price JC, Reiman EM, Skovronsky D, Koeppe RA Alzheimer’s Disease Neuroimaging Initiative. The Alzheimer’s Disease Neuroimaging Initiative positron emission tomography core. Alzheimers Dement. 2010;6:221–229. doi: 10.1016/j.jalz.2010.03.003. [DOI] [PMC free article] [PubMed] [Google Scholar]
- 23.Floberg JM, Mistretta CA, Weichert JP, Hall LT, Holden JE, Christian BT. Improved kinetic analysis of dynamic PET data with optimized HYPR-LR. Med Phys. 2012;39:3319–3331. doi: 10.1118/1.4718669. [DOI] [PMC free article] [PubMed] [Google Scholar]
- 24.Jagust WJ, Landau SM Alzheimer’s Disease Neuroimaging Initiative. Apolipoprotein E, not fibrillar beta-amyloid, reduces cerebral glucose metabolism in normal aging. J Neurosci. 2012;32:18227–18233. doi: 10.1523/JNEUROSCI.3266-12.2012. [DOI] [PMC free article] [PubMed] [Google Scholar]
- 25.Erickson KI, Voss MW, Prakash RS, Basak C, Szabo A, Chaddock L, Kim JS, Heo S, Alves H, White SM, Wojcicki TR, Mailey E, Vieira VJ, Martin SA, Pence BD, Woods JA, McAuley E, Kramer AF. Exercise training increases size of hippocampus and improves memory. Proc Natl Acad Sci U S A. 2011;108:3017–3022. doi: 10.1073/pnas.1015950108. [DOI] [PMC free article] [PubMed] [Google Scholar]
- 26.Voss MW, Vivar C, Kramer AF, van Praag H. Bridging animal and human models of exercise-induced brain plasticity. Trends Cogn Sci. 2013;17:525–544. doi: 10.1016/j.tics.2013.08.001. [DOI] [PMC free article] [PubMed] [Google Scholar]
- 27.de Leon MJ, Convit A, George AE, Golomb J, de Santi S, Tarshish C, Rusinek H, Bobinski M, Ince C, Miller D, Wisniewski H. In vivo structural studies of the hippocampus in normal aging and in incipient Alzheimer’s disease. Ann N Y Acad Sci. 1996;777:1–13. doi: 10.1111/j.1749-6632.1996.tb34395.x. [DOI] [PubMed] [Google Scholar]
- 28.Du AT, Schuff N, Amend D, Laakso MP, Hsu YY, Jagust WJ, Yaffe K, Kramer JH, Reed B, Norman D, Chui HC, Weiner MW. Magnetic resonance imaging of the entorhinal cortex and hippocampus in mild cognitive impairment and Alzheimer’s disease. J Neurol Neurosurg Psychiatry. 2001;71:441–447. doi: 10.1136/jnnp.71.4.441. [DOI] [PMC free article] [PubMed] [Google Scholar]
- 29.Ball MJ. Neuronal loss, neurofibrillary tangles and granulovacuolar degeneration in the hippocampus with ageing and dementia. A quantitative study. Acta Neuropathol. 1977;37:111–118. doi: 10.1007/BF00692056. [DOI] [PubMed] [Google Scholar]
- 30.Tzourio-Mazoyer N, Landeau B, Papathanassiou D, Crivello F, Etard O, Delcroix N, Mazoyer B, Joliot M. Automated anatomical labeling of activations in SPM using a macroscopic anatomical parcellation of the MNI MRI single-subject brain. Neuroimage. 2002;15:273–289. doi: 10.1006/nimg.2001.0978. [DOI] [PubMed] [Google Scholar]
- 31.Maldjian JA, Laurienti PJ, Kraft RA, Burdette JH. An automated method for neuroanatomic and cytoarchitectonic atlas-based interrogation of fMRI data sets. Neuroimage. 2003;19:1233–1239. doi: 10.1016/s1053-8119(03)00169-1. [DOI] [PubMed] [Google Scholar]
- 32.Okonkwo OC, Xu G, Oh JM, Dowling NM, Carlsson CM, Gallagher CL, Birdsill AC, Palotti M, Wharton W, Hermann BP, LaRue A, Bendlin BB, Rowley HA, Asthana S, Sager MA, Johnson SC. Cerebral blood flow is diminished in asymptomatic middle-aged adults with maternal history of Alzheimer’s disease. Cereb Cortex. 2014;24:978–988. doi: 10.1093/cercor/bhs381. [DOI] [PMC free article] [PubMed] [Google Scholar]
- 33.Dougherty RJ, Ellingson LD, Schultz SA, Boots EA, Meyer JD, Lindheimer JB, Van Riper S, Stegner AJ, Edwards DF, Oh JM, Koscik RL, Dowling MN, Gallagher CL, Carlsson CM, Rowley HA, Bendlin BB, Asthana S, Hermann BP, Sager MA, Johnson SC, Okonkwo OC, Cook DB. Meeting physical activity recommendations may be protective against temporal lobe atrophy in older adults at risk for Alzheimer’s disease. Alzheimers Dement (Amst) 2016;4:14–17. doi: 10.1016/j.dadm.2016.03.005. [DOI] [PMC free article] [PubMed] [Google Scholar]
- 34.Dougherty RJ, Schultz SA, Boots EA, Ellingson LD, Meyer JD, Van Riper S, Stegner AJ, Edwards DF, Oh JM, Einerson J, Korcarz CE, Koscik RL, Dowling MN, Gallagher CL, Carlsson CM, Rowley HA, Bendlin BB, Asthana S, Hermann BP, Sager MA, Stein JH, Johnson SC, Okonkwo OC, Cook DB. Relationships between cardiorespiratory fitness, hippocampal volume, and episodic memory in a population at risk for Alzheimer’s disease. Brain Behav. 2017;7:e00625. doi: 10.1002/brb3.625. [DOI] [PMC free article] [PubMed] [Google Scholar]
- 35.Boots EA, Schultz SA, Oh JM, Larson J, Edwards D, Cook D, Koscik RL, Dowling MN, Gallagher CL, Carlsson CM, Rowley HA, Bendlin BB, LaRue A, Asthana S, Hermann BP, Sager MA, Johnson SC, Okonkwo OC. Cardiorespiratory fitness is associated with brain structure, cognition, and mood in a middle-aged cohort at risk for Alzheimer’s disease. Brain Imaging Behav. 2015;9:639–649. doi: 10.1007/s11682-014-9325-9. [DOI] [PMC free article] [PubMed] [Google Scholar]
- 36.Schultz SA, Boots EA, Almeida RP, Oh JM, Einerson J, Korcarz CE, Edwards DF, Koscik RL, Dowling MN, Gallagher CL, Bendlin BB, Christian BT, Zetterberg H, Blennow K, Carlsson CM, Asthana S, Hermann BP, Sager MA, Johnson SC, Stein JH, Okonkwo OC. Cardiorespiratory fitness attenuates the influence of amyloid on cognition. J Int Neuropsychol Soc. 2015;21:841–850. doi: 10.1017/S1355617715000843. [DOI] [PMC free article] [PubMed] [Google Scholar]
- 37.Reiter K, Nielson KA, Smith TJ, Weiss LR, Alfini AJ, Smith JC. Improved cardiorespiratory fitness is associated with increased cortical thickness in mild cognitive impairment. J Int Neuropsychol Soc. 2015;21:757–767. doi: 10.1017/S135561771500079X. [DOI] [PMC free article] [PubMed] [Google Scholar]
- 38.Doi T, Makizako H, Shimada H, Tsutsumimoto K, Hotta R, Nakakubo S, Park H, Suzuki T. Objectively measured physical activity, brain atrophy, and white matter lesions in older adults with mild cognitive impairment. Exp Gerontol. 2015;62:1–6. doi: 10.1016/j.exger.2014.12.011. [DOI] [PubMed] [Google Scholar]
- 39.Makizako H, Liu-Ambrose T, Shimada H, Doi T, Park H, Tsutsumimoto K, Suzuki T. Moderate-intensity physical activity, hippocampal volume, and memory in older adults with mild cognitive impairment. J Gerontol A Biol Sci Med Sci. 2015;70:480–486. doi: 10.1093/gerona/glu136. [DOI] [PubMed] [Google Scholar]
- 40.Burzynska AZ, Chaddock-Heyman L, Voss MW, Wong CN, Gothe NP, Olson EA, Knecht A, Lewis A, Monti JM, Cooke GE, Wojcicki TR, Fanning J, Chung HD, Awick E, McAuley E, Kramer AF. Physical activity and cardiorespiratory fitness are beneficial for white matter in low-fit older adults. PLoS One. 2014;9:e107413. doi: 10.1371/journal.pone.0107413. [DOI] [PMC free article] [PubMed] [Google Scholar]
- 41.Varma VR, Chuang YF, Harris GC, Tan EJ, Carlson MC. Low-intensity daily walking activity is associated with hippocampal volume in older adults. Hippocampus. 2015;25:605–615. doi: 10.1002/hipo.22397. [DOI] [PMC free article] [PubMed] [Google Scholar]
- 42.Hayes SM, Alosco ML, Hayes JP, Cadden C, Peterson KM, Allsup K, Forman DE, Sperling RA, Verfaellie M. Physical activity is positively associated with episodicmemory in aging. J Int Neuropsychol Soc. 2015;21:780–790. doi: 10.1017/S1355617715000910. [DOI] [PMC free article] [PubMed] [Google Scholar]
- 43.Brown BM, Peiffer JJ, Sohrabi HR, Mondal A, Gupta VB, Rainey-Smith SR, Taddei K, Burnham S, Ellis KA, Szoeke C, Masters CL, Ames D, Rowe CC, Martins RN. Intense physical activity is associated with cognitive performance in theelderly. Transl Psychiatry. 2012;2:e191. doi: 10.1038/tp.2012.118. [DOI] [PMC free article] [PubMed] [Google Scholar]
- 44.Wilbur J, Marquez DX, Fogg L, Wilson RS, Staffileno BA, Hoyem RL, Morris MC, Bustamante EE, Manning AF. The relationship between physical activity andcognition in older Latinos. J Gerontol B Psychol Sci Soc Sci. 2012;67:525–534. doi: 10.1093/geronb/gbr137. [DOI] [PubMed] [Google Scholar]
- 45.Nelson ME, Rejeski WJ, Blair SN, Duncan PW, Judge JO, King AC, Macera CA, Castaneda-Sceppa C. Physical activity and public health in older adults: Recommendation from the American College of Sports Medicine and the American Heart Association. Med Sci Sports Exerc. 2007;39:1435–1445. doi: 10.1249/mss.0b013e3180616aa2. [DOI] [PubMed] [Google Scholar]
- 46.Kemppainen J, Aalto S, Fujimoto T, Kalliokoski KK, Långsjö J, Oikonen V, Rinne J, Nuutila P, Knuuti J. High intensity exercise decreases global brain glucose uptake in humans. J Physiol. 2005;568:323–332. doi: 10.1113/jphysiol.2005.091355. [DOI] [PMC free article] [PubMed] [Google Scholar]
- 47.Porto F, Coutinho A, Pinto A, Gualano B, Duran F, Prando S, Ono C, Spindola L, de Oliveira M, do Vale P, Nitrini R, Buchpiguel C, Brucki S. Effects of aerobic training on cognition and brain glucose metabolism in subjects with mild cognitive impairment. J Alzheimers Dis. 2015;46:747–760. doi: 10.3233/JAD-150033. [DOI] [PubMed] [Google Scholar]