

ABSTRACT
The nuclear lamina is a proteinaceous meshwork situated underneath the inner nuclear membrane and is composed of nuclear lamin proteins, which are type-V intermediate filaments. The LMNA gene gives rise to lamin A and lamin C through alternative splicing. Mutations in LMNA cause multiple diseases known as laminopathies, including Hutchinson-Gilford Progeria Syndrome (HGPS), a premature aging disorder caused by a point mutation that activates a cryptic 5′ splice site in exon 11, resulting in a 150 bp deletion in the LMNA mRNA and the production of the dominant lamin A isoform progerin. During RNA sequencing analysis of wild type and HGPS patient skin fibroblasts, we discovered two novel LMNA isoforms. LMNAΔ447 and LMNAΔ297 use an alternative 3′ splice acceptor site in the 3′ untranslated region, and either the HGPS cryptic 5′ splice site in exon 11 or the wild type 5′ splice site. Both isoforms are present at low levels in HGPS patient and wild type cells in multiple cell types. We validate and quantify the expression levels of these novel isoforms in HGPS and wild type fibroblasts. Overexpression of either LMNAΔ447 or LMNAΔ297 is not sufficient to induce the typical HGPS cellular disease phenotypes and no significant difference in the two isoforms were found between young and old fibroblasts. These results identify and characterize two novel RNA isoforms of LMNA produced through alternative splicing.
KEYWORDS: droplet digital PCR, Lamin, mRNA processing, laminopathies, alternative splicing, LMNA, lamin A, Nuclear structures, RNA processing, progerin, Hutchinson-Gilford Progeria Syndrome
Introduction
The nuclear lamina is a proteinaceous meshwork composed of multiple nuclear lamins, which are type-V intermediate filament proteins, located adjacent to the inner nuclear membrane.1 The nuclear lamina provides structural support to the nucleus and is involved in numerous nuclear processes including chromatin organization, DNA replication and splicing.1,2 The nuclear lamins are composed of A- and B-type lamins with the A-type lamins, lamin A and lamin C produced by alternative splicing of the LMNA gene, whereas lamin B1 and lamin B2 are generated from distinct genes.2 In addition to the major isoforms lamin A and C, several minor LMNA isoforms exist, including lamin C2, a germ-cell specific isoform identified in mice, and lamin AΔ10 which is present in multiple cell types and lacks exon 10.3,4 The regulatory mechanisms of LMNA splicing are only poorly characterized.5
Mutations in the LMNA gene lead to a variety of diseases known as laminopathies, which comprise a wide spectrum of tissue-specific and systemic disorders including muscular dystrophies, lipodystrophies, neuropathies and progeroid disorders.6–8 One such laminopathy, Hutchinson-Gilford Progeria Syndrome (HGPS), is a premature aging disorder caused by a point mutation in LMNA. HGPS is a splicing disease as the disease-causing mutation (C1824T) activates a cryptic 5′ splice site in exon 11, resulting in a 150 bp deletion in the LMNA mRNA.9,10 As a consequence, a lamin A protein isoform, progerin, is generated which is permanently farnesylated due to the removal of an endoproteolytic cleavage site located within the deleted region.9,10 HGPS patients exhibit rapid aging, leading to growth failure, hair loss, atherosclerosis, and vascular disease.11 Patient cells demonstrate various phenotypes associated with aging, among which are defects in nuclear morphology, chromatin structure, DNA repair mechanisms, and telomere structure.12–14
We report here the existence of additional LMNA RNA splicing isoforms in both HGPS and wild-type skin fibroblasts. LMNAΔ447 and LMNAΔ297 are low-abundance LMNA splicing isoforms that use a non-conventional 3′ splice site in the 3′ untranslated region and either the HGPS cryptic 5′ splice site or the wild type 5′ splice site. Despite the use of the HGPS 5′ cryptic splice site in LMNAΔ447 and the altered C-terminal amino acid sequence in both LMNAΔ447 and LMNAΔ297, these two isoforms do not confer HGPS cellular phenotypes and like progerin RNA their expression levels are not altered during normal aging.
Results
Novel LMNA splicing isoforms identification by RNA sequencing
As part of routine RNA sequencing (RNA-Seq) analysis of HGPS and control wild type hTERT-immortalized skin fibroblasts (N = 3; see Methods), we performed splice junction analysis around the LMNA exon 11/12 junction, which is mis-spliced in HGPS9,10 (Fig. 1A). Roughly 36 to 53 million raw reads were sequenced per sample. 91 to 96% of the adaptor filtered reads aligned to the hg19 reference genome (roughly 31 to 46 million read-pairs per sample). Sashimi plots from Integrative Genomics Viewer (IGV) were used to analyze LMNA splicing isoforms (see Methods). Analysis revealed several novel isoforms: LMNAΔ9(Ex12), LMNAΔ297, LMNAΔ447, LMNAΔ690, and LMNAΔ840 (Fig. 1A & Suppl. Fig. S1). The novel isoforms use three distinct alternative 3′ splice acceptor sites in exon 12 or in the 3′ untranslated region (UTR) in combination with either the wild type 5′ splice site or cryptic 5′ splice site active in HGPS (Fig. 1A). Splice junction counts indicated that these isoforms are expressed at low levels in both HGPS and wild type fibroblasts, comparable to the expression of LMNAΔ150 (progerin RNA) in wild type fibroblasts (Fig. 1C), which constitutes about 0.05% of total lamin A and C RNA.
Figure 1.

Novel isoforms of LMNA detected by RNA sequencing (RNA-seq). (A) Schematic representation of alternatively spliced isoforms LMNAwt, LMNAΔ150, LMNAΔ447, LMNAΔ297, LMNAΔ9(ex12), LMNAΔ840, and LMNAΔ690. Vertical dotted lines indicate alternative splice donor or acceptor sites (labeled “ss”). Arrows indicate predicted splice junction for each isoform, varying thickness indicates relative expression level. (B) Predicted C-terminus nucleotide and amino acid sequences for LMNAwt, LMNAΔ150, LMNAΔ297, and LMNAΔ447. The exon 11/exon 12 (or 3′ UTR) junction is indicated with a slash, truncated exon 11 with cryptic 5′ splice site use is marked with an asterisk, stop codon is highlighted in bold, and farnesylation motif “CSIM” is indicated for LMNAwt and LMNAΔ150 isoforms. (C) Splice junction counts by RNA-seq. Splice junction counts in wild type and HGPS fibroblasts are shown for LMNAwt, LMNAΔ150, LMNAΔ447, LMNAΔ297, LMNAΔ9(ex12), LMNAΔ840, and LMNAΔ690. Values represent averages +/− SD from 3 independent replicates.
We focused further analysis on LMNAΔ297 and LMNAΔ447 since bioinformatics analysis of the LMNA 3′UTR sequences revealed a high 3′ splice acceptor score which supported their existence in situ (data not shown). Sequence analysis revealed that these isoforms are in frame, use the first alternative 3′ splice acceptor site in the 3′UTR, and contain a stop codon 18 bp downstream, resulting in predicted proteins that are 2 amino acids shorter than wild type LMNA and LMNAΔ150, respectively, and lack the C-terminal farnesylation motif found in wild-type lamin A and progerin RNA (Fig. 1B & Suppl. Fig. S2). These isoforms lack exon 12 which normally encodes 8 residues (657-SPQNCSIM-664) and instead end with 6 in-frame residues (657-ETPHLP-662) encoded by the 3′ UTR.
LMNAΔ447 and LMNAΔ297 are low abundance transcripts in both wild type and HGPS skin fibroblasts
Expression of LMNAΔ447, and LMNAΔ297 was confirmed by semi-quantitative reverse transcription polymerase chain reaction (RT-PCR) using primers flanking the splice junctions for LMNA, LMNAΔ150, LMNAΔ447, and LMNAΔ297 in wild type and HGPS fibroblasts (Fig. 2A). We observed bands of 689 bp, 540 bp, 392 bp, and 242 bp corresponding to the predicted sizes of LMNA, LMNAΔ150, LMNAΔ297, and LMNAΔ447, respectively. The identities of these bands were confirmed by sequencing of the purified products (Fig. 2B and data not shown). The sequences of these bands verified the use of the predicted alternative 3′ splice acceptor sites observed in the splice junction analysis of the RNA-Seq data (Fig. 2B).
Figure 2.
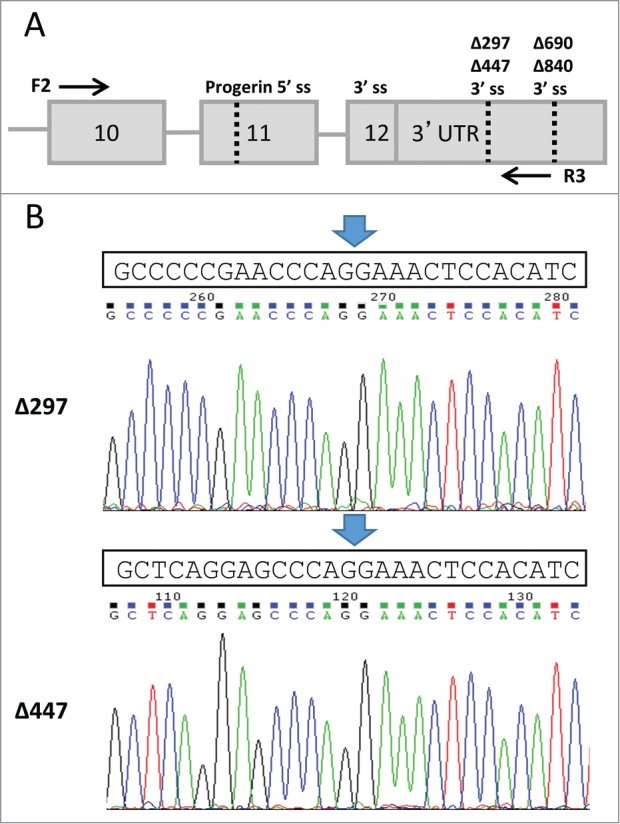
Confirmation of LMNAΔ297 and LMNAΔ447 isoform expression by RT-PCR. (A) Schematic representation of experimental setup for RT-PCR detection. Alternative 3′ splice acceptors and the progerin 5′ splice donor sites are indicated by dotted lines and labeled as splice site “ss." Flanking forward (F2) and reverse (R3) primers used for RT-PCR are shown as arrows. (B) Sequences of LMNAΔ297 and LMNAΔ447 were confirmed through gel extraction and direct sequencing of the PCR product. Predicted sequence is shown above the chromatograms for LMNAΔ297 and LMNΔ447, and the splice junction is indicated by arrow.
The results from the semi-quantitative PCR experiment established the expression of LMNAΔ447 and LMNAΔ297, however, they were unable to provide a quantitative measure of the expression relative to wild-type or total LMNA isoforms. To accurately determine the levels of these low abundance transcripts, we used a TaqMan probe-based droplet digital PCR (ddPCR) assay (see Methods). The raw transcript concentration was normalized to the absolute amount of cDNA and then to GAPDH concentration. We measured expression levels of LMNA as a control (Fig. 3A). As expected, LMNAΔ150 expression is much higher in HGPS fibroblasts than normal fibroblasts, constituting ∼19.25% of total LMNA isoforms (Fig. 3B and Table 1). We find that LMNAΔ447 represents ∼0.004% of total LMNA isoforms in wild type fibroblasts and ∼0.171% of total LMNA isoforms in HGPS cells (Fig. 3C and Table 1). LMNAΔ297 represents ∼0.008% of total LMNA isoforms in wild type fibroblasts and ∼0.003% of total LMNA isoforms in HGPS cells (Fig. 3D and Table 1). We also verified the expression of these novel isoforms by ddPCR in several non-fibroblast cell lines (Suppl. Fig. S3). These results further confirmed the existence of low-abundance LMNAΔ447 and LMNAΔ297 transcripts.
Figure 3.

Quantification of LMNA isoform expression levels by droplet digital PCR (ddPCR). (A-D) Levels of LMNA (lamin A), LMNAΔ150, LMNAΔ447, and LMNAΔ297 were measured in wild type (WT), and HGPS fibroblast cDNA samples by droplet digital PCR TaqMan assay. Raw transcript count in copies/ng was normalized to GAPDH. Values represent mean +/− SD derived from Poisson 95% confidence interval.
Table 1.
Levels of LMNA (lamin A), LMNC (lamin C), LMNAΔ150, LMNAΔ447, and LMNAΔ297. Complete data for the 2 experimental data sets (indicated by 1 or 2) averaged in Figure 3. Isoform expression is shown as a percentage of total summed LMNA transcript expression. Values represent mean +/− SD derived from Poisson 95% confidence interval.
| WT (1) | HGPS (1) | WT (2) | HGPS (2) | |
|---|---|---|---|---|
| LMNA | 41.727 +/− 1.799 | 33.872 +/− 0.600 | 35.744 +/− 1.105 | 33.851 +/− 0.885 |
| LMNC | 58.211 +/− 2.482 | 45.752 +/− 0.693 | 64.178 +/− 1.899 | 47.676 +/− 0.915 |
| LMNAΔ150 | 0.054 +/− 0.007 | 20.200 +/− 0.003 | 0.062 +/− 0.002 | 18.301 +/− 0.364 |
| LMNAΔ447 | 0.006 +/− 0.006 | 0.173 +/− 0.006 | 0.014 +/−0.002 | 0.168 +/− 0.006 |
| LMNAΔ297 | 0.002 +/− 0.001 | 0.003 +/− 0.001 | 0.002 +/− 0.001 | 0.003 +/− 0.001 |
LMNAΔ447 and LMNAΔ297 are not sufficient to recapitulate HGPS cellular phenotype
We sought to test whether, despite their relatively low abundance, LMNAΔ447 and LMNAΔ297 may still be functionally relevant in HGPS, particularly since LMNAΔ447 uses the same cryptic 5′ splice donor site as the disease-causing progerin RNA and has increased expression in HGPS cells. To this end, we designed N-terminal GFP-fusion constructs to investigate the function of these isoforms through lentiviral overexpression (Fig. 4A; see Methods). Upon overexpression of GFP-LMNA or GFP-LMNAΔ150 (estimated 2-fold over endogenous LMNA levels by qPCR; data not shown) in hTERT immortalized normal skin fibroblasts both fusion proteins are translated as demonstrated by Western blotting (Suppl. Fig. S4) and localize to the nuclear envelope (Fig. 4B), whereas GFP-LMNAΔ447 or GFP-LMNAΔ297 localize to the nuclear envelope and form intranuclear foci in a large proportion of cells (Fig. 4B, Suppl. Fig. S4). These intranuclear foci are similar to those seen upon expression of progerin-C661S, which lacks the C-terminal farnesylation site, resulting in accumulation of non-farnesylated progerin in intranuclear aggregates.15
Figure 4.

Characterization of novel LMNA isoforms through lentiviral overexpression. (A) Schematic representation of the components of the GFP-LMNA isoform construct used in lentiviral experiments. (B) Representative immunofluorescence images of DAPI stain, GFP signal, and lamin B1 stain in cell lines overexpressing GFP-LMNA, GFP-LMNAΔ150, GFP-LMNAΔ447, and GFP-LMNAΔ297. Scale bar size: 10 μm. (C) Quantification of lamin B1 (LMNB1) signal from 4 independent experiments (n>900 cells total). Significant differences in expression from cells overexpressing GFP-LMNA are indicated *p<0.05.
To characterize the function of LMNAΔ447 and LMNAΔ297, we compared fibroblasts overexpressing GFP-LMNAΔ447 and GFP-LMNAΔ297 to those overexpressing GFP-LMNA and GFP-LMNAΔ150. To assess the effects of these LMNA isoforms on nuclear phenotype, we used immunofluorescence staining to measure levels of nuclear protein lamin B, which has previously been reported to be reduced in the presence of progerin.16 One week after initial infection, expression of lamin B was decreased in cells overexpressing GFP-LMNAΔ150 compared with those overexpressing wild type GFP-LMNA (Fig. 4C; P-value < 0.05). However, overexpression of GFP-LMNAΔ447 and GFP-LMNAΔ297 resulted in a significant increase in lamin B protein compared with overexpression of wild type GFP-LMNA (Fig. 4C; P-value < 0.05). Given that the protein products of LMNAΔ297 and LMNAΔ447 only differ in length by 2 amino acids from each other and by only 8 amino acids compared with wild-type lamin A and progerin, respectively, detection of the endogenous proteins was unsuccessful due to the lack of specific antibodies. These results demonstrate that overexpression of LMNAΔ447 and LMNAΔ297 does not recapitulate the nuclear phenotype seen in HGPS.
Expression of LMNAΔ150 and LMNAΔ447 do not increase with biologic age
LMNAΔ150 mRNA and progerin protein has previously been shown to be present in cells and tissues from normally aged individuals, suggesting the use of the sub-optimal cryptic splice site present in wild-type cells.17 While some studies reported increased levels of progerin RNA and protein in aged individuals,18,19 others did not.17 We thus wanted to determine expression levels of these novel isoforms and LMNAΔ150 in fibroblasts from young vs. aged individuals. This was performed using quantitative ddPCR in a set of 9 primary fibroblasts cultures from young (17–30 years) and 10 primary fibroblasts cultures from old donors (81–85 years) (Suppl. Table S1).
We find no significant change in the expression of LMNA, LMNAΔ150, and LMNAΔ447 between the young and old groups (Fig. 5 & Suppl. Fig. S5). This indicates that there is no increase in the use of either the exon 11 cryptic splice site nor the novel 3′ splice acceptor site identified in LMNAΔ447 with age. Furthermore, in line with previous studies, we found low levels of LMNAΔ150 in wild type cells.17,19
Figure 5.
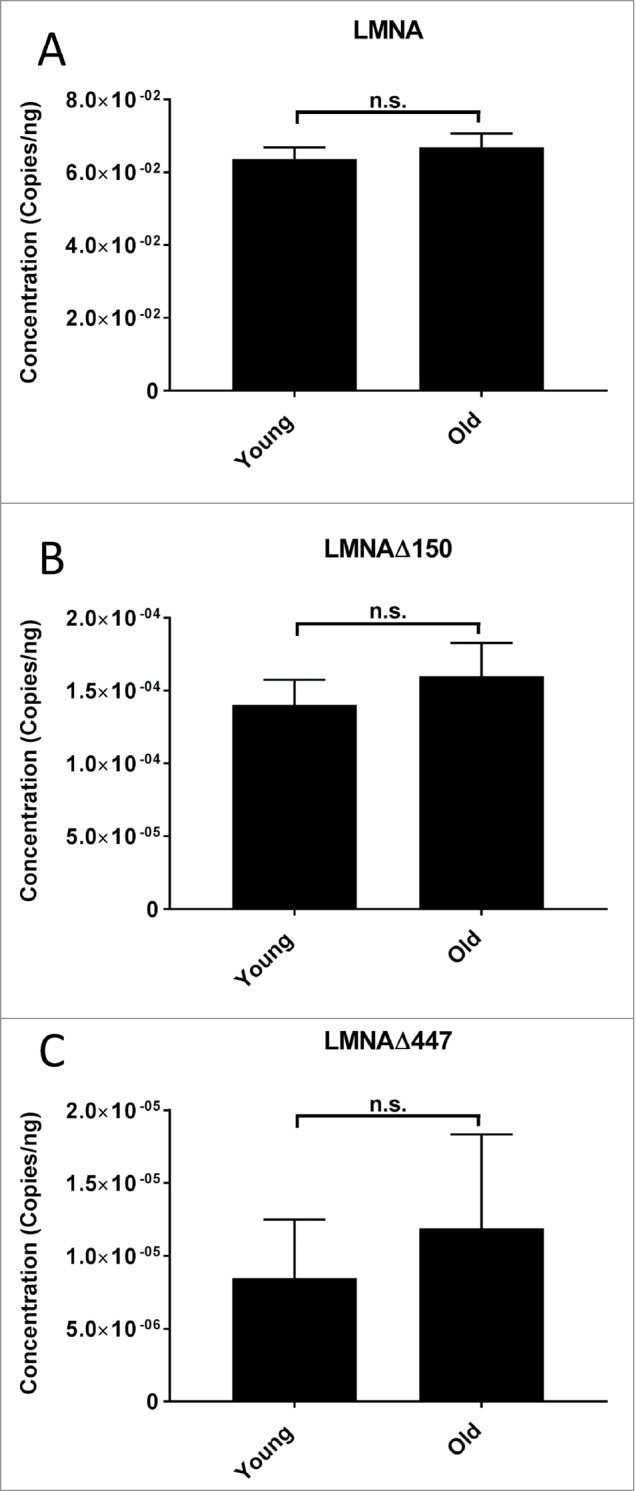
LMNA isoform mRNA expression levels in young and aged cell lines. Levels of LMNA, LMNAΔ150, and LMNAΔ447 were measured by ddPCR in primary fibroblast cultures from biologically young (n = 9) and old donors (n = 10). (A) Average levels of LMNA expression for young and old groups. Difference in expression is non-significant (n.s.); (p>0.05, 2 tailed students T-test), SD are indicated. (B) Average levels of LMNAΔ150 expression for young and old groups. Difference in expression is non-significant (p>0.05), SD are indicated. (C) Average levels of LMNAΔ447 expression for young and old groups. Difference in expression is non-significant (p>0.1, 2 tailed students T-test), SD are indicated. Complete data for individual cell lines is given in Suppl. Fig. S5.
Discussion
Here we have identified 2 novel RNA isoforms of the LMNA gene, LMNAΔ447 and LMNAΔ297. These isoforms use an alternative 3′ splice site in the 3′ untranslated region, and either the cryptic 5′ splice site active in HGPS or wild type 5′ splice site. We find that these are functional low abundance transcripts and that their expression does not induce HGPS cellular phenotypes.
We first detected these novel transcripts by unbiased RNA-seq analysis. Their existence was confirmed by semi-quantitative PCR and direct sequencing. Their abundance was determined by droplet digital PCR and determined to constitute ∼0.2% of total LMNA RNA.
While the absence of any specific antibodies against these novel isoforms, which only differ minimally from wild-type lamin A and progerin and lack the C-terminal farnesylation motif, prevented the detection of the endogenous proteins, we find that exogenous GFP-LMNAΔ447 and GFP-LMNAΔ297 localize to the nuclear envelope and form intranuclear foci in a large proportion of cells. This behavior is similar to that seen upon overexpression of progerin-C661S, which is defective for post-translational farnesylation due to the absence of the C-terminal farnesylation motif, and, in contrast to progerin, does not cause HGPS cellular phenotypes.15 The lack of the farnesylation motif in the 3′ UTR sequence of both LMNAΔ447 and LMNAΔ297 appears to have a similar effect on A-type lamin localization. Furthermore, overexpression of LMNAΔ447 and LMNAΔ297 does not recapitulate the nuclear phenotype seen in HGPS as observed by immunofluorescence. These results further support the functional importance of the permanent farnesylation of progerin as a contributor to HGPS.15,20
When analyzed by ddPCR, we find no significant change in the expression of LMNA, LMNAΔ150, and LMNAΔ447 between young and old fibroblasts. Similar conclusions had previously been reached based on RNA and protein analysis by some,17 while others have detected increased progerin RNA and protein levels with age.18,19 We find no indication that the use of the exon 11 cryptic 5′ splice site and the novel 3′ splice acceptor site identified increases with age. In addition, we find that LMNAΔ150 is present ∼300–400-fold lower levels in wild type fibroblasts than in HGPS cells and that it constitutes about 0.05% of total lamin A and C RNA in wild-type cells.
In conclusion, we have identified and characterized the expression of two novel isoforms of LMNA that use an alternative 3′ splice acceptor site in the 3′ UTR. Both isoforms are expressed at low levels and do not appear to be sufficient to cause the typical HGPS disease phenotypes. Despite their relatively low abundance, they may still have functional relevance and should be taken into account when assessing LMNA splicing patterns.
Methods
Cell lines and culture
hTERT immortalized HGPS skin fibroblasts (ATCC: AG0297-hTert) and hTERT immortalized CRL-1474 cells21 were used for most experiments. Cells were cultured in Minimum Essential Medium (Life Technologies) supplemented with 15% fetal bovine serum (FBS), 2 mM L-Glutamine, 1 mM sodium pyruvate, non-essential amino acids, and 100 U/ml penicillin and 100 μg/ml streptomycin at 37°C in 5% CO2.
Primary skin fibroblast cultures (9 young individuals, 10 old individuals; Table S1) were obtained from Coriell Biorepositories from the GRC Collection (Baltimore Longitudinal Study on Aging) and cultured in Minimum Essential Medium as described above. Each cell line was passaged to approximately 20 cPDL (cumulative passage doubling level) and was harvested for RNA and protein analysis.
U2OS (human bone osteosarcoma), PC3 (human prostate carcinoma), and hMSC (human mesenchymal stem cells)21 cell lines were used for detection of LMNA isoforms in non-fibroblast cell lines. Cells were cultured in Dulbecco's Modified Eagle Medium (Life Technologies) supplemented with 10% FBS, 2 mM L-Glutamine, 1 mM sodium pyruvate, non-essential amino acids, and 100 U/ml penicillin and 100 μg/ml streptomycin at 37°C in 5% CO2.
RNA extraction and cDNA synthesis
Cell cultures were rinsed with PBS and trypsinized, the cell suspension was pelleted and washed once with ice cold PBS and then lysed in 350 μl of RLTPlus buffer (Qiagen) for 3 × 10⁶ cells. RNA extraction was performed with RNeasy Mini Kit (Qiagen). cDNA synthesis was performed with either iScript cDNA synthesis kit (BioRad) or high-capacity cDNA reverse transcription kit (Applied Biosystems). Final cDNA samples were diluted to either 25 ng/μl or 5 ng/μl depending on the application.
Western blot
Cell cultures were washed with PBS and trypsinized. The cell suspension was pelleted and washed once with ice cold PBS. Cell pellets were then dissolved in an equal volume of 2X SDS-PAGE Laemmli sample buffer (BioRad) and denatured for 5 min at 95°C. Equal volumes of cell extract (with standard cell concentration) were loaded into NuPage Novex Bis-Tris 4–20% gradient gels (Lifesciences) and transferred onto immobilon-PVDF membranes (Millipore). Membranes were blocked with 5% milk/TBST (for β-actin) and 5% BSA/TBST (for lamins), incubated overnight at 4°C with goat-anti-GFP (Abcam, ab6673, 1:8000 dilution), goat-anti-lamin A/C (SantaCruz, sc-6215, 1:5000 dilution) or mouse-anti-β-Actin (Sigma, A2228, 1:50,000 dilution) primary antibody, diluted in their respective block buffer. Membranes were then washed 3X with TBST, incubated for 1 hour with HRP-conjugated secondary antibodies (donkey-anti-goat, sc2056, 1:5,000; rabbit-anti-mouse, IBA 2–1591–001, 1:50,000) and washed 3X with TBST. Protein detection was performed using ECL Western blotting detection system (Amersham) and imaged using BioRad ChemiDoc imaging system.
RNA sequencing
RNA sequencing was performed on total cDNA samples from immortalized HGPS patient and wild type skin fibroblast cells. Three experimental replicates were used per sample group. mRNA sequencing was performed at ACGT Inc., using poly(A) selected paired-end RNA libraries. Primary and secondary RNA-Seq analysis was performed using the CCBR Pipeliner V1.0 program.22 The pipeline automates several steps of the RNA-Seq analysis workflow, namely read-level QC (adaptor removal and quality trimming), splice-aware alignment to the reference genome, alignment-level QC metrics, read quantification and differential expression. The pipeline uses the Trimmomatic tool23 for quality trimming and removal of sequencing adapters. Comprehensive read-level quality metrics were then generated using the FastQC tool.24 Trimmed and adaptor-clipped reads were aligned to the hg19 reference genome using STAR25 in the 2-pass mode that accurately quantifies known and novel splice-junctions.
For each sample, the number of uniquely mapping reads crossing each splice-junction in the LMNA gene were extracted from the SJ.out.tab file and were normalized across the samples using trimmed mean of M-values (TMM). The alignment files from STAR 2-pass algorithm were loaded into IGV and the sashimi plots for the region spanning Exon11 to the UTR of the LMNA gene were visualized using IGV.26
RT-PCR and sequencing
RT-PCR was performed on cDNA samples from the RNA sequencing experiment. Semi-quantitative PCR was performed with flanking primers F2 5′-AGATGACCTGCTCCATCACC-3′ and R3 5′-GGGCAGAAAAGCAGAAGCTA-3′ using 40 amplification cycles (30 sec at 95°C, 30 sec at 58°C, 60 sec at 68°C) and final extension for 5 min at 68°C on a BioRad C1000 Touch Thermocycler. For sequencing, respective bands were enriched using additional 40 amplification cycles (30 sec at 95°C, 30 sec at 58°C, 45 sec at 68°C) and final extension for 5 min at 68°C. Agarose gel bands for LMNAΔ297 and LMNAΔ447 were extracted and purified using GeneJET Gel Extraction Kit (Thermo Scientific) and sequenced directly using primer F2 5′-AGATGACCTGCTCCATCACC-3′.
Droplet digital PCR
Droplet digital PCR (ddPCR) was performed on cDNA samples, using a TaqMan probe based assay with the following primer-probe pairs (F-forward, P-probe, R-reverse):
lamin A/C (total): F 5′-GTGTGGAAGGCACAGAACAC-3′, P 5′-GGTTGAGGACGACGAGGATG-3′, R 5′-GGTGATGGAGCAGGTCATCT-3′;
lamin A (wt): F 5′- CAGCTTCGGGGACAATCTG-3′, P 5′- GTCACCCGCTCCTACCTCCT-3′, R 5′- GGCATGAGGTGAGGAGGAC-3′;
lamin C: F 5′- ACGGCTCTCATCAACTCCAC-3′, P 5′- GGTTGAGGACGACGAGGATG-3′, R 5′- GCGGCGGCTACCACTCAC-3′;
lamin A (Δ150): F 5′-GCGTCAGGAGCCCTGAGC-3′, P 5′-AGCATCATGTAATCTGGGACCT-3′, R 5′-GACGCAGGAAGCCTCCAC-3′;
lamin A (Δ447): F 5′-CTGCCGACAAGGCATCTG-3′, P 5′-GCTCAGGAGCCCAGGAAACT-3′, R 5′-AAGCACCCCTTTCCCTTG-3′;
lamin A (Δ297): F 5′- ATCTGGTCACCCGCTCCTA-3′, P 5′-CGAACCCAGGAAACTCCACA-3′, R 5′- TCCCTTGGCTTCTAGAGGAA -3′; and
GAPDH BioRad PrimePCR™ ddPCR™ Expression Probe Assay: GAPDH, Human.
Droplets were generated from the reaction mixture using a BioRad AutoDG QX200™ Droplet Generator, the droplet mixture was then amplified using 40 amplification cycles (30 sec at 94°C, 60 sec at 58.5°C) on a BioRad C1000 Touch Thermocycler and amplification signal was measured in individual droplets using a BioRad QX200™ Droplet Reader. Analysis was performed using the BioRad QuantaSoft Software. After user determination of positive and negative signal, the raw transcript count per μl was calculated. Transcript count was then normalized to cDNA concentration and GAPDH signal to allow comparison between samples and assays.
Plasmid construction and lentiviral overexpression
Lentiviral expression plasmids for GFP-LMNAΔ297 and GFP-LMNAΔ447 were created by PCR amplification from previously made pCDHblast MCSNard GFP-lamin A and pCDHblast MCSNard GFP-progerin plasmids, generated by subcloning the GFP-LMNA and GFP-Progerin containing pBabepuro plasmids described in21 into the pCDHblast MCSNard plasmids described in.27 The PCR amplification used reverse extension primers containing the alternative 3′ untranslated region sequence and the EcoR1 restriction site 5′-CTAGGAATTCTTAAGGCAGATGTGGAGTTTCCTGGGTTCGGGGGCTGGA-3′ for LMNAΔ297 and 5′-CTAGGAATTCTTAAGGCAATGTGGAGTTTCCTGGGCCCTGAG-3′ for LMNAΔ447 along with forward primer 5′-CCAGCCCTACCTCGCAGC-3′ using 3 initial amplification cycles (30 sec at 95°C, 30 sec at 55°C, 60 sec at 68°C) and 32 further cycles (20 sec at 95°C, 30 sec at 58°C, 60 sec at 68°C) on a BioRad C1000 Touch Thermocycler. BsiW1 and EcoR1 sites were used for subsequent ligation with BsiW1/EcoR1 digested pCDHblast MCSNard GFP-lamin A and pCDHblast MCSNard GFP-progerin plasmids, respectively.
Lentivirus was produced in 293 FT cells (Invitrogen) co-transfected with pCDHblast MCSNard GFP-LMNA, GFP-LMNAΔ150, GFP-LMNAΔ447, or GFP-LMNAΔ297 in combination with pSPAX and pMD2.G vectors (provided by the laboratory of D. Trono). hTERT immortalized CRL-1474 cells were infected and selected at 48 hours with blasticidin. Infected cells were cultured in growing media.
Immunofluorescence staining
hTERT immortalized CRL-1474 fibroblasts overexpressing GFP-LMNA, GFP-LMNAΔ150, GFP-LMNAΔ447, or GFP-LMNAΔ297 were seeded in 384-well plates 72 hours before fixation. Cells were fixed by the addition of paraformaldehyde to a final concentration of 4% for 15 min, washed once with PBS/0.05% Tween-20, permeabilized with PBS/0.5% Triton-X 100 for 10 min, then washed again with PBS/0.05% Tween-20. Immunofluorescence staining was done according to the following protocol: 1 hour incubation with primary antibodies diluted in block buffer (5% BSA PBS/0.05% Tween-20), wash 3X with PBS/0.05% Tween-20, 1 hour incubation with fluorescent labeled secondary antibodies and DAPI (2.5 μg/ml) diluted in block buffer (5% BSA PBS/0.05% Tween-20), washed 3X with PBS/0.05% Tween-20. Plates were stored in PBS/0.05% Tween-20 at 4°C until imaging. The following primary and secondary antibodies were used: Lamin B1 (Abcam, ab16048,1:1000) and Alexa Fluor donkey-anti-rabbit 568 (Invitrogen A-21206, 1:200).
High-throughput immunofluorescence microscopy and automated image analysis
Using a Yokogawa CV7000S high-throughput spinning-disk confocal microscopy system, cells were imaged in a single focal plane with a 20X or 40X objective in 3 independent acquisitions with 405, 488, 561 nm excitation lasers. Images were analyzed using custom-developed Acapella Software (PerkinElmer) image analysis algorithms. After initial nuclear segmentation based on DAPI staining, the average nuclear intensity was determined for GFP-lamins and Lamin B1. A minimum of 900 cells per condition were analyzed.
Statistical methods
All tests of significance were performed using a 2 tailed Student's T-test. For ddPCR experiments, expression levels for single experiment (n>10,000) were given by the software as a 95% confidence interval and later converted to mean +/− standard deviation (SD) for ease of analysis.
Supplementary Material
Disclosure of potential conflicts of interest
No potential conflicts of interest were disclosed.
Acknowledgments
We thank Tatiana Karpova and Gianluca Pegoraro for help with microscopy. Imaging was performed in the NCI Fluorescence Imaging Facility and the NCI High-Throughput Imaging Facility. We thank the laboratory of D. Trono for plasmids. We also thank Nard Kubben for plasmids, assistance with plasmid construction, and advice on immunofluorescence experiments, Sandra Vidak for help with immunofluorescence experiments and Karen Meaburn for her comments on the manuscript.
Funding
This work was supported by the Intramural Research Program of the National Institutes of Health (NIH), National Cancer Institute, the Center for Cancer Research, and by a grant from the Progeria Research Foundation.
References
- [1].Gruenbaum Y, Foisner R. Lamins: nuclear intermediate filament proteins with fundamental functions in nuclear mechanics and genome regulation. Annu Rev Biochem. 2015;84:131-64. doi: 10.1146/annurev-biochem-060614-034115. PMID:25747401 [DOI] [PubMed] [Google Scholar]
- [2].Broers JL, Ramaekers FC, Bonne G, Yaou RB, Hutchison CJ. Nuclear lamins: laminopathies and their role in premature ageing. Physiol Rev. 2006;86:967-1008. doi: 10.1152/physrev.00047.2005. PMID:16816143 [DOI] [PubMed] [Google Scholar]
- [3].Furukawa K, Inagaki H, Hotta Y. Identification and cloning of an mRNA coding for a germ cell-specific A-type lamin in mice. Experimental cell research 1994;212:426-30. doi: 10.1006/excr.1994.1164. PMID:8187835 [DOI] [PubMed] [Google Scholar]
- [4].Machiels BM, Zorenc AH, Endert JM, Kuijpers HJ, van Eys GJ, Ramaekers FC, Broers JL. An alternative splicing product of the lamin A/C gene lacks exon 10. J Biol Chem 1996;271:9249-53. doi: 10.1074/jbc.271.16.9249. PMID:8621584 [DOI] [PubMed] [Google Scholar]
- [5].Lopez-Mejia IC, Vautrot V, De Toledo M Behm-Ansmant I, Bourgeois CF, Navarro CL, Osorio FG, Freije JM, Stévenin J, De Sandre-Giovannoli A, et al.. A conserved splicing mechanism of the LMNA gene controls premature aging. Human molecular genetics. 2011;20:4540-55. doi: 10.1093/hmg/ddr385. PMID:21875900. [DOI] [PubMed] [Google Scholar]
- [6].Worman HJ. Nuclear lamins and laminopathies. J Pathol. 2012;226:316-25. doi: 10.1002/path.2999. PMID:21953297 [DOI] [PMC free article] [PubMed] [Google Scholar]
- [7].Gonzalo S, Kreienkamp R, Askjaer P. Hutchinson-Gilford Progeria Syndrome: A premature aging disease caused by LMNA gene mutations. Ageing Res Rev. 2017;33:18-29. doi: 10.1016/j.arr.2016.06.007. PMID:27374873 [DOI] [PMC free article] [PubMed] [Google Scholar]
- [8].Vidak S, Foisner R. Molecular insights into the premature aging disease progeria. Histochem Cell Biol. 2016;145:401-17. doi: 10.1007/s00418-016-1411-1. PMID:26847180 [DOI] [PMC free article] [PubMed] [Google Scholar]
- [9].Eriksson M, Brown WT, Gordon LB, Glynn MW, Singer J, Scott L, Erdos MR, Robbins CM, Moses TY, Berglund P, et al.. Recurrent de novo point mutations in lamin A cause Hutchinson-Gilford progeria syndrome. Nature. 2003;423:293-8. doi: 10.1038/nature01629. PMID:12714972 [DOI] [PMC free article] [PubMed] [Google Scholar]
- [10].De Sandre-Giovannoli A Bernard R, Cau P, Navarro C, Amiel J, Boccaccio I, Lyonnet S, Stewart CL, Munnich A, Le Merrer M, et al.. Lamin a truncation in Hutchinson-Gilford progeria. Science. 2003;300:2055. doi: 10.1126/science.1084125. PMID:12702809 [DOI] [PubMed] [Google Scholar]
- [11].Merideth MA, Gordon LB, Clauss S, Sachdev V, Smith AC, Perry MB, Brewer CC, Zalewski C, Kim HJ, Solomon B, et al.. Phenotype and course of Hutchinson-Gilford progeria syndrome. N Engl J Med. 2008;358:592-604. doi: 10.1056/NEJMoa0706898. PMID:18256394 [DOI] [PMC free article] [PubMed] [Google Scholar]
- [12].McCord RP, Nazario-Toole A, Zhang H, Chines PS, Zhan Y, Erdos MR, Collins FS, Dekker J, Cao K. Correlated alterations in genome organization, histone methylation, and DNA-lamin A/C interactions in Hutchinson-Gilford progeria syndrome. Genome research. 2013;23:260-9. doi: 10.1101/gr.138032.112. PMID:23152449 [DOI] [PMC free article] [PubMed] [Google Scholar]
- [13].Cao K, Blair CD, Faddah DA, Kieckhaefer JE, Olive M, Erdos MR, Nabel EG, Collins FS. Progerin and telomere dysfunction collaborate to trigger cellular senescence in normal human fibroblasts. The Journal of clinical investigation. 2011;121:2833-44. doi: 10.1172/JCI43578. PMID:21670498 [DOI] [PMC free article] [PubMed] [Google Scholar]
- [14].Gordon LB, Rothman FG, Lopez-Otin C, Misteli T. Progeria: a paradigm for translational medicine. Cell. 2014;156:400-7. doi: 10.1016/j.cell.2013.12.028. PMID:24485450 [DOI] [PMC free article] [PubMed] [Google Scholar]
- [15].Yang SH, Chang SY, Ren S, Wang Y, Andres DA, Spielmann HP, Fong LG, Young SG. Absence of progeria-like disease phenotypes in knock-in mice expressing a non-farnesylated version of progerin. Human molecular genetics. 2011;20:436-44. doi: 10.1093/hmg/ddq490. PMID:21088111 [DOI] [PMC free article] [PubMed] [Google Scholar]
- [16].Scaffidi P, Misteli T. Reversal of the cellular phenotype in the premature aging disease Hutchinson-Gilford progeria syndrome. Nat Med. 2005;11:440-5. doi: 10.1038/nm1204. PMID:15750600 [DOI] [PMC free article] [PubMed] [Google Scholar]
- [17].Scaffidi P, Misteli T. Lamin A-Dependent Nuclear Defects in Human Aging. Science. 2006;312:1059-63. doi: 10.1126/science.1127168. PMID:16645051 [DOI] [PMC free article] [PubMed] [Google Scholar]
- [18].McClintock D, Ratner D, Lokuge M, Owens DM, Gordon LB, Collins FS, Djabali K. The mutant form of lamin A that causes Hutchinson-Gilford progeria is a biomarker of cellular aging in human skin. PloS one. 2007;2:e1269. doi: 10.1371/journal.pone.0001269. PMID:18060063 [DOI] [PMC free article] [PubMed] [Google Scholar]
- [19].Rodriguez S, Coppedè F, Sagelius H, Eriksson M. Increased expression of the Hutchinson-Gilford progeria syndrome truncated lamin A transcript during cell aging. Eur J Hum Genet. 2009;17:928-37. doi: 10.1038/ejhg.2008.270. PMID:19172989 [DOI] [PMC free article] [PubMed] [Google Scholar]
- [20].Moiseeva O, Lopes-Paciencia S, Huot G, Lessard F, Ferbeyre G. Permanent farnesylation of lamin A mutants linked to progeria impairs its phosphorylation at serine 22 during interphase. Aging (Albany NY). 2016;8:366-81. doi: 10.18632/aging.100903. PMID:26922519 [DOI] [PMC free article] [PubMed] [Google Scholar]
- [21].Scaffidi P, Misteli T. Lamin A-dependent misregulation of adult stem cells associated with accelerated ageing. Nat Cell Biol. 2008;10:452-9. doi: 10.1038/ncb1708. PMID:18311132 [DOI] [PMC free article] [PubMed] [Google Scholar]
- [22].CCBR Pipeliner V1.0 . [Google Scholar]
- [23].Bolger AM, Lohse M, Usadel B. Trimmomatic: a flexible trimmer for Illumina sequence data. Bioinformatics. 2014;30:2114-20. doi: 10.1093/bioinformatics/btu170. PMID:24695404 [DOI] [PMC free article] [PubMed] [Google Scholar]
- [24].Andrews S. FastQC: A Quality Control tool for High Throughput Sequence Data. 2012. http://www.bioinformatics.babraham.ac.uk/projects/fastqc/ [Google Scholar]
- [25].Dobin A, Davis CA, Schlesinger F, Drenkow J, Zaleski C, Jha S, Batut P, Chaisson M, Gingeras TR. STAR: ultrafast universal RNA-seq aligner. Bioinformatics. 2013;29:15-21. doi: 10.1093/bioinformatics/bts635. PMID:23104886 [DOI] [PMC free article] [PubMed] [Google Scholar]
- [26].Thorvaldsdóttir H, Robinson JT, Mesirov JP. Integrative Genomics Viewer (IGV): high-performance genomics data visualization and exploration. Brief Bioinform. 2013;14:178-92. doi: 10.1093/bib/bbs017. PMID:22517427 [DOI] [PMC free article] [PubMed] [Google Scholar]
- [27].Kubben N, Adriaens M, Meuleman W, Voncken JW, van Steensel B, Misteli T. Mapping of lamin A- and progerin-interacting genome regions. Chromosoma. 2012;121:447-64. doi: 10.1007/s00412-012-0376-7. PMID:22610065 [DOI] [PMC free article] [PubMed] [Google Scholar]
Associated Data
This section collects any data citations, data availability statements, or supplementary materials included in this article.